Abstract
Spectral parameter imaging in both the fundamental and harmonic of backscattered radiofrequency (RF) data was used for immediate visualization of high-intensity focused ultrasound (HIFU) lesion sites. A focused 5-MHz HIFU transducer with a coaxial 9-MHz focused single-element diagnostic transducer was used to create and scan lesions in chicken breast and freshly excised rabbit liver. B-mode images derived from the backscattered RF signal envelope were compared with midband fit (MBF) spectral parameter images in the fundamental (9-MHz) and harmonic (18-MHz) bands of the diagnostic probe. Images of HIFU-induced lesions derived from the MBF to the calibrated spectrum showed improved contrast (~ 3 dB) of tumor margins versus surround compared to images produced from the conventional signal envelope. MBF parameter images produced from the harmonic band showed higher contrast in attenuated structures (core, shadow) compared to either the conventional envelope (3.3 dB core; 11.6 dB shadow) or MBF images of the fundamental band (4.4 dB core; 7.4 dB shadow). The gradient between the lesion and surround was 3.4 dB/mm, 6.9 dB/mm and 17.2 dB/mm for B-mode, MBF-fundamental mode and MBF-harmonic mode respectively. Images of threshold and ‘popcorn’ lesions produced in freshly excised rabbit liver were most easily visualized and boundaries best defined using MBF-harmonic mode.
Keywords: High-intensity focused ultrasound, visualization, harmonic imaging, spectrum analysis
Background
High intensity focused ultrasound (HIFU) has a long history as a modality for treatment of cancer as well as other pathologies. The earliest reported clinical use of HIFU was for treatment of Parkinson’s disease (Fry et al. 1954). Clinical applications include treatment of renal tumors (Wu et al. 2003b; Marberger et al. 2005; Kohrmann et al. 2002), prostate cancer (Gelet et al. 2000; Thuroff et al. 2003; Blana et al. 2004), liver cancer (ter Haar et al. 1989; Yang et al. 1993; Kennedy et al. 2004) and breast cancer (Wu et al. 2003a, 2004; Gianfelice et al. 2004), among others. In the 1980’s our research group used HIFU for treatment of glaucoma (Coleman et al. 1985; Burgess et al. 1986; Silverman et al. 1991) and ocular tumors (Silverman et al. 1986; Coleman et al. 1986). The first FDA approved commercial HIFU instrument (for glaucoma treatment), manufactured by Sonocare, Inc., was an outgrowth of this program. At present, a growing number of commercial systems exist. Among these are the Focused Ultrasound Surgery system manufactured by Chongqing Haifu (HIFU) Tech Co., Ltd. (Chongqing, China), which incorporates a 3.5-MHz diagnostic ultrasound probe, the Sonablate 500 system (Focus Surgery, Indianapolis, IN) which uses diagnostic ultrasound for guiding HIFU treatment of the prostate, and the ExAblate 2000, manufactured by InSightec-TxSonics (Haifa, Israel and Dallas, TX), which incorporates a 1.5T magnetic resonance imaging surface coil.
A potential disadvantage of HIFU in comparison to radiation therapy is the difficulty of precisely controlling beam localization and dosage to achieve the desired level of tissue destruction over the required tissue volume. Models incorporating acoustic beam propagation and the bioheat equation (Pennes 1948) and thermal dose (Sapareto and Dewey 1984) provide excellent prediction of lesion location and extent on the average (Muratore et al. 2003). However, because intervening and target tissues may be quite variable in their physical properties (scattering, refraction, absorption, speed-of-sound, perfusion), and because these properties may be temperature-dependent, beam intensity at the treatment site is difficult to predict (Mast et al. 2005).
An ideal means of surmounting the above problem would be a technique allowing HIFU-induced bioeffects to be visualized non-invasively during and after treatment. Monitoring the treatment site using diagnostic ultrasound would be a desirable means for detecting tissue changes, as this potentially offers real-time monitoring. Experience has shown that bioeffects can be detected when tissue is heated to a level such that gas bodies are formed. The generation of gas bodies during HIFU is known to affect the size, shape and location of lesions relative to the focal point due to their interaction with the therapeutic beam (Bailey et al 2001; Chavrier et al. 2000). During exposure, the acoustic signature of cavitation bubble collapse can be detected directly (Thomas et al. 2005). Veazy reported that HIFU exposure causes a transient increase in tissue backscatter which he attributed to the presence of HIFU-generated gas bodies (Vaezy et al. 2001). Gas bodies formed during HIFU exposure will cause an increase in backscatter because they represent a large discontinuity in acoustic impedance relative to soft tissues. When minute gas bodies are insonified, harmonics may be produced due to vibrational modes induced by interaction of the microbubble with the acoustic field (Cosgrove 1998). The advantage of this effect is that images formed in harmonic bands will allow rejection of fundamental-band backscatter from unaltered tissue structures.
Images formed at harmonics of the frequency emitted by the diagnostic transducer are known to show improved signal-noise ratio and lateral resolution compared to conventional images even in the absence of microbubbles (Wells 1994; Baker 1998; Duck 2002). This occurs as a result of non-linear effects during propagation of the ultrasound pulse due to progressive changes in phase speed. The generation of harmonics will vary depending upon the nonlinearity parameter, B/A, of the medium though which the pulse is propagating. (B/A is the ratio of the quadratic term to the linear term in the Taylor series representing variations of pressure with density in a medium (Duck 2002).) Generation of harmonics increases as pulse intensity increases, and while cumulative, are generated primarily in the region near the focus where pulse intensity is greatest. Tissue harmonic images are produced from the signal envelope after bandpass filtering or from the envelope of the additive signal of consecutive phase inverted pulses (Simpson et al. 1999).
An approach that has been developed and explored by our research group for tissue characterization is calibrated power spectrum analysis (Lizzi et al. 1983). The system is calibrated by exciting the transducer with an impulse and recording the reflected signal from an optically flat surface aligned normally to the beam axis in the focal plane with degassed water as the propagation medium. This signal is then treated as the system impulse response, incorporating the effects of the transducer and electronic components (pulser/receiver, digitizer). By subtracting the power spectrum of the impulse response from that of the tissue, the amplitude of backscatter as a function of frequency within the bandwidth of the transducer independent of system characteristics is determined. This information can then be used in conjunction with mathematical models to estimate effective scatterer diameter and CQ2, where C represents scatterer concentration (scatterers/unit volume) and Q represents the relative impedance of the scatterers. These parameters are computed from the linear best fit equation to the calibrated power spectrum within the bandwidth of the transducer. Another parameter that can be generated is midband-fit (MBF), the amplitude of the best-fit equation at the center frequency. MBF is closely related to integrated backscatter (O’Donnell et al. 1979), since the product of MBF and bandwidth approximates the integral of the calibrated power spectrum over the transducer bandwidth. Parameter images representing the spatial distribution of spectral parameters can be produced by performing spectral analyses on consecutive gated regions within the image (Lizzi et al. 1997). Pixel intensity or color is then used to represent the value of the parameter, rather than the amplitude of the signal envelope.
A number of experimental studies utilizing these models have been performed (Insana 1996; Hosokawa et al. 1994; Garra et al. 1994), including characterization of renal disease (Insana 1996; Garra et al. 1994), liver disease (Stetson and Sommer 1997), breast tumors (Anderson et al. 2001; Donohue et al. 2001), skin (Fournier et al. 2001) and atherosclerotic plaque (Moore et al. 1998; Watson et al. 2000; Nair et al. 2001), among others. This general methodology has been applied by our research group for characterization of ocular tumors (Coleman et al. 2004; Liu et al. 2004; Silverman et al. 2003) and prostate cancer (Feleppa et al. 2002; Feleppa et al. 2004).
The above methodology rests on the assumptions of the Born approximation: a sparse distribution of weak (small impedance mismatch with background) scatterers with no significant multiple scattering and negligible attenuation (Lizzi et al 1983). During HIFU, gas bodies (strong scatterers) generated at the lesion site may produce harmonics as they interact with the diagnostic pulses. Non-linear propagation may also occur and be affected by both the composition and heating of intervening tissues. This suggests that backscatter within the harmonic band might be enhanced at the lesion site relative to surrounding tissues. Tissue characterization methods may thus remain applicable if our goal is to improve contrast between HIFU lesion sites and background tissues. This report describes initial findings using spectral parameter imaging based on the second harmonic for improving visualization of HIFU lesion sites.
Methods
The HIFU transducer assembly (Sonic Concepts, Bothell, WA) shown in Fig. 1 consists of a PZT spherical shell with a diameter of 35 mm and focal length of 40 mm. A diagnostic transducer (Panametrics, Waltham, MA) with a 9-MHz center frequency is inserted through an aperture in the center of the HIFU assembly, providing coaxial diagnostic and HIFU beams. The diagnostic transducer has an aperture of 8.5 mm and a 35-mm focal length.
Figure 1.
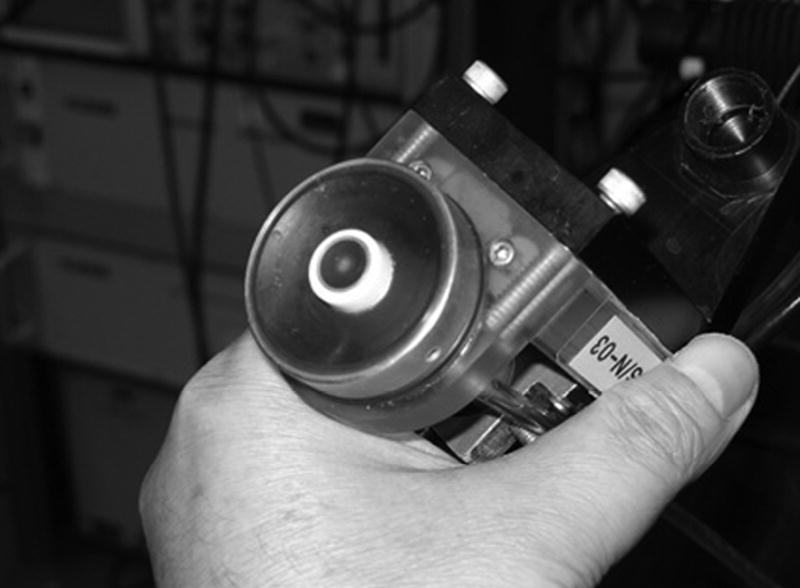
HIFU transducer assembly pictured here consists of a spherical shell emitting at 5 MHz and a coaxial and confocal 9 MHz diagnostic transducer.
During operation, a continuous 5-MHz sine wave is generated by a waveform generator (HP 3314A, Hewlett-Packard, Palo Alto, CA) and amplified by an RF-power amplifier (ENI A150, ENI, Rochester, NY) whose output excited the HIFU transducer. Calibration is performed by measuring the radiation force directed towards an absorbent material using a sensitive balance. This was then converted to watts and focal plane power determined by dividing by the beam area in the focal plane.
The custom diagnostic system utilized a custom pulser/receiver (developer W. D. Richard, Ph.D., Washington University, St. Louis, MO) with an analog bandwidth of 75 MHz and capability of generating half- or full-cycle (positive or inverted) excitation pulses at frequencies from 5 to 50 MHz. A 9-MHz full-cycle pulse with a 40-Vpp amplitude was used to excite the transducer at its fundamental.
We determined the power spectrum of the diagnostic probe in the focal plane in pulse-echo mode using a quartz reflector. We then measured the power spectrum using a calibrated 0.2 mm aperture needle hydrophone (Precision Acoustics, Dorchester, UK). Measurements were made along the beam axis at 5 mm intervals ± 25 mm relative to the focal plane.
Thermal lesions were produced in degassed chicken breast and freshly excised rabbit liver. In all cases, degassed normal saline was used as the coupling medium. Before and after lesions were generated, the HIFU assembly, which was mounted on an x-y-z assembly of computer-controlled linear translation stages, was scanned across the treatment site in a series of parallel planes and diagnostic RF data were acquired from the coaxially positioned diagnostic ultrasound probe and B-mode images displayed. RF data were acquired at a sample rate of 200 MSample/sec (12 bits/sample) using an Acqiris DP310 digitizer (Acqiris USA, Monroe, NY) and stored on the computer hard disk for post-processing. Ten parallel scan planes were acquired at intervals of 250 km. Each plane consisted of 128 vectors (2048 samples each) spaced 80 μm apart. The scan dimensions thus measured 7.9 mm in depth by 10.2 mm laterally within plane and 2.5 mm laterally across planes.
Post-processing involved generation of conventional gray-scale B-mode images produced from the signal envelope and MBF spectral parameter images restricted to the -12 dB fundamental (3–15 MHz) and to the second harmonic (16–23 MHz).
Spectral parameter images were produced using a sliding window of 64 samples in length by three vectors in width (i.e., ~240 x 240 μm). The analysis window was rastered over the image and spectra determined in overlapping regions of interest spaced at 4-sample intervals along each vector. Calibrated power spectra were computed by multiplying the windowed RF data by a Hamming function, taking the squared magnitude of the Fast Fourier Transform and subtracting the squared magnitude of the glass-plate calibration spectrum. The frequency dependent amplitude is then expressed in dB units relative to the calibration power spectrum. The linear least-squares best fit to the calibrated power spectrum within the band of interest was then computed and the MBF value recoded as pixel intensity. Spectral processing is illustrated in Fig. 2.
Figure 2.
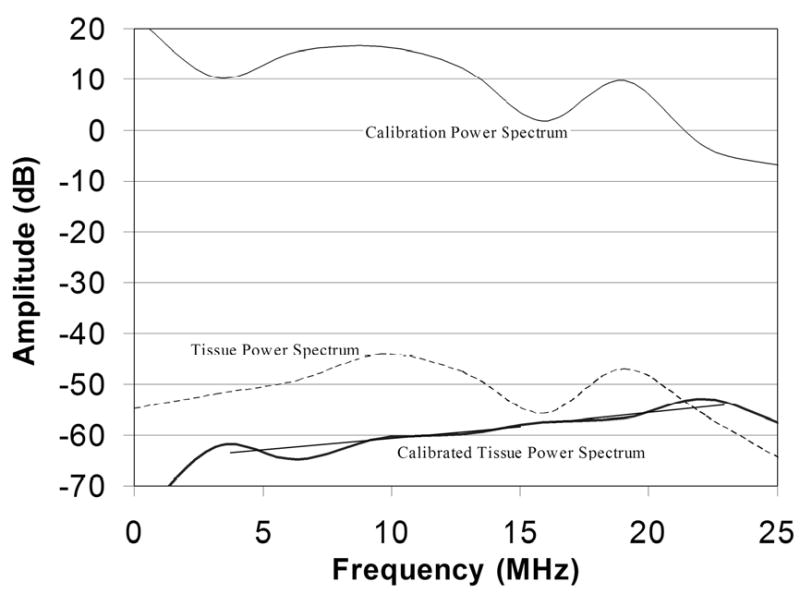
The pulse/echo calibration power spectrum of the diagnostic probe obtained under high excitation voltage with a quartz plate in the focal plane shows a harmonic of the 9-MHz fundamental at 18-MHz. The figure also shows a representative untreated tissue power spectrum, which is similar in general form to the calibration spectrum. The calibrated tissue power spectrum corrects the raw tissue spectrum against the calibration spectrum. Linear regression lines within the fundamental and harmonic bands are shown.
Results
As demonstrated in Fig. 2, the power spectrum of the signal reflected from a glass plate in the focal plane obtained at high driving voltage (40-Vpp) showed significant energy not only in the fundamental (centered at 9-MHz), but at the harmonic (centered at 18-MHz) as well. The harmonic band was approximately 8 dB lower in amplitude than the fundamental. When excited at reduced voltage (5-Vpp), the harmonic band was reduced to a negligible level. The figure also shows an example of a tissue power spectrum and the calibrated tissue power spectrum which corrects tissue spectra for the glass plate spectrum.
Hydrophone results, depicted in Fig. 3, show that at high driving voltage, the harmonic was at low levels relative to the fundamental in the near field, reached a maximum at the focal plane and decreased gradually into the far field. At reduced driving voltage, the harmonic was observed only in the focal region, and at a reduced level (-10 dB) compared to the fundamental.
Figure 3.
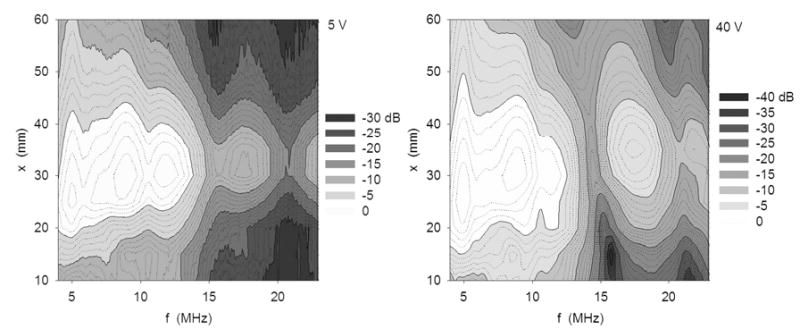
Contour plots of power spectra of the ~35 mm focal length diagnostic transducer at 5 V (left) and 40 V (right) excitation. Measurements were obtained along beam axis at 5 mm intervals ±25 mm of the focal plane. The harmonic component is more prominent at the higher excitation condition.
A HIFU-generated lesion in chicken breast is shown in gross external appearance and cross-section in Fig. 4. Mean calibrated power spectra from sample regions corresponding to the anterior edge, core and shadow regions of the lesion are shown in Fig. 5. As is demonstrated in Fig. 5, spectral differences between these regions were small in the fundamental band, but much larger in the harmonic. As demonstrated in Fig. 6, HIFU lesions were poorly visualized in conventional B-mode images generated from the envelope of the echo data. MBF parameter images centered at the fundamental were somewhat better than the conventional envelope, but MBF images centered at the harmonic showed far better contrast and delineation of lesion boundaries. Figure 7 shows the appearance of a lesion in MBF fundamental and harmonic modes in three parallel planes 0.5 mm apart. The maximal dimensions of the hyperechoic area of the lesion were approximately 3.0 mm deep by 3.4 mm across. This corresponds reasonably well with the dimensions of the blanched tissue area seen in Fig. 4, which measured 3.1 mm in depth by 2.4 mm across.
Figure 4.
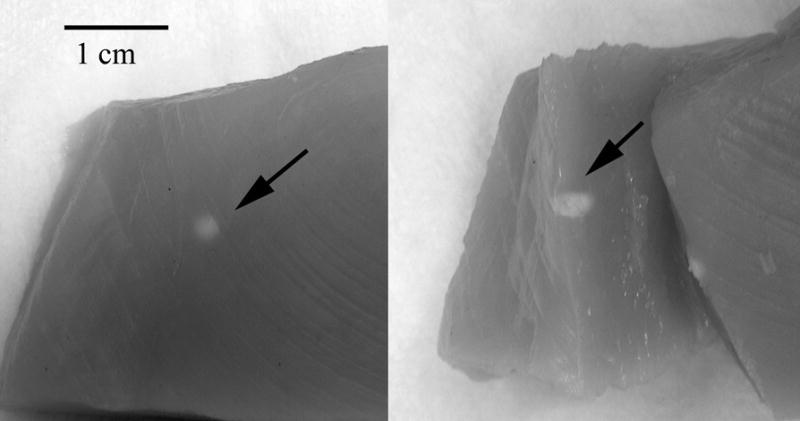
Photograph of lesion site in chick breast. In this case, the lesion was produced from a 15 second exposure at 5600 W/cm2. The external view (left) shows a typical blanched spot at the lesion site. The cross sectional view (right) shows tissue alteration to a depth of several millimeters.
Figure 5.
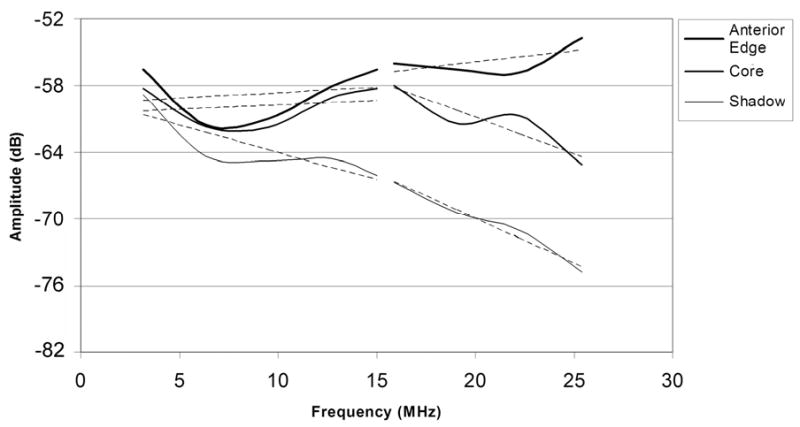
Mean calibrated power spectra obtained from the anterior edge, central core and ‘shadow’ of the lesion shown in Fig. 4, with linear best fit lines for fundamental and harmonic bands superimposed.
Figure 6.

Comparative B-mode (log-scale), fundamental MBF and harmonic MBF images of HIFU lesion in excised chicken breast shown in Fig. 4. Images measure 7.9 mm in depth by 10.2 mm laterally.
Figure 7.
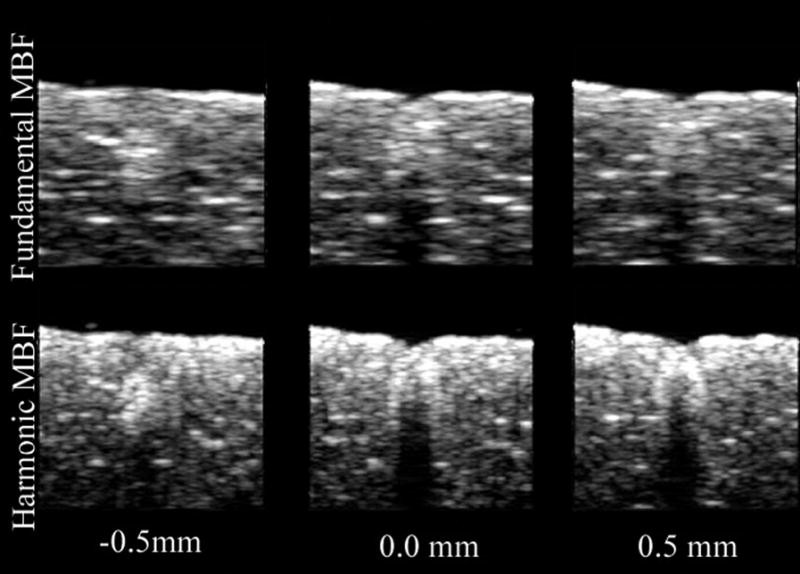
Comparative fundamental and harmonic MBF images of chicken breast HIFU lesion in three parallel planes at 0.5 mm intervals.
We analyzed the different image modes to determine signal amplitudes in five areas of interest in a single scan plane as shown in Fig. 8: the outer margin and inner margins of the lesion, the core of the lesion, the shadow posterior to the lesion, and normal untreated tissue. The results of this analysis (Table 1), expressed as the difference in signal amplitudes between adjacent tissue regions generally demonstrated higher contrast in MBF images than in B-mode, with harmonic MBF images providing greater contrast than fundamental MBF images. These numbers understate the qualitative improvement in lesion contrast in the harmonic MBF, because the improved spatial resolution of this image produces more distinct borders between these zones than in the other image modes. Measured laterally at a depth of 1.5 mm below the tissue surface, the gradients between the outer and inner lesion margins were 3.4 dB/mm, 6.9 dB/mm and 17.2 dB/mm for B-mode, MBF-fundamental mode and MBF-harmonic mode respectively.
Figure 8.
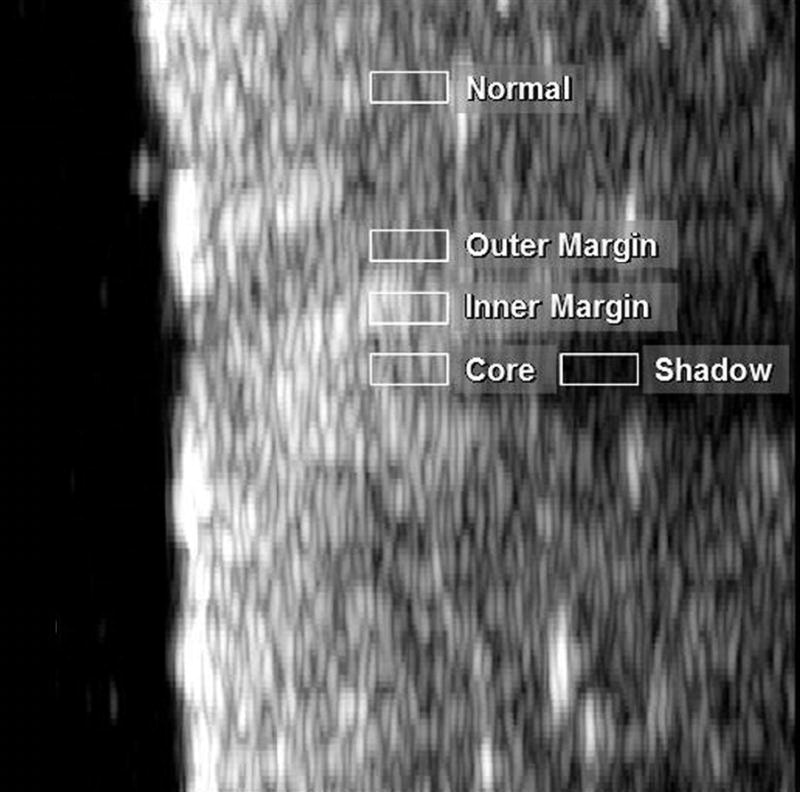
MBF image of lesion shown in Fig. 4 with areas selected for analysis indicated.
Table 1.
Contrast, in dB units, between adjacent tissue zones in the lesion shown in Fig. 4.
| Outer - Inner Margin | Inner Margin Core | Core - Shadow | Shadow - Background | |
|---|---|---|---|---|
| B-Mode | −4.73 | 1.3 | 9.72 | −5.07 |
| MBF Fundamental | −8.01 | 0.27 | 17.25 | −9.23 |
| MBF Harmonic | −7.85 | 4.66 | 19.82 | −16.67 |
We generated HIFU lesions in freshly excised rabbit liver, documenting comparative midband fit images in the fundamental and harmonic (Figs. 9 and 10). In Fig. 9, we visualized a lesion with threshold detectability on B-mode. This lesion was detectable in six consecutive MBF harmonic image planes, a 1.5 mm wide region. While the image is visible in all image modes, in conventional B-mode and MBF-fundamental, scattering from surrounding tissue makes the detection of the lesion ambiguous. The MBF-harmonic shows improved lateral resolution and a finer speckle pattern in surrounding tissues that make the lesion more easily seen. In Fig. 10, a ‘popcorn’ lesion is seen after a more prolonged, intense exposure. This is a situation in which a gas body forms at the focal point of the HIFU beam, leading to reflection of acoustic energy back towards the transducer, rapid tissue heating, and abrupt tissue disruption. This lesion was prominent in all nine consecutive scan planes. (During the experiment, an audible ‘pop’ was heard, and a small cloud of tissue matter was ejected from the exposure site into the fluid coupling medium.) While the popcorn lesion is evident in all display modes, the harmonic-MBF image provides greater detail of the lesion’s internal structure and boundaries with surrounding tissues.
Figure 9.
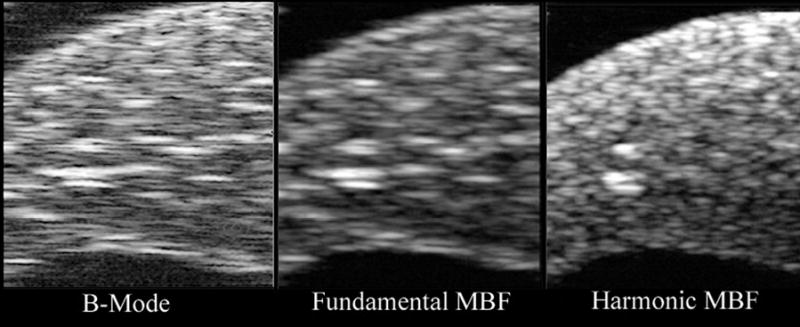
B-mode (log-scale), fundamental and harmonic MBF images of a threshold lesion in freshly excised rabbit liver. Lesion position is indicated by arrow in MBF-harmonic image. Images measure 7.9 mm in depth by 10.2 mm laterally. The lesion was produced from a 15 second exposure at 5600 W/cm2.
Figure 10.
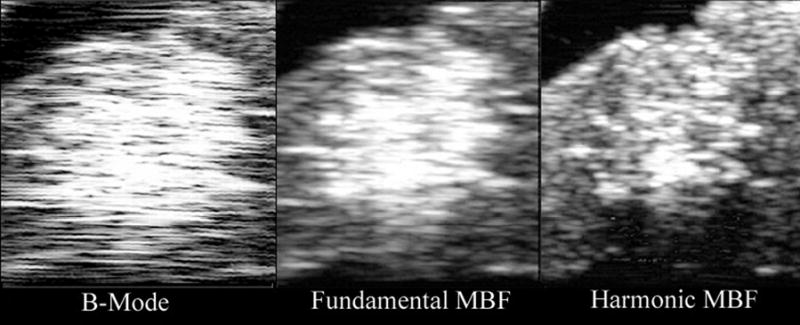
B-mode (log-scale), fundamental and harmonic MBF images of a ‘popcorn’ lesion in freshly excised rabbit liver. Images measure 7.9 mm in depth by 10.2 mm laterally. The lesion was produced by a 30 second exposure at 10,000 W/cm2.
Discussion
Unlike conventional B-mode or tissue harmonic images, MBF images provide a quantitative B-mode image corrected for system characteristics that relates to tissue microstructure. While MBF images do not compensate for variable attenuation and nonlinear propagation in intervening tissues, HIFU-generated changes in tissue properties are detectable due to their contrast with surrounding tissues. The variability of midband fit estimates has been shown to be proportional to (BL)−1/2, where B and L represent bandwidth and Hamming window length respectively (Lizzi 2003). The expanded value of L compared to conventional B-mode or harmonic imaging produces improved image quality, although at some cost in axial resolution (proportional to L). In the harmonic band, the number of wavelengths included in the window is double that of the fundamental, which would imply improved statistical stability of the estimate.
In this study, we found that images formed from the MBF of the harmonic had higher contrast and gradients compared to conventional B-mode and MBF parameter images formed from the fundamental. Comparative spectra through the axis of the lesion showed increased backscatter anteriorly, with strong attenuation of posterior tissues. In the fundamental, there was little difference between spectra of the anterior edge, core and shadow, while differences between spectra of these regions in the harmonic band were much greater. It is probable that generation of minute gas bodies or other tissue changes, such as protein denaturation, resulted in enhanced tissue echogenicity with increased attenuation causing shadowing of more posterior tissues. These observations are similar to those reported by Anand and Kaczhowski (2004), who using similar spectrum analysis methods found transient generation of harmonics and increased shadowing in the harmonic band during HIFU. Our findings also demonstrated higher gradients in backscatter between regions within the lesion and its surround in the MBF-harmonic mode. This may well be attributable to the expected improved lateral resolution in the harmonic band.
The occurrence of cavitation during HIFU will alter lesion shape, size and position in comparison to purely thermally generated lesions (Chavrier et al 2000; Curiel et al 2004). The role of gas-body generated harmonics versus non-linear propagation in the observations reported here is thus of significance because generation of gas bodies may not be desirable from the standpoint of control of lesion growth. Real-time application of the methods described in this report might allow detection and localization of early cavitation and improved control of lesion formation.
Acknowledgments
We wish to acknowledge the assistance of Sarayu Ramachandran in this project. Supported by NIH Grants CA84588 and EB000238 and Research to Prevent Blindness.
References
- Anand A, Kaczkowski PJ. Monitoring formation of high intensity focused ultrasound (HIFU) induced lesions using backscattered ultrasound. Acoust Res Let Online. 2004;5:88–94. [Google Scholar]
- Anderson ME, Soo MSC, Trahey GE. In vivo breast tissue backscatter measurements with 7.5- and 10-MHz transducers. Ultrasound Med Biol. 2001;27:75–81. doi: 10.1016/s0301-5629(00)00310-0. [DOI] [PubMed] [Google Scholar]
- Bailey MR, Couret LN, Sapozhnikov OA, Khokhlova BA, ter Haar G, Vaezy S, Shi X, Martin R, Crum LA. Use of overpressure to assess the role of bubbles in focused ultrasound lesion shape in vitro. Ultrasound Med Biol. 2001;27:695–708. doi: 10.1016/s0301-5629(01)00342-8. [DOI] [PubMed] [Google Scholar]
- Baker R. Non-linear effects in ultrasound propagation. In: Duck FA, Baker AC, Starritt HC, editors. Ultrasound in Medicine. Bristol: Institute of Physics Publishing; 1998. pp. 23–38. [Google Scholar]
- Blana A, Walter B, Rogenhofer S, Wieland WF. High-intensity focused ultrasound for the treatment of localized prostate cancer: 5-year experience. Urology. 2004;63:297–300. doi: 10.1016/j.urology.2003.09.020. [DOI] [PubMed] [Google Scholar]
- Burgess SEP, Silverman RH, Coleman DJ, Yablonski ME, Lizzi FL, Driller J, Rosado A, Dennis PH. Treatment of glaucoma with high-intensity focused ultrasound . Ophthalmology. 1986;93:831–838. doi: 10.1016/s0161-6420(86)33672-8. [DOI] [PubMed] [Google Scholar]
- Chavrier E, Chapelon JY, Gelet A, Cathignol D. Modeling of high-intensity focused ultrasound-induced lesions in the presence of cavitation bubbles. J Acoust Soc Am. 2000;108:432–440. doi: 10.1121/1.429476. [DOI] [PubMed] [Google Scholar]
- Coleman DJ, Lizzi FL, Driller J, Rosado A, Burgess SEP, Torpey JH, Smith ME, Silverman RH, Yablonski ME, Chang S, Rondeau MJ. Therapeutic ultrasound in the treatment of glaucoma: II. Clinical applications Ophthalmology. 1985;92:347–353. doi: 10.1016/s0161-6420(85)34028-9. [DOI] [PubMed] [Google Scholar]
- Coleman DJ, Lizzi FL, Burgess SEP, Silverman RH, Smith ME, Driller J, Rosado A, Ellsworth RM, Haik BG, Abramson DH, McCormick B. Ultrasonic hyperthermia and radiation in the management of intraocular malignant melanoma. Am J Ophth. 1986;101:635–642. doi: 10.1016/0002-9394(86)90761-0. [DOI] [PubMed] [Google Scholar]
- Coleman DJ, Silverman RH, Iwamoto T, Lizzi FL, Rondeau MJ, Driller J, Rosado A, Abramson DH, Ellsworth RM. Histopathologic effects of ultrasonically induced hyperthermia in intraocular malignant melanoma. Ophthalmology. 1988;95:970–981. doi: 10.1016/s0161-6420(88)33088-5. [DOI] [PubMed] [Google Scholar]
- Coleman DJ, Silverman RH, Rondeau MJ, Boldt HC, Lloyd HO, Lizzi FL, Weingeist TA, Chen X, Vangveeravong S, Folberg R. Noninvasive in vivo detection of prognostic indicators for high-risk uveal melanoma: ultrasound parameter imaging. Ophthalmology. 2004;111:558–564. doi: 10.1016/j.ophtha.2003.06.021. [DOI] [PubMed] [Google Scholar]
- Cosgrove DO. Echo-enhancing agents. In: Duck FA, Baker AC, Starritt HC, editors. Ultrasound in Medicine. Bristol: Institute of Physics Publishing; 1998. pp. 225–239. [Google Scholar]
- Curiel L, Chavrier F, Gignoux B, Pichardo S, Chesnais S, Chapelon JY. Experimental evaluation of lesion prediction modeling in the presence of cavitation bubbles: intended for high-intensity focused ultrasound prostate treatment. Med Biol Eng Comp. 2004;42:44–54. doi: 10.1007/BF02351010. [DOI] [PubMed] [Google Scholar]
- Donohue KD, Huang L, Burks T, Forsberg F, Piccoli CW. Tissue classification with generalized spectrum parameters. Ultrasound Med Biol. 2001;27:1505–1514. doi: 10.1016/s0301-5629(01)00468-9. [DOI] [PubMed] [Google Scholar]
- Duck FA. Nonlinear acoustics in diagnostic ultrasound. Ultrasound Med Biol. 2002;28:1–18. doi: 10.1016/s0301-5629(01)00463-x. [DOI] [PubMed] [Google Scholar]
- Feleppa EJ, Ennis RD, Schiff PB, Wuu CS, Kalisz A, Ketterling JA, Urban S, Liu T, Fair WR, Porter CR, Gillespie JR. Ultrasonic spectrum-analysis and neural-network classification as a basis for ultrasonic imaging to target brachytherapy of prostate cancer. Brachytherapy. 2002;1:48–53. doi: 10.1016/s1538-4721(02)00002-8. [DOI] [PubMed] [Google Scholar]
- Feleppa EJ, Porter CR, Ketterling J, Lee P, Dasgupta S, Urban S, Kalisz A. Recent developments in tissue-type imaging (TTI) for planning and monitoring treatment of prostate cancer. Ultrason Imaging. 2004;26:163–172. doi: 10.1177/016173460402600303. [DOI] [PMC free article] [PubMed] [Google Scholar]
- Fournier C, Bridal SL, Berger G, Laugier P. Reproducibility of skin characterization with backscattered spectra (12–25 MHz) in healthy subjects. Ultrasound Med Biol. 2001;27:603–610. doi: 10.1016/s0301-5629(01)00344-1. [DOI] [PubMed] [Google Scholar]
- Fry WJ, Mosberg WH, Barnard JW, Fry FJ. Production of focal destructive lesions in the central nervous system with ultrasound. J Neurosurg. 1954;11:471–478. doi: 10.3171/jns.1954.11.5.0471. [DOI] [PubMed] [Google Scholar]
- Garra BS, Insana MF, Sesterhenn IA, Hall TJ, Wagner RF, Rotellar C, Winchester J, Zeman RK. Quantitative ultrasonic detection of parenchymal structural change in diffuse renal disease. Invest Radiol. 1994;29:134–140. doi: 10.1097/00004424-199402000-00002. [DOI] [PubMed] [Google Scholar]
- Gianfelice D, Khiat A, Amara M, Belblidia A, Boulanger Y. MR imaging-guided focused US ablation of breast cancer: histopathologic assessment of effectiveness-initial experience. Radiology. 2003;227:849–855. doi: 10.1148/radiol.2281012163. [DOI] [PubMed] [Google Scholar]
- Gelet A, Chapelon JY, Bouvier R, Rouviere O, Lasne Y, Lyonnet D, Dubernard JM. Transrectal high-intensity focused ultrasound: minimally invasive therapy of localized prostate cancer. J Endourol. 2000;14:519–528. doi: 10.1089/end.2000.14.519. [DOI] [PubMed] [Google Scholar]
- Hosokawa T, Sigel B, Machi J, Kitamura H, Kolecki RV, Justin JR, Feleppa EJ, Tuszynski G, Kakegawa T. Experimental assessment of spectrum analysis of ultrasonic echoes as a method for estimating scatterer properties. Ultrasound Med Biol. 1994;20:463–470. doi: 10.1016/0301-5629(94)90101-5. [DOI] [PubMed] [Google Scholar]
- Insana MF. Ultrasonic imaging of microscopic structures in living organs. Int Rev Exp Pathol. 1996;36:73–92. [PubMed] [Google Scholar]
- Kennedy JE, Wu F, Haar GR, Gleeson FV, Phillips RR, Middleton MR, Cranston D. High-intensity focused ultrasound for the treatment of liver tumours. Ultrasonics. 2004;42:931–935. doi: 10.1016/j.ultras.2004.01.089. [DOI] [PubMed] [Google Scholar]
- Kharin N, Driscoll D, Tobocman W. Free of speckle ultrasonic imaging of soft tissue with account of second harmonic signal. Phys Med Biol. 2003;48:3239–2360. doi: 10.1088/0031-9155/48/19/010. [DOI] [PubMed] [Google Scholar]
- Kohrmann KU, Michel MS, Gaa J, Marlinghaus E, Alken P. High intensity focused ultrasound as noninvasive therapy for multifocal renal cell carcinoma: case study and review of the literature. J Urol. 2002;167:2397–2403. [PubMed] [Google Scholar]
- Liu T, Lizzi FL, Silverman RH, Kutcher GJ. Ultrasonic tissue characterization using 2-D spectrum analysis and its application in ocular tumor diagnosis. Med Phys. 2004;31:1032–1039. doi: 10.1118/1.1690196. [DOI] [PMC free article] [PubMed] [Google Scholar]
- Lizzi FL, Greenebaum M, Feleppa EJ, Elbaum M, Coleman DJ. Theoretical framework for spectrum analysis in ultrasonic tissue characterization. J Acoust Soc Am. 1983;73:1366–1373. doi: 10.1121/1.389241. [DOI] [PubMed] [Google Scholar]
- Lizzi FL, Astor M, Feleppa EJ, Shao M, Kalisz Statistical framework for ultrasonic spectral parameter imaging. Ultrasound Med Biol. 1997:1371–1882. doi: 10.1016/s0301-5629(97)00200-7. [DOI] [PubMed] [Google Scholar]
- Lizzi FL. Ultrasonic parametric imaging: a systems approach and clinical examples. Proc World Cong Ultra. 2003:629–635. [Google Scholar]
- Marberger M, Schatzl G, Cranston D, Kennedy JE. Extracorporeal ablation of renal tumors with high intensity focused ultrasound. BJU Int. 2005;95 (Suppl 2):52–55. doi: 10.1111/j.1464-410X.2005.05200.x. [DOI] [PubMed] [Google Scholar]
- Mast TD, Makin IRS, Faidi W, Runk MM, Barthe PG, Slayton MH. Bulk ablation of soft tissue with intense ultrasound: modeling and experiments. J Acoust Soc Am. 2005;118:2715–2724. doi: 10.1121/1.2011157. [DOI] [PubMed] [Google Scholar]
- Moore MP, Spencer T, Salter DM, Kearney PP, Shaw TR, Starkey IR, Fitzgerald PJ, Erbel R, Lange A, McDicken NW, Sutherland GR, Fox KA. Characterization of coronary atherosclerotic morphology by spectral analysis of radiofrequency signal: in vitro intravascular ultrasound study with histological and radiological validation. Heart. 1998;79:459–467. doi: 10.1136/hrt.79.5.459. [DOI] [PMC free article] [PubMed] [Google Scholar]
- Muratore R, Lizzi FL, Ramachandran SN, Engel D, Homma S, Marboe CC. Control of the size and shape of myocardial lesions produced by HIFU. In: Andrew MA, Crum LA, Vaezy S, editors. Therapeutic Ultrasound, Proceedings of the 2nd International Symposium. CIMU, Applied Physics Laboratory, University of Washington; 2003. pp. 323–329. [Google Scholar]
- Nair A, Kuban BD, Obuchowski N, Vince DG. Assessing spectral algorithms to predict atherosclerotic plaque composition with normalized and raw intravascular ultrasound data. Ultrasound Med Biol. 2001;27:1319–1331. doi: 10.1016/s0301-5629(01)00436-7. [DOI] [PubMed] [Google Scholar]
- O’Donnell M, Bauwens D, Mimbs JW, Miller JG. Broadband integrated backscatter: an approach to spatially localized tissue characterization in vivo. Proc IEEE Ultrasonics Symp. 1979:175–178. [Google Scholar]
- Pennes HH. Analysis of tissue and arterial blood temperatures in the resting human forearm. J Appl Physiol. 1948:93–122. doi: 10.1152/jappl.1948.1.2.93. [DOI] [PubMed] [Google Scholar]
- Sapareto SA, Dewey W. Thermal dose determination in cancer therapy. Int J Radiat Oncol Biol Phys. 1984;10:787–800. doi: 10.1016/0360-3016(84)90379-1. [DOI] [PubMed] [Google Scholar]
- Silverman RH, Coleman DJ, Lizzi FL, Torpey JH, Driller J, Iwamoto T, Burgess SEP, Rosado A. Ultrasonic tissue characterization and histopathology in tumor xenografts following ultrasonically induced hyperthermia. Ultrasound Med Biol. 1986;12:639–645. doi: 10.1016/0301-5629(86)90185-7. [DOI] [PubMed] [Google Scholar]
- Silverman RH, Vogelsang B, Rondeau MJ, Coleman DJ. Therapeutic ultrasound for the treatment of glaucoma. Am J Ophthalmol. 1991;111:327–337. doi: 10.1016/s0002-9394(14)72318-9. [DOI] [PubMed] [Google Scholar]
- Silverman RH, Folberg R, Rondeau MJ, Boldt HC, Lloyd HO, Chen X, Lizzi FL, Weingeist TA, Coleman DJ. Spectral parameter imaging for detection of prognostically significant histologic features in uveal melanoma. Ultrasound Med Biol. 2003;29:951–959. doi: 10.1016/s0301-5629(03)00907-4. [DOI] [PubMed] [Google Scholar]
- Simpson DH, Chin CT, Burns PN. Pulse inversion Doppler: A new method for detecting nonlinear echoes from microbubble contrast agents. IEEE Trans Ultra Ferro Freq Contr. 1999;46:372–382. doi: 10.1109/58.753026. [DOI] [PubMed] [Google Scholar]
- Stetson P, Sommer G. Ultrasonic characterization of tissues via backscatter frequency dependence. Ultrasound Med Biol. 1997;23:989–996. doi: 10.1016/s0301-5629(97)00080-x. [DOI] [PubMed] [Google Scholar]
- Ter Haar G, Sinnett D, Rivens I. High intensity focused ultrasound – a surgical technique for treatment of discrete liver tumours. Phys Ultra Biol. 1989;34:1743–1750. doi: 10.1088/0031-9155/34/11/021. [DOI] [PubMed] [Google Scholar]
- Thomas CR, Farny CH, Roy RA, Holt RG. A technique for monitoring and controlling cavitation activity during high intensity focused ultrasound application. ASA 149th Annual Meeting. J Acoust Soc Am. 2005;117:2530. [Google Scholar]
- Thuroff S, Chaussy C, Vallancien G, Wieland W, Kiel HJ, Le Duc A, Desgrandchamps F, De La Rosette JJ, Gelet A. High-intensity focused ultrasound and localized prostate cancer: efficacy results from the European multicentric study. J Endourol. 2003;17:673–677. doi: 10.1089/089277903322518699. [DOI] [PubMed] [Google Scholar]
- Vaezy S, Shi X, Martin RW, Chi E, Nelson PI, Bailey MR, Crum LA. Real-time visualization of high-intensity focused ultrasound treatment using ultrasound imaging. Ultrasound Med Biol. 2001;27:33–42. doi: 10.1016/s0301-5629(00)00279-9. [DOI] [PubMed] [Google Scholar]
- Watson RJ, McLean CC, Moore MP, Spencer T, Salter DM, Anderson T, Fox KA, McDicken WN. Classification of arterial plaque by spectral analysis of in vitro radio frequency intravascular ultrasound data. Ultrasound Med Biol. 2000;26:73–80. doi: 10.1016/s0301-5629(99)00112-x. [DOI] [PubMed] [Google Scholar]
- Wells PNT. Ultrasonic colour flow imaging. Phys Med Biol. 1994;39:2113–2145. doi: 10.1088/0031-9155/39/12/001. [DOI] [PubMed] [Google Scholar]
- Wu F, Wang ZB, Cao YD, Chen WZ, Bai J, Zou JZ, Zhu H. A randomized clinical trial of high-intensity focused ultrasound ablation for the treatment of patients with localized breast cancer. Br J Cancer. 2003a;89:2227–2233. doi: 10.1038/sj.bjc.6601411. [DOI] [PMC free article] [PubMed] [Google Scholar]
- Wu F, Wang ZB, Chen WZ, Bai J, Zhu H, Qiao TY. Preliminary experience using high intensity focused ultrasound for the treatment of patients with advanced stage renal malignancy. J Urol. 2003b;170:2237–2240. doi: 10.1097/01.ju.0000097123.34790.70. [DOI] [PubMed] [Google Scholar]
- Wu F, Wang ZB, Chen WZ, Zou JZ, Bai J, Zhu H, Li KQ, Xie FL, Jin CB, Su HB, Gao GW. Extracorporeal focused ultrasound surgery for treatment of human solid carcinomas: early Chinese clinical experience. Ultrasound Med Biol. 2004;30:245–260. doi: 10.1016/j.ultrasmedbio.2003.10.010. [DOI] [PubMed] [Google Scholar]
- Yang R, Sanghvi NT, Rescorla FJ, Kopecky KK, Grosfeld JL. Liver cancer ablation with extracorporeal high-intensity focused ultrasound. Eur Urol. 1993;23 (Suppl 1):17–22. doi: 10.1159/000474674. [DOI] [PubMed] [Google Scholar]


