Abstract
A classic example of a sustainable fishery is that targeting sockeye salmon in Bristol Bay, Alaska, where record catches have occurred during the last 20 years. The stock complex is an amalgamation of several hundred discrete spawning populations. Structured within lake systems, individual populations display diverse life history characteristics and local adaptations to the variation in spawning and rearing habitats. This biocomplexity has enabled the aggregate of populations to sustain its productivity despite major changes in climatic conditions affecting the freshwater and marine environments during the last century. Different geographic and life history components that were minor producers during one climatic regime have dominated during others, emphasizing that the biocomplexity of fish stocks is critical for maintaining their resilience to environmental change.
Keywords: climate change, resilience, Pacific salmon, endangered species, biodiversity
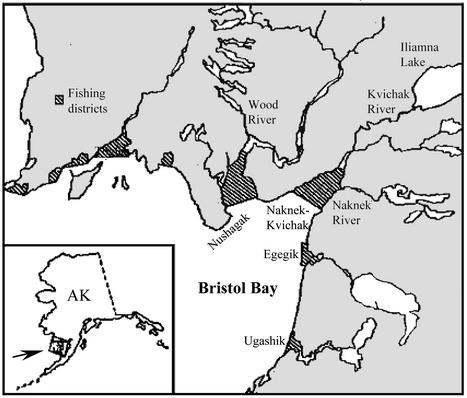
At a time of growing concern about the sustainability of many of the world's fisheries, several stand out as providing long-term sustainable yield. Among the most prominent successes are the fisheries for sockeye salmon in Bristol Bay, Alaska (Fig. 1), that have seen record returns and catches in the last two decades. This success is due in part to several factors including (i) favorable ocean conditions in recent decades, (ii) a single, accountable management agency, and (iii) a well established program of limited entry to the fishery. However, the biocomplexity of the stock structure has also played an critical role in providing stability and sustainability. Here we provide evidence for the effects of biocomplexity on sustainability and emphasize that conserving biocomplexity within fish stocks is important for maintaining their resilience to future environmental change.
Fig. 1.
Map of Bristol Bay, Alaska, showing the major lake systems producing sockeye salmon and the associated fishing districts. Figure is adapted from Minard and Meacham (37), which also gives an overview of Bristol Bay sockeye management practices.
The Biodiversity Of Bristol Bay Sockeye
Homing of Pacific salmon (Oncorhynchus spp.) to their natal sites results in reproductive isolation of populations, allowing natural selection to operate on heritable phenotypic traits, and the result is a wealth of distinct, locally adapted populations (1, 2). Sockeye salmon (Oncorhynchus nerka), for example, display a wide variety of life history types, each associated predictably with certain breeding and rearing habitats (3). The diversity of phenotypes thus reflects the adaptation of populations to the diversity of suitable habitats. Spawning by salmonid fishes generally takes place in lotic habitats, and Bristol Bay sockeye salmon spawn in streams and rivers ranging from 10 cm to several meters deep, and in substrate ranging from small gravel to cobble (4, 5). Some creeks have spring-fed ponds with much finer substrate and deeper, slowly flowing water, and these too are used for spawning. Sockeye also spawn in groundwater-fed beaches at the outwash areas of rivers and along hillsides with substantial groundwater inputs. In these habitats, sockeye may spawn from the shoreline to depths of several meters. Finally, sockeye may also spawn on the rocky beaches of low-lying islands that are too flat to develop groundwater but where wind-driven surface currents are sufficient to deliver highly oxygenated water to developing embryos buried in the coarse gravel (6).
Adult sockeye display a suite of adaptations to the diversity of spawning and incubation environments, seen repeatedly from one site to another (Table 1). First, the date of spawning reflects the long-term average thermal regime experienced by incubating eggs and the timing of food production for juvenile salmon in the spring. Simply put, the adults spawn at a date that, given the average thermal regime, will allow the embryos to complete embryonic development and emerge in time to feed on aquatic insects and zooplankton the following spring (7). Salmon spawn early (late July to mid-August) in small streams that experience cold temperatures during incubation but spawn later (late August to October) in large rivers and lakes that have substantial heat storage capacity (8).
Table 1. A summary of life history variation within the Bristol Bay stock complex of sockeye salmon.
| Element of biocomplexity | Range of traits or options found |
|---|---|
| Watershed location within Bristol Bay complex | Seven different major watersheds, ranging from maritime-influenced systems on the Alaskan Peninsula to more continental systems |
| Time of adult return to freshwater | June—September |
| Time of spawning | July—November |
| Spawning habitat | Major rivers, small streams, spring fed ponds, mainland beaches, island beaches |
| Body size and shape of adults | 130-190 mm body depth at 450 mm male length: sleek, fusiform to very deep-bodied, with exaggerated humps and jaws |
| Egg size | 88-116 mg at 450 mm female length |
| Energetic allocation within spawning period | Time between entry into spawning habitat and death ranges from 1-3 days to several weeks |
| Time spent rearing in freshwater | 0-3 years |
| Time spent at sea | 1-4 years |
Not only the timing of spawning but also the average size of the eggs reflects the habitat-specific features of the incubation environment. In general, salmon have very large eggs compared with other teleost fishes (9). The development of such large embryos is possible because the cold, highly oxygenated water counters the surface-to-volume constraint against large eggs and because size-selective predation (10) and competition favor large juveniles (11). Larger adult salmon have both larger and more numerous eggs than smaller salmon, but the energetic constraints on the female result in tradeoffs between egg size and egg number that are population-specific. Sockeye spawning in rocky island beaches have unusually large eggs (12). This takes advantage of the well oxygenated water and large interstitial spaces among the rocks to provide the offspring with abundant yolk to help survive the prolonged posthatching period that results from early spawning. In addition, large eggs may be less vulnerable to size-selective predation by sculpins (Cottus spp.) (13). In contrast to the island spawners, the eggs of females spawning in streams and rivers are of intermediate size (matching the size of incubation substrates), and those of females spawning in ponds and mainland beaches are very small, apparently an adaptation to the lower oxygen levels and reduced water circulation in the finer substrates that characterize these environments (12).
In addition to the adaptations of salmon for egg incubation the adults show habitat-specific tradeoffs between the pressures of sexual and natural selection. In the absence of intervening selection, large and deep-bodied male salmon have more opportunities to mate than smaller, less deep-bodied individuals (14). Large females have more and larger eggs (12) and can bury them deeper (15) than smaller females. However, size-selective predation by bears (16, 17, 18) and physical access to shallow streams (18, 19) favor smaller fish in the evolution of body size and morphology. The result is that salmon spawning on mainland and island beaches, where there is little predation and no difficulty of access, are deep-bodied for their length compared with sockeye spawning in rivers and creeks (19). In addition, the average age at maturity is greater for sockeye spawning in larger rivers than in smaller creeks (19, 20).
The dimensions of biocomplexity in Bristol Bay sockeye are summarized in Table 1. Because it is relatively easy to study salmon during their spawning period, we understand the diversity of life history strategies during this life stage better than for the freshwater rearing or marine portion of the life history. However, there is variation among lakes and populations within lakes in the proportion of salmon spending 1 or 2 years in freshwater before seaward migration and in the average size of smolts (21), and in the degree of diurnal predator avoidance exhibited by juveniles (22). Such variation, combined with variation in size after a fixed period of ocean residence (18), suggests far more diversity in foraging and survival strategies during these later two periods than we yet understand. This mixture of life history strategies and local adaptations within the Bristol Bay sockeye is likely what buffers the stock complex to large-scale changes in environmental conditions, and thus, provides its long-term stability.
Changes in Freshwater and Ocean Environments
Environmental conditions in both the freshwater and marine systems of the North Pacific Ocean have shown several substantial and important modes of variability relevant to the ecology and evolution of sockeye salmon. Time-series analyses of salmon catches and climatic conditions during the last century demonstrate that salmon populations have responded to climate variability across wide spatial and temporal scales (23). The dominant modes of temporal variability in atmospheric–oceanic conditions are attributable to subdecadal patterns associated with the El Niño Southern Oscillation (ENSO) and to the 50- to 70-year (interdecadal) climate oscillations that have operated over the North Pacific Basin for at least 300 years (24).
The interdecadal changes in marine–atmospheric conditions that appear to be linked to oscillations in the strength of the winter Aleutian Low pressure cell have received particular attention recently. This Pacific Decadal Oscillation (PDO) (25) is a pan-Pacific phenomenon that is distinct from other sources of climate variability in the Pacific (26). Positive phases of both the ENSO and the PDO are associated with warmer than average winter temperatures along the North American coast, cooler than average temperatures in the central North Pacific, and low atmospheric sea level pressure over much of the North Pacific basin (23, 26). However, whereas ENSO events last from 12–18 months and occur every 2–7 years, the PDO involves abrupt transitions in atmospheric–marine physical conditions that are stable and persist for 20–35 years (24, 25).
Marine ecosystems appear to respond in a strong, nonlinear manner to apparently subtle changes in the marine physical conditions associated with the PDO. Many biological features of the North Pacific show prominent changes between interdecadal phases of the PDO. These prolonged modifications in ecosystem organization associated with changes in atmospheric–oceanic coupling have been termed regimes (27). The productivity of Alaskan sockeye salmon populations appears to be among the more sensitive biological systems that respond to interdecadal climate shifts and is strongly coherent with changes in the PDO (23, 26). Biological responses to the PDO seem to be related to changes in marine phytoplankton productivity that are transmitted through zooplankton to fishes (28–30). Although the exact mechanisms for the linkage between ocean physical processes and salmon production are not understood, the largest effects appear to occur early in the marine life history of salmon, possibly as they move from their freshwater nursery habitats through nearshore marine systems (23).
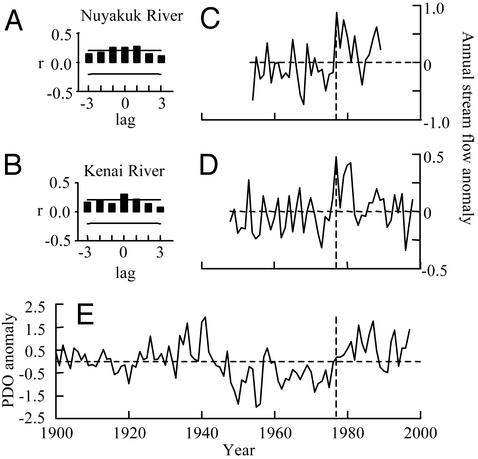
The terrestrial ecosystems of Alaska have also experienced substantial changes in climate during the last century that appear to be related to the same shifts in atmospheric conditions that drive variation in marine systems. For example, the length of the annual growing season in interior Alaska has increased from ≈130 days to ≈145 days since the 1950s (31). This lengthening of the growing season is also apparent in the timing of the spring thaw in sockeye nursery lakes in Bristol Bay (unpublished data). Much of the shift in growing season occurred during the late 1970s, at a time when the marine environment was exhibiting substantial, ecosystem-wide responses to a shift in the PDO (23). In general, interior Alaska has had relatively warm and wet conditions in the last two decades since the 1977/78 PDO shift (25). Time-series comparisons between coastal river flows and the PDO index demonstrate significant temporal coherence between atmospheric conditions associated with the PDO and the hydrologic conditions in sockeye spawning and nursery habitats (Fig. 2). When we use the Kenai River and the Nuyakuk River as examples, we see that climate regimes associated with positive phases of the PDO are characterized by relatively high stream flows, whereas negative phases of the PDO are associated with below-average flows (23, 25).
Fig. 2.
Comparisons of the average annual PDO index for 1900–1998 (E) (ref. 26 and http://tao.atmos.washington.edu/pdo) and annual streamflow for two coastal rivers in southwestern Alaska. All time series have been normalized to the long-term mean. (A and B) The cross correlation plots (CCF) between normalized annual flow for each of the two rivers and the annual average PDO index. Lags are shown for 1-year increments. Horizontal lines on A and B mark the significance bounds (P ≤ 0.05). Historical streamflow (annual ft3·s-1) is shown for the Nuyakuk River (59°56′08″N, 158°11′16″ W, C) in the Upper Nushagak drainage near Dillingham, Alaska (1954–1989) and for the Kenai River at Cooper Landing, Alaska (60°29′34″N, 149°48′28″ W, D) for 1948–1998.
Temporal and spatial variation in the hydrology of spawning and nursery habitats have important implications for both the spawning success of adult sockeye and for growth and survival of juveniles during their freshwater residency. For example, access to small spawning streams by adults is impeded during years with low flows (19) whereas access to spawning habitat on lake beaches may be much less dependent on hydrologic patterns. Survival of smolts during their seaward migration may also be enhanced during periods with high flow because of reduced vulnerability to freshwater predators. In general, years with high stream flows coincide with years of favorable near-shore marine conditions such that sockeye productivity may be enhanced at several stages of their life history (25).
There is apparent coordination among several critical physical and biological conditions important to sockeye salmon biology. Nevertheless, an outstanding characteristic of the responses of Bristol Bay sockeye to climate variation is that not all populations appear to respond coherently to documented shifts in the environment. We argue that this population-specific variability in response to climate fluctuations is ultimately responsible for the resilience of the entire Bristol Bay sockeye stock.
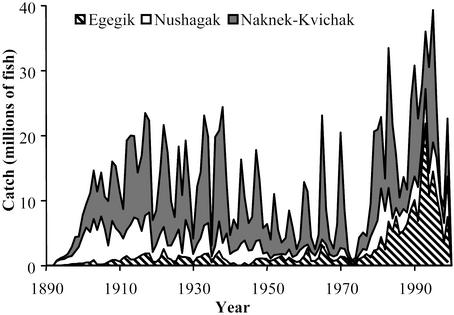
Historical Patterns of Stock Productivity
To illustrate the importance of biocomplexity of the Bristol Bay stock complex, we have broken down the historical sockeye catch into the contributions from the three major fishing districts (Naknek/Kvichak, Egegik, and Nushagak) (Fig. 3). Before the 1950s, we do not have estimates of the number of fish spawning in each river system and must use fishery catch as a surrogate for total run, but all major fisheries were already well developed by the early 20th century and catch is an excellent metric of total run size. We see that initially the Naknek/Kvichak was responsible for most of the sockeye production, with the Nushagak a close second and Egegik a small contributor. In the middle part of the 20th century, the importance of the Nushagak diminished, whereas Egegik remained roughly steady, and the Naknek/Kvichak dominated, driven almost exclusively by the Iliamna Lake populations. During that period, the Bristol Bay fishery was essentially a Naknek/Kvichak fishery. With the PDO regime shift of 1977 the Egegik run expanded greatly, so it was often at least as big than the Naknek/Kvichak, and the Nushagak system remained a small but steady contributor to the total fishery. In the 1990s the Naknek/Kvichak contribution declined dramatically, Egegik diminished, whereas Nushagak increased slightly to become, in some recent years, the most important fishery in Bristol Bay. Even within the Naknek/Kvichak district, the contribution of Iliamna Lake is now so small that it requires special protective fishery management to allow fishing on the Naknek populations.
Fig. 3.
Catch history of the three major fishing areas within Bristol Bay, Alaska. Contributions of the minor districts, Ugashik and Togiak, have averaged 4.6% since 1955.
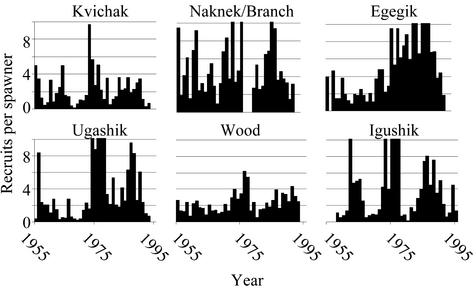
Since the 1950s, visual counting towers on the major rivers leading into the lake systems have provided reliable counts of the number of fish passing through the fishery en route to their spawning sites. The number of recruits per spawner is the total number of adult returns from a spawning year divided by the number of fish that spawned in that brood year, and is a measure of per capita reproductive success. We calculated this for individual systems within fishing districts associated with each of the major rivers in Bristol Bay to demonstrate the temporal changes in their productivity (Fig. 4). In Fig. 4 we see the Naknek/Kvichak broken into its two dominant components; the Kvichak River–Lake Iliamna system and the Naknek River system. The Nushagak fishing district consists of three distinct lake/river systems; the Igushik, the Wood, and the Nushagak (not shown in Fig. 4). Finally the Ugashik system is the most remote of Bristol Bay's systems, located on the Alaska Peninsula.
Fig. 4.
Number of recruits per spawner for different Bristol Bay sockeye salmon stocks. Values >10 were truncated; the maximum was 27.4 for the Ugashik River in 1978.
Two features are important in Fig. 4, the absolute number of recruits per spawner and the temporal trends. The Kvichak and Wood systems have produced the fewest recruits per spawner, generally 2–4, whereas the Naknek averages ≈4, and the Egegik, Ugashik and Igushik show considerable variability but average more than Kvichak and Wood. Egegik showed the largest increase after the 1977 regime shift. This rise in survival was largely responsible for the upsurge in abundance of Egegik sockeye after the shift. The Ugashik system also showed a dramatic increase in survival around the regime shift, whereas the Kvichak, Naknek, and Wood systems showed little response. Indeed, the Kvichak system has shown a dramatic reduction in productivity fewer than one recruit per spawner (i.e., below replacement even without fishing) since the mid-1990s. It is important to emphasize that none of these lake systems have been affected by habitat degradation from logging, mining, agriculture, hydroelectric development, or urbanization prevalent elsewhere, nor have they been colonized by non-native species. Thus we are able to attribute the changes in productivity to natural ecological processes rather than any direct anthropogenic ones.
These changes in productivity are not a response to changes in escapement and consequent compensatory mortality (32). The dramatic increase in Egegik productivity from brood years 1976–1988 coincided with a slight increase in average escapement, rather than a decrease, which would be required to generate higher recruits per spawner due to compensation. Similarly, the decline in Kvichak/Naknek productivity in the 1990s did not correspond to a significant change in average escapement, nor did the increase in Nushagak system productivity (particularly the Wood River) correspond to any significant change in escapement levels. In all cases the trends in escapement were subtle and in the opposite direction required for compensation to have been responsible for the observed dynamics.
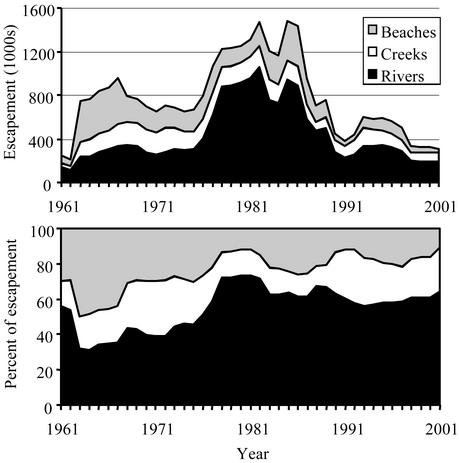
Within the Kvichak/Iliamna system we have aerial surveys of ≈100 different spawning locations. We have classified these locations into three types: ponds and creeks, large rivers, and lake beaches. Fig. 5 shows the historical trend in the aerial counts of these sites, emphasizing strong contributions from river-spawning fish in the late 1970s and 1980s, overlaid on a sustained decline in the proportion of fish spawning on beaches. The life history patterns of beach spawners are quite different from pond/creek and river spawners, and changes in lake level, ice cover, and temperature associated with regime shifts may affect salmon using these habitat types differently. This suggests that shifts we have seen between Naknek/Kvichak, Egegik, and Nushagak may well be taking place on a much finer scale within individual systems.
Fig. 5.
The absolute (Upper) and relative (Lower) contributions of sockeye salmon using three types of spawning habitats within the Iliamna Lake system since 1961. Data have been smoothed with a 5-year running mean to emphasize the long-term trends.
The biocomplexity of Bristol Bay sockeye involves coarse-scale geographic structure organized at the scale of lake and river systems, fine-scale geographic structure associated with distinct spawning streams, beaches, and ponds, and several dimensions of life history variation within this geographic structure. The maintenance of the salmon runs appears to be caused by all of these levels of biocomplexity, with the strongest evidence being for the coarse-scale geographic structure responding differently over time. The evidence that the local adaptations have been the cause of differential response to environmental change is circumstantial, but it is unarguable that the biocomplexity in all its dimensions has buffered the stock from environmental changes. The fixed escapement management policy, which closes harvesting when stocks are low, undoubtedly protects stocks during periods of poor productivity and is the single most important management tool available to protect biocomplexity. Within major river and lake systems we generally do not have sufficient data to determine whether the fine-scale structure of biocomplexity has been maintained during the last century of commercial exploitation, and such monitoring should be made a high priority.
Conclusions
The stability and sustainability of Bristol Bay sockeye salmon have been greatly influenced by different populations performing well at different times during the last century. Indeed, no one associated with the fishery in the 1950s and 1960s could have imagined that Egegik would produce over 20 million fish in 1 year, nor could they imagine that the Nushagak would produce more than the Kvichak, as it has in the last 4 years. It appears that the resilience of Bristol Bay sockeye is due in large part to the maintenance of all of the diverse life history strategies and geographic locations that comprise the stock. At different times, different geographic regions and different life history strategies have been the major producers. If managers in earlier times had decided to focus management on the most productive runs at the time and had neglected the less productive runs, the biocomplexity that later proved important could have been lost. Such loss of biocomplexity is a characteristic of the salmon situation in the Pacific Northwest, where many stock components were lost because of dams or deliberate overharvesting in an attempt to maximize catch from hatcheries (33). Similarly, in British Columbia there has been a focus on commercially important populations such as Fraser River sockeye salmon and neglect of the numerous smaller populations (34). In the 1950s, managers could have chosen to overlook the Egegik or Nushagak systems, and at the time the cost would have appeared to be low.
We have emphasized the importance of biocomplexity on the larger geographic scale, but similar patterns exist on ever-smaller scales within each lake system over the range of habitats and life history strategies described earlier. Within lakes, tributaries show asynchronous shifts in density and productivity, and even within tributaries we have seen habitat units affected by selective predation by bears, blockage by beaver dams, and other local processes. Our ability to measure changes in contribution at this level of biocomplexity is limited by our ability to assign the fishery catch to fine scale locations. Advances in genetic stock identification may pave the way for a high resolution analysis of the role of biocomplexity in maintenance of sustainability.
This work has lessons beyond the conservation of Pacific salmon. There is growing recognition that many marine fish stocks consist of amalgamations of several geographic components (35, 36). It would seem prudent to try to prevent loss of such stock components, including those that appear, at present, to be unproductive. This might necessitate a much finer scale of management than that which is the current norm. We believe that long-term sustainability is derived in large part from complementary patterns of productivity in different stock components. Defining the entire stock as healthy simply because a large component is doing well might lead to decline and extinction if the conditions that fostered the success of the healthy component disappear and the alternate strategy, which would have done well in the new environmental conditions, has been lost.
Acknowledgments
This research was made possible by the long-term data sets for Bristol Bay maintained by the Alaska Department of Fish and Game and the Alaska Salmon Program at the University of Washington. We also thank the numerous students, faculty, and staff who contributed to these data over the past half century. We thank Jennifer Anson and Lucy Flynn for help in writing and assembling the manuscript, and T. Francis, A. Litt, J. Moore, W. Palen, M. Scheuerell, J. Anson, and J. Shepherd for helpful reviews. Funding for this work was provided by the National Science Foundation (Environmental Biology, Biological Oceanography, and Field Stations and Marine Laboratories), the Bristol Bay salmon processors, and the University of Washington.
This paper was submitted directly (Track II) to the PNAS office.
Abbreviations: ENSO, El Niño Southern Oscillation; PDO, Pacific Decadal Oscillation.
References
- 1.Taylor, E. B. (1991) Aquaculture 98, 185–207. [Google Scholar]
- 2.Dittman, A. H. & Quinn, T. P. (1996) J. Exp. Biol. 199, 83–91. [DOI] [PubMed] [Google Scholar]
- 3.Wood, C. C. (1995) in Evolution and the Aquatic Ecosystem: Defining Unique Units in Population Conservation, ed. Neilsen, J. L. (Am. Fisheries Soc., Bethesda), pp. 195–216.
- 4.Demory, R. L., Orrell, R. F. & Heinle, D. R. (1964) Spawning Ground Catalog of the Kvichak River System, Bristol Bay, Alaska (U. S. Fish and Wildlife Service, Washington, DC), Special Science Report, Fisheries No. 488.
- 5.Marriott, R. A. (1964) Stream Catalog of the Wood River Lake System, Bristol Bay, Alaska (U. S. Fish and Wildlife Service, Washington, DC), Special Science Report, Fisheries No. 494.
- 6.Leonetti, F. E. (1997) N. Am. J. Fish. Manage. 17, 194–201. [Google Scholar]
- 7.Burgner, R. L. (1991) in Pacific Salmon Life Histories, eds. Groot, C. & Margolis, L. (Univ. of British Columbia Press, Vancouver), pp. 1–118.
- 8.Olsen, J. C. (1968) in Further Studies of Alaska Sockeye Salmon, ed. Burgner, R. L. (Univ. of Washington, Seattle), pp. 169–197.
- 9.Winemiller, K. O. & Rose, K. A. (1993) Am. Nat. 142, 585–603. [DOI] [PubMed] [Google Scholar]
- 10.West, C. J. & Larkin, P. A. (1987) Can. J. Fish. Aquat. Sci. 44, 712–721. [Google Scholar]
- 11.Abbott, J. C., Dunbrack, R. L. & Orr, C. D. (1985) Anim. Behav. 92, 241–253. [Google Scholar]
- 12.Quinn, T. P., Hendry, A. P. & Wetzel, L. A. (1995) Oikos 74, 425–438. [Google Scholar]
- 13.Foote, C. J. & Brown, G. S. (1998) Can. J. Fish. Aquat. Sci. 55, 1524–1533. [Google Scholar]
- 14.Quinn, T. P. & Foote, C. J. (1994) Anim. Behav. 48, 751–761. [Google Scholar]
- 15.Steen, R. P. & Quinn, T. P. (1999) Can. J. Zool. 77, 836–841. [Google Scholar]
- 16.Quinn, T. P. & Kinnison, M. T. (1999) Oecologia 121, 273–282. [DOI] [PubMed] [Google Scholar]
- 17.Ruggerone, G. T., Hanson, R. & Rogers, D. E. (2000) Can. J. Zool. 78, 974–981. [Google Scholar]
- 18.Quinn, T. P. & Buck, G. B. (2001) Trans. Am. Fish. Soc. 130, 995–1005. [Google Scholar]
- 19.Quinn, T. P., Wetzel, L., Bishop, S., Overberg, K. & Rogers, D. E. (2001) Can. J. Zool. 79, 1782–1793. [Google Scholar]
- 20.Rogers, D. E. (1987) Can. Spec. Pub. Fish. Aquat. Sci. 96, 78–89. [Google Scholar]
- 21.Crawford, D. L. (2000) Bristol Bay Sockeye Salmon Smolt Studies for 1999 (Alaska Department of Fish and Game, Anchorage, AK).
- 22.Scheuerell, M. D. & Schindler, D. E. (2003) Ecology, in press.
- 23.Hare, S. R. & Mantua, N. J. (2000) Prog. Oceanogr. 47, 103–145. [Google Scholar]
- 24.Minobe, S. (1999) Geophys. Res. Lett. 26, 855–858. [Google Scholar]
- 25.Mantua, N. J., Hare, S. R., Zhang, Y., Wallace, J. M. & Francis, R. C. (1997) Bull. Am. Meteorol. Soc. 78, 1069–1079. [Google Scholar]
- 26.Hare, S. R., Mantua, N. J. & Francis, R. C. (1999) Fisheries 24, 6–14. [Google Scholar]
- 27.Beamish, R. J., Noakes, D., McFarlane, G. A., Klyashtorin, L., Ivanov, V. V. & Kurashov, V. (1999) Can. J. Fish. Aquat. Sci. 56, 516–526. [Google Scholar]
- 28.Polovina, J. J., Mitchum, G. T., Graham, N. E., Craig, M. P., DeMartini, E. E. & Flint, E. N. (1994) Fish. Oceanogr. 3, 15–21. [Google Scholar]
- 29.Brodeur, R. D., Mills, C. E., Overland, J. E. & Schumacher, J. D. (1999) Fish. Oceanogr. 8, 296–306. [Google Scholar]
- 30.McGowan, J. A., Cayan, D. R. & Dorman, L. M. (1998) Science 281, 210–217. [DOI] [PubMed] [Google Scholar]
- 31.Running, S. W., Way, J. B., McDonald, K. C., Kimball, J. S., Frolking, S., Keyser, A. R. & Zimmerman, R. (1999) Trans. Am. Geophys. Union 80, 213–221. [Google Scholar]
- 32.Hilborn, R. & Walters, C. J. (1992) Quantitative Fisheries Stock Assesment: Choice, Dynamics & Uncertainy (Chapman & Hall, New York).
- 33.Council, N. R. (1996) Upstream: Salmon and Society in the Pacific Northwest (Natl. Acad. Press, Washington, DC).
- 34.Hyatt, K. D. & Riddell, B. E. (2000) in Sustainable Fisheries Management: Pacific Salmon, eds. Knutson, E. E., Steward, C. R., MacDonald, D., Williams, J. E. & Reiser, D. W. (CRC Press, Boca Raton, FL), pp. 51–62.
- 35.Ruzzante, D. E., Taggart, C. T., Lang, S. & Cook, D. (2000) Ecol. Appl. 10, 1090–1109. [Google Scholar]
- 36.Lage, C., Purcell, M., Fogarty, M. & Kornfield, I. (2001) Can. J. Fish. Aquat. Sci. 58, 982–990. [Google Scholar]
- 37.Minard, R. E. & Meacham, C. P. (1987) Spec. Pub. Fish. Aquat. Sci. 96, 336. [Google Scholar]


