Abstract
Using DNA microarray and clustering of expressed genes we have analyzed the mechanism of inhibition of wild-type p53-induced apoptosis by the cytokine interleukin 6 (IL-6) and the calcium mobilizer thapsigargin (TG). Clustering analysis of 1,786 genes, the expression level of which changed after activation of wild-type p53 in the absence or presence of IL-6 or TG, showed that these compounds did not cause a general inhibition of the ability of p53 to up-regulate or down-regulate gene expression. Expression of various p53 targets implicated as mediators of p53-induced apoptosis was also not affected by IL-6 or TG. These compounds thus can bypass the effect of wild-type p53 on gene expression and inhibit apoptosis. IL-6 and TG activated different p53-independent pathways of gene expression that include up-regulation of antiapoptotic genes. IL-6 and TG also activated different differentiation-associated genes. The ability of compounds such as cytokines and calcium mobilizers to inhibit p53-mediated apoptosis without generally inhibiting gene expression regulated by p53 can facilitate tumor development and tumor resistance to radiation and chemotherapy in cells that retain wild-type p53.
The tumor suppressor wild-type p53 induces apoptosis (refs. 1 and 2 and reviewed in refs. 3 and 4). Although p53 also controls other important cellular functions such as the cell cycle and DNA integrity (5), experiments with lymphoma have indicated that apoptosis seems to be the major p53 function selected against in tumor development (6). The study of p53-regulated apoptosis, therefore, is important for cancer research and to devise strategies for cancer therapy. We have shown previously that apoptosis induction by p53 in M1-t-p53 myeloid leukemic cells, the cells used for experiments that first showed the induction of apoptosis by wild-type p53 (1), can be inhibited by various compounds including cytokines such as interleukin (IL)-6 (1, 3, 4) and calcium-mobilizing compounds such as the Ca2+-ATPase inhibitor thapsigargin (TG) (3, 4, 7). Inhibition of p53-induced apoptosis by TG but not IL-6 depended on calcium and calcineurin, showing that inhibition of apoptosis by IL-6 and TG are initiated by different signals (4, 7, 8). The inhibitors of p53-induced apoptosis include dicoumarol, an inhibitor of NAD(P)H oxidoreductase 1 (9), and the hsp90 inhibitors geldanamycin and radicicol (10). Dicoumarol and hsp90 inhibitors induce proteasomal degradation of the p53 protein (9–11), which can explain their antiapoptotic activity. However, neither IL-6 nor TG caused degradation of the p53 protein (9). Wild-type p53 can act as a transcriptional activator or repressor of many genes (12, 13) including genes that regulate apoptosis (4, 14, 15). Using DNA-microarray and clustering analysis of gene expression, we have now shown that inhibition of p53-induced apoptosis by IL-6 and TG is not mediated by a general inhibition of the transcription-regulation activity of p53, and that IL-6 and TG inhibit apoptosis by activating different p53-independent pathways of gene expression including up-regulation of antiapoptotic genes.
Materials and Methods
Cell Culture, Apoptosis, and Cell-Viability Assay. We used M1-t-p53 myeloid leukemic cells that express a temperature-sensitive p53 protein that changes from a mutant to wild-type conformation after transfer from 37 to 32°C (16) and induces apoptosis at 32°C but not at 37°C (1). M1-t-p53 cells were grown at 37°C in DMEM supplemented with 10% heat-inactivated (56°C, 30 min) horse serum and cultured in an incubator with 10% CO2. Apoptosis was induced by transferring the cells to 32°C in the absence or presence of 50 ng/ml recombinant human IL-6 (from Steve Clark, Genetics Institute, Cambridge, MA) or 10 ng/ml TG (Sigma). The assays for apoptosis and cell viability were carried out as described (1, 17).
Hybridization of Microarrays and Clustering Analysis. Total RNA was extracted at 0.25, 2, 6, 9, and 12 h after culture of cells at 32°C in the absence (referred to as p53) or presence of IL-6 (referred to as p53+IL-6) or TG (referred to as p53+TG) by using the EZ-RNA extraction kit (Biological Industries, Beit Haemek, Israel) according to manufacturer instructions. RNA from each time point was used to synthesize biotin-labeled cRNA as described (18) and hybridized to a separate murine genome U74A array that contains probes for ≈12,000 genes (Affymetrix, Santa Clara, CA) according to manufacturer instructions. Gene-expression values <20 were adjusted to 20 to eliminate noise from the data, and then all values were log2-transformed. Expression-level ratios for each gene at each time point were determined separately for each treatment group (p53, p53+IL-6, and p53+TG) relative to expression at 0.25 h. Two procedures were used to filter the genes with expression levels that changed during the experiment. One procedure selected genes with expression ratios >2 (or <0.5) at two or more time points in at least one treatment group. The other procedure was that before every clustering operation we selected those genes for which the standard deviation of their log2-transformed expression values, as measured over all the experiments that were clustered, exceeded 0.5. Before each clustering operation the log2-transformed expression values of each gene at all time points and different treatments were first centered and normalized such that the mean of its component is set to 0, and their sum of squares is set to 1 (19). The super paramagnetic clustering (SPC) algorithm (20) was used for performing cluster analysis.
Real-Time Quantitative RT-PCR. cDNA was synthesized from total RNA from different time points by using murine Moloney leukemia virus reverse transcriptase (Promega) with random hexamers incubated for 2 h at 37°C followed by 10 min at 65°C. Specific primers for real-time quantitative PCR of mouse BCL-3 (GenBank accession no. AF067774) and β2-microglobulin (β2M, GenBank accession no. NM_009735) as an internal control gene were BCL-3 forward (position 1210, 5′-TCCTCGCCAAGCTCCTCA), BCL-3 reverse (position 1310, 5′-GCAGGTGTAGATGTTGTGGGAAG), β2M forward (position 332, 5′-GAGACTGATACATACGCCTGCAGA), and β2M reverse (position 412, 5′-TCACATGTCTCGATCCCAGTAGA). Real-time quantitative PCRs were performed on the ABI-Prism 7900HT platform in a total volume of 20 μl containing 500 nM of each set of forward and reverse primers according to manufacturer instructions.
Immunoblot Analysis. Cell extracts were prepared and the proteins were electrophoresed and electroblotted as described (9). The blots were incubated with goat anti-mouse osteopontin (Spp1) antibody (1:200) followed by horseradish peroxidase-conjugated rabbit anti-goat IgG antibody (1:2,000) (both from Santa Cruz Biotechnology). Signals were developed by using the ECL kit (Amersham Pharmacia) and visualized by exposure to x-ray film (Fuji).
Results
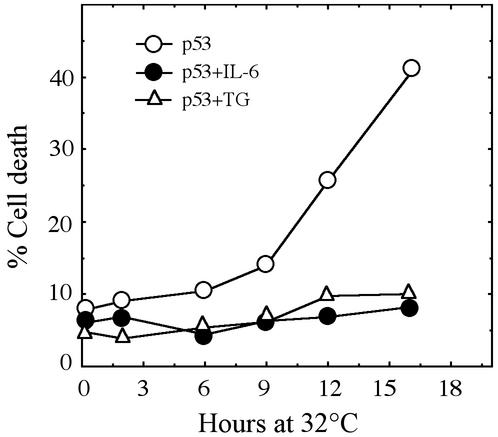
Clustering Analysis Shows Similar p53-Induced Gene Expression With and Without IL-6. Transfer of M1-t-p53 cells from 37 to 32°C induces apoptotic cell death that was detected first 8–9 h after transfer to 32°C, and there were 42% dead cells at 16 h (Fig. 1). This induction of cell death was prevented by IL-6 and by TG (Fig. 1). We compared gene expression in cells cultured at 32°C without IL-6 (p53) to cells cultured at 32°C with IL-6 (p53+IL-6). Using a statistical filtering criterion of genes that show a standard deviation >0.5 of their log2-transformed expression values in the 10 experimental points (five time points for p53 plus five time points for p53+IL-6), we obtained 1,513 genes. The list of these genes included 77% of the 1,170 genes obtained by another criterion that selects genes that were either up-regulated or down-regulated >2-fold in at least two time points compared with expression at 0.25 h in p53 or p53+IL-6. The remaining 23% (273 genes) that also showed >2-fold up-regulation or down-regulation in at least two time points but were not found in the list obtained by the selection criterion used for the above-described 1,513 genes, were added. The SPC clustering was applied to all 1,786 genes that passed either of these selection criteria (see Tables 3 and 4, which are published as supporting information on the PNAS web site, www.pnas.org).
Fig. 1.
Inhibition of p53-induced apoptosis by IL-6 and TG. M1-t-p53 cells were cultured at 32°C for the indicated time points without or with 50 ng/ml IL-6 or 10 nM TG, and the percentage of cell viability was determined.
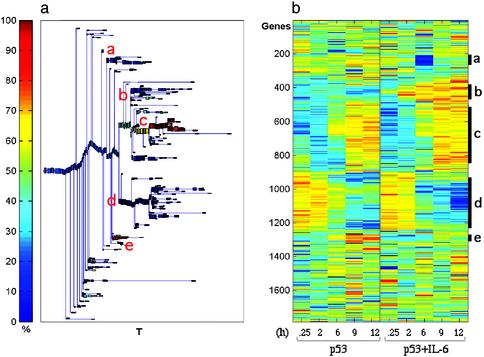
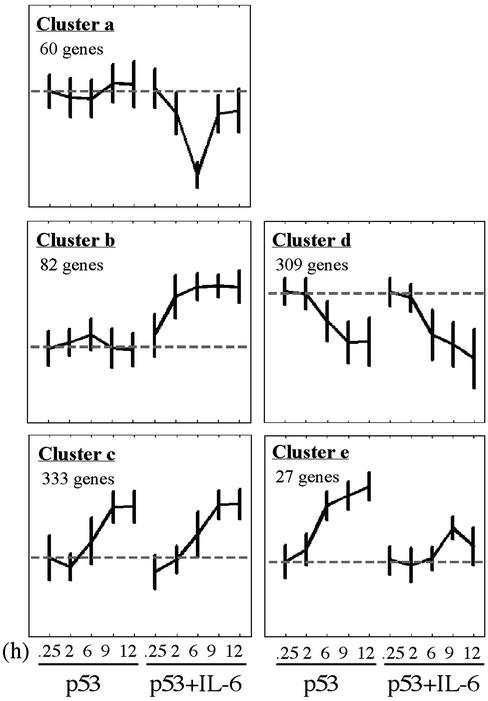
The results of this analysis are summarized in the dendrogram of Fig. 2a. When the rows of the expression data matrix are arranged according to the order imposed by the clustering process, the color-coded matrix of Fig. 2b was obtained. Stable, significant clusters were identified (21), and the expression profiles of the different genes included in each such cluster were analyzed. Clustering analysis helps identify large groups of genes that exhibit similar, i.e., correlated, expression profiles. Members of such a group have a higher probability of belonging to the same biologically relevant process than those genes with expression profiles that show more “individualistic” variation and do not belong to large clusters. Genes that do not belong to large clusters may have passed our filters because of noise. The largest cluster (c) contained 333 genes that showed a similar up-regulated expression profile in both p53 and p53+IL-6 (Fig. 3). The same was observed for the second largest cluster (d) of 309 genes, which exhibit similar down-regulated expression profiles under the two conditions. Two other clusters contained 82 genes with an up-regulated expression profile (cluster b) and 60 genes with a down-regulated expression profile (cluster a) in the p53+IL-6 but not in p53 by itself. These genes thus can be regarded as “IL-6-specific.” In only one rather small cluster, containing 27 genes, IL-6 inhibited the up-regulated expression that was induced by p53 alone (cluster e). The antiapoptotic cytokine IL-6 thus did not affect the expression pattern of 93% of p53-up-regulated genes or any of the p53-down-regulated genes within the identified clusters. Similar results were obtained when the SPC clustering analysis was applied only to 696 genes that were up-regulated >2-fold in at least two time points (data not shown). These results indicate that IL-6 can inhibit p53-induced apoptosis by regulating gene expression by a pathway independent of the gene expression regulated by p53.
Fig. 2.
Clustering analysis using the SPC algorithm of up-regulated and down-regulated genes by p53 in the absence or presence of IL-6. M1-t-p53 cells were cultured at 32°C for the indicated time points, and expression data were subjected to SPC clustering. (a) Dendrogram of the 1,786 genes that include clusters of at least five genes. T is a parameter of the SPC algorithm that controls the resolution at which the clusters are found. The clusters that did not split even when T is high are considered stable clusters. (b) Expression matrix of the genes reordered according to the dendrogram. The colors represent induction (red) or repression (blue). The letters inside a and the marked bars on the right of b indicate the identified stable clusters.
Fig. 3.
Average expression profiles of genes in stable clusters a–e of Fig. 2. The expression profile of each gene was normalized as described in Materials and Methods.
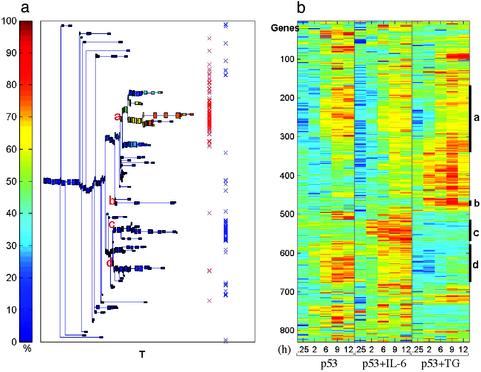
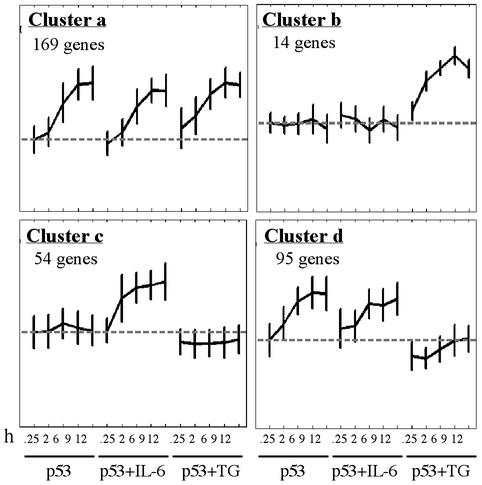
IL-6 and TG Inhibit p53-Induced Apoptosis by Different Pathways of Gene Expression. To determine whether TG-mediated inhibition of p53-induced apoptosis affects p53-regulated genes and to compare the pattern of gene expression to that of IL-6-treated cells, we clustered together 829 genes that were up-regulated >2-fold in at least two time points by p53, p53+IL-6, or p53+TG (see Tables 3 and 4). The results presented in Figs. 4 and 5 indicate that the largest cluster of 169 genes (cluster a) shows a similar profile of gene up-regulation by p53, p53+IL-6, and p53+TG (Fig. 5). This cluster contains most of the genes that show a >2-fold up-regulation in at least two time points by all three treatment groups (Fig. 4a, marked by red X) including many known p53-target genes, some of which are shown in Table 1. This cluster of p53-up-regulated genes that are not affected by IL-6 or TG also contains several proapoptotic genes that were implicated in the ability of p53 to induce apoptosis including Ccng, Wig1/Pag608, Epha2, Tnfrsf6/Fas, Aapaf1, Ei24/Pig8, and Bax (Table 1). Cluster b contains 14 “TG-specific” genes, and cluster c contains 54 “IL-6-specific” genes, and the latter contains most of the genes with a high ratio of expression in p53+IL-6 compared with p53 alone (Fig. 4a, marked by blue X). The fourth cluster (cluster d) contains 95 p53-up-regulated genes that were unaffected by IL-6 but were prevented by TG from being up-regulated by p53 (Figs. 4 and 5). Of the 264 p53-up-regulated genes included in clusters a and d, none were affected by IL-6, whereas 95 genes (36%) were affected by TG. The finding that TG but not IL-6 affected expression of approximately a third of up-regulated p53-target genes and the existence of separate IL-6-specific and TG-specific clusters indicate that suppression of apoptosis by IL-6 and TG is mediated by different pathways of gene expression.
Fig. 4.
Clustering analysis of up-regulated genes by p53 in the absence or presence of IL-6 or TG. (a) Dendrogram of genes including clusters of at least five genes. Each box is colored according to the percentage of genes (of the cluster represented by the box) up-regulated by p53. Red X markings indicate genes that have a high ratio of expression in all three treatments (p53, p53+IL-6, and p53+TG), and blue X markings indicate IL-6-specific genes. (b) Expression matrix of the genes reordered according to the dendrogram. The colors represent induction (red) or repression (blue). The letters inside a and the marked bars on the right of b indicate the identified stable clusters.
Fig. 5.
Average expression profiles of up-regulated genes in stable clusters a–d of Fig. 4. The expression profile of each gene was normalized as described in Materials and Methods.
Table 1. Some p53 target genes unaffected by IL-6 and TG.
| Fold induction*
|
||||
|---|---|---|---|---|
| Symbol | GenBank accession nos. | p53 | p53+IL-6 | p53+TG |
| Cdkn1a | AW048937 | 31.1 | 37.8 | 22.9 |
| Ak1 | AJ010108 | 35.6 | 22.2 | 45.3 |
| Traf4 | AV109962 | 22.3 | 20.8 | 8.9 |
| Gtse1 | AJ222580 | 11.5 | 13.1 | 5.3 |
| Mcam | AI853261 | 9.6 | 6.9 | 3.1 |
| Mdm2 | AI853375 | 7.4 | 19.5 | 6.6 |
| Ercc5 | U40796 | 7.0 | 5.4 | 11.1 |
| Rb1 | AV338260 | 5.6 | 4.9 | 3.3 |
| Ccng† | L49507 | 10.7 | 10.0 | 21.6 |
| Wig1† | AF012923 | 18.1 | 13.8 | 12.9 |
| Epha2† | U07634 | 11.4 | 6.4 | 7.8 |
| Tnfrsf6† | M83649 | 4.8 | 4.9 | 8.9 |
| Apaf1† | AF064071 | 4.5 | 4.4 | 3.0 |
| Ei24† | AW060710 | 5.4 | 5.3 | 3.7 |
| Bax† | L22472 | 2.9 | 3.0 | 5.8 |
Numbers indicate the highest ratio of expression value at 2-12 h compared with 0.25 h in each treatment group in Fig. 4 cluster a.
Proapoptotic genes.
We have also analyzed the clustering of the 650 genes that were down-regulated >2-fold in at least two time points by p53, p53+IL-6, or p53+TG. The analysis showed five major clusters with a total of 398 genes. Of the 325 genes that were down-regulated by p53 and fall into stable clusters, IL-6 affected the expression of only 27 genes (9%), and TG affected the expression of 93 genes (29%) (data not shown). The results indicate that as for the up-regulated genes, most of the p53-down-regulated genes were also not affected by IL-6 or TG and that TG affected more p53-down-regulated genes than IL-6. Calcium mobilization by TG activates calcineurin and calmodulin-dependent protein kinases and changes the phosphorylation of various proteins including transcription factors (22, 23). These calcium-induced changes may account for the higher number of p53-regulated genes affected by TG.
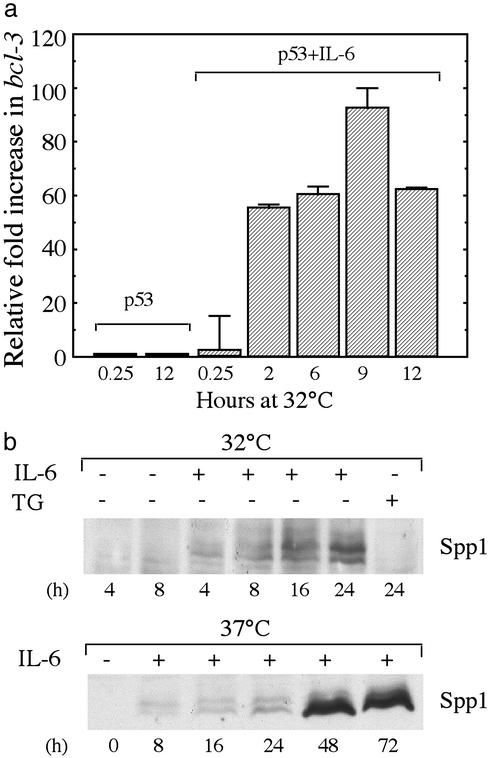
Regulation of Antiapoptotic Gene Expression by IL-6 and TG. The above-described results indicate that inhibition of p53-induced apoptosis by IL-6 and TG is not mediated by a general inhibition of the ability of p53 to act as a transcriptional activator or repressor. IL-6 and TG also did not affect expression of several known apoptosis-inducing genes implicated in p53-induced apoptosis (Table 1). Our microarray analysis also showed that the up-regulated IL-6-specific genes (Figs. 2 and 3, cluster b, and Figs. 4 and 5, cluster c) include two highly induced genes with known antiapoptotic functions, the IkB family member and transcription activator Bcl3 (24, 25), and the Spp1 gene, which encodes osteopontin (26). Using RT-PCR analysis and Western blotting we verified that IL-6 induces expression of these genes (Fig. 6). Spp1 was also induced in M1-t-p53 cells by IL-6 at 37°C when p53 is in a mutant form (Fig. 6), indicating that Spp1 expression induced by IL-6 does not depend on wild-type p53. Spp1 was not induced by TG (Fig. 6b). Another IL-6-specific inducible gene that was found in the same cluster is Stat3 (Table 2), which encodes the transcription factor that mediates the antiapoptotic activity of IL-6 (27, 28). IL-6 thus seems not only to activate STAT3 by phosphorylation after binding to IL-6 receptor (27) but can also up-regulate expression of the Stat3 gene, possibly through autoregulation by activated STAT3 (28). Two other antiapoptotic genes found in the TG-specific cluster b (Figs. 4 and 5), Serpini1, which encodes the serine and cysteine protease inhibitor neuroserpin (29), and Evi2, involved in viral leukemogenesis (30), were up-regulated by TG (Table 2). The ability to up-regulate antiapoptotic genes thus can explain the ability of these compounds to inhibit p53-induced apoptosis. Regarding proapoptotic genes, TG prevented up-regulation of the p53-induced proapoptotic genes Gadd45 and Dffb included in cluster d (Fig. 4 and Table 2) but did not prevent up-regulation of a larger number of p53-induced proapoptotic genes in cluster a (Fig. 4 and Table 1). IL-6 did not prevent up-regulation of any of these p53-induced proapoptotic genes (Fig. 4 and Tables 1 and 2).
Fig. 6.
Verification of IL-6-induced expression of Bcl3 and Spp1. (a) Real-time quantitative PCR result of expression of Bcl3 by p53 or p53+IL-6. (b) Western blot analysis of Spp1 (osteopontin) in M1-t-p53 cells cultured at 32°C(Upper) or 37°C (Lower) without (-) or with (+) IL-6 or TG.
Table 2. Regulation of some antiapoptotic, proapoptotic, and differentiation-associated gene expression by IL-6 and TG.
| Fold induction*
|
||||
|---|---|---|---|---|
| Symbol | GenBank accession nos. | p53 | p53+IL-6 | p53+TG |
| Antiapoptotic genes | ||||
| Bcl3 | M90397 | 2.3 | 38.1† | -1.1 |
| Spp1 | X13986 | 1.0 | 9.7† | 1.9 |
| Stat3 | U08378 | -1.2 | 2.6† | -1.2 |
| Serpini1 | AJ001700 | -1.3 | 3.1 | 7.8‡ |
| Evi2 | M34896 | 1.5 | -2.5 | 4.1‡ |
| Proapoptotic genes | ||||
| Gadd45 | U00937 | 7.9 | 4.2 | 1.5§ |
| Dffb | AB009377 | 3.0 | 2.1 | 1.1§ |
| Differentiation genes | ||||
| Csf2rb2 | M29855 | 1.7 | 12.7† | 1.0 |
| Fcgr1 | X70980 | 1.0 | 10.3† | 5.2§ |
| Cish | D89613 | 1.3 | 9.7† | 1.4 |
| Myd88 | X51397 | 1.9 | 4.8† | 1.5 |
| Cdkn2d | U19597 | 1.3 | 3.5† | 1.4 |
| Cebpb | M61007 | 1.7 | 2.4† | 1.2 |
| JunB | U20735 | 1.2 | 2.7† | 1.0 |
| Cmkbr5 | AV370035 | 1.0 | 30.4† | 1.0 |
| Cmkbr1 | U29678 | 1.6 | 4.4† | 1.0 |
| Sema4a | X85991 | 1.4 | 6.5† | -3.8 |
| Scya3 | J04491 | 1.4 | 1.8 | 5.4‡ |
| Il1r1 | M20658 | -1.3 | 1.0 | 4.6‡ |
| Itga4 | X53176 | 1.4 | -2.5 | 3.6‡ |
| Pdcd1 | X67914 | 1.1 | 1.7 | 6.4‡ |
IL-6 and TG Induced Changes in Gene Expression Associated with Differentiation. In addition to inhibiting apoptosis, IL-6 also induces differentiation of M1 myeloid leukemic cells to mature cells (4, 31, 32). M1-t-p53 cells that were derived from M1 cells (1) can also be induced to differentiate to mature cells by IL-6. Analysis of genes included in the IL-6-specific cluster c (Figs. 4 and 5) identified many genes previously shown to be associated with differentiation of these cells. These genes include Fcgr1, which encodes the Fc receptor, Csf2rb2, which encodes the β chain of the IL-3 receptor, Myd88, which encodes a Toll receptor adaptor, Cish, which encodes a Jak-Stat inhibitor, Cdkn2d, which encodes the cdk6 and cdk9 inhibitor p19INK4d, and the transcription factors JunB and Cebpb/NFIL-6. In addition, we identified in this cluster several other strongly up-regulated genes including Cmkbr5 and Cmkbr1, which encode the chemokine receptors CCR5 and CCR1, respectively, and are probably involved in cell migration and chemotaxis, and Sema4a, which encodes semaphorin B, probably involved in cell adhesion (Table 2). Except for Fcgr1, none of these IL-6-inducible differentiation-associated genes was induced by TG (Table 2). However, TG but not IL-6 induced expression of genes (cluster b) including Scya3, which encodes the chemokine CCL3, Il1r1, which encodes IL-1 receptor type 1, and Itga4, which encodes integrin 4α that may also have differentiation-associated functions in chemotaxis and cell adhesion (Table 2). Pdcd1, a CD28-family receptor expressed in activated lymphocytes and myeloid cells (33), was also induced by TG but not IL-6 (Table 2). These results show that our microarray analysis also identified previously unknown differentiation-associated genes in IL-6- and TG-treated M1-t-p53 myeloid leukemic cells and again show that IL-6 and TG activate different pathways of gene expression.
Discussion
The ability of p53 to suppress tumor development depends to a large extent on its ability to induce apoptosis. Selection for apoptosis resistance during tumor development in >50% of human tumors is achieved by p53 mutations (5). The apoptosis-inducing activity of p53 can also be inhibited by inducing degradation of the p53 protein by cellular or viral proteins such as mdm-2 (34), HPV E6 (35), and adenovirus E1B55 and E4orf6 (36) or by compounds such as the NAD(P)H oxidoreductase 1 inhibitor dicoumarol and hsp90 inhibitors (9–11). p53-dependent apoptosis can be inhibited also by directly blocking p53 transcriptional activity by proteins such as iASPP (37). We have shown previously that the cytokine IL-6 and the calcium mobilizer TG effectively inhibit p53-induced apoptosis (3, 4) without inducing degradation of the p53 protein (9). In this study we used DNA-microarray and clustering analysis of gene expression to determine whether IL-6 and TG inhibit p53-mediated apoptosis by generally affecting the transcription-regulation activity of p53. Our analysis of 1,786 genes with expression levels that changed, up or down, after activation of wild-type p53 in M1-t-p53 cells in the absence or presence of IL-6 or TG shows that these compounds generally did not inhibit the ability of p53 to regulate gene expression. The data also show that IL-6 and TG did not affect p53-induced up-regulation of various proapoptotic genes implicated in the ability of p53 to induce apoptosis. These results are supported by our previous finding based on Northern blot analysis that neither IL-6 nor TG affected up-regulation of the p53 targets mdm2, Waf1, and Fas (7). Inhibition of p53-induced apoptosis in the same cells by the oncogene E2A-HLF also did not affect expression of Waf1, Fas, Pig8, and Bax (38).
The ability of IL-6 and TG to inhibit p53-induced apoptosis in M1-t-p53 myeloid leukemic cells, therefore, is not mediated by generally preventing expression of p53 target genes. Our results show an up-regulation of certain antiapoptotic genes by IL-6 and TG in a p53-independent manner. This up-regulation of antiapoptotic genes changes the intracellular balance between expression of proapoptotic and antiapoptotic genes and can explain the ability of these compounds to inhibit p53-mediated apoptosis. The conclusion on the regulation of genes by IL-6 and TG in a p53-independent manner is supported by our finding that adding IL-6 or TG even after 8 h at 32°C, when most of the p53-induced changes in gene expression have occurred already, inhibited apoptosis to the same extent as when these compounds were added at the onset of p53 activation (7, 39). This conclusion is also supported by the ability of IL-6 and TG to inhibit apoptosis induced by compounds such as adriamycin and vincristine in M1 cells that do not express p53 (7, 40).
Apoptosis inhibition by TG but not IL-6 is initiated by the calcium-activated phosphatase calcineurin (3, 7, 8). Our finding that IL-6 and TG regulated expression of different sets of genes indicates that not only are the initiation signals used by IL-6 and TG different, but they also activate different pathways of gene expression. Cytokines such as IL-6 and calcium mobilizers such as TG thus can bypass the effect of wild-type p53 on gene expression and inhibit apoptosis, thereby facilitating tumor development and tumor resistance to radiation and chemotherapy in cells that retain wild-type p53. Anti-cytokine therapy for cytokines that inhibit apoptosis can increase the susceptibility of cancer cells to cytotoxic agents (3, 4, 31, 40). There also should be inhibitors that can improve cancer therapy by inhibiting the antiapoptotic function of other compounds.
Supplementary Material
Acknowledgments
We thank the Arison Dorsman family donation to the Center of DNA Chips, Pediatric Oncology, Chaim Sheba Medical Center. This work was supported in part by the Yad Abraham Research Center for Cancer Diagnosis and Therapy, the Benoziyo Institute of Molecular Medicine, the Dolfi and Lola Ebner Center for Biomedical Research, Mrs. Bernice Gershenson, the Otolaringology Research Foundation, the Israel Academy of Sciences and Humanities, Minerva, the Ridgefield Foundation, the Germany–Israel Science Foundation, and National Institutes of Health Grant 5P01CA65930-06.
Abbreviations: TG, thapsigargin; SPC, super paramagnetic clustering.
References
- 1.Yonish-Rouach, E., Resnitzky, D., Lotem, J., Sachs, L., Kimchi, A. & Oren, M. (1991) Nature 352, 345-347. [DOI] [PubMed] [Google Scholar]
- 2.Lotem, J. & Sachs, L. (1993) Blood 82, 1092-1096. [PubMed] [Google Scholar]
- 3.Lotem, J. & Sachs, L. (1999) Apoptosis 4, 187-196. [DOI] [PubMed] [Google Scholar]
- 4.Lotem, J. & Sachs, L. (2002) Oncogene 21, 3284-3294. [DOI] [PubMed] [Google Scholar]
- 5.Vogelstein, B., Lane, D. & Levine, A. J. (2000) Nature 408, 307-310. [DOI] [PubMed] [Google Scholar]
- 6.Schmitt, C. A., Fridman, J. S., Yang, M., Baranov, E., Hoffman, R. M. & Lowe, S. W. (2002) Cancer Cell 1, 289-298. [DOI] [PubMed] [Google Scholar]
- 7.Lotem, J. & Sachs, L. (1998) Proc. Natl. Acad. Sci. USA 95, 4601-4606. [DOI] [PMC free article] [PubMed] [Google Scholar]
- 8.Lotem, J., Kama, R. & Sachs, L. (1999) Proc. Natl. Acad. Sci. USA 96, 12016-12020. [DOI] [PMC free article] [PubMed] [Google Scholar]
- 9.Asher, G., Lotem, J., Cohen, B., Sachs, L. & Shaul, Y. (2001) Proc. Natl. Acad. Sci. USA 98, 1188-1193. [DOI] [PMC free article] [PubMed] [Google Scholar]
- 10.Asher, G., Lotem, J., Kama, R., Sachs, L. & Shaul, Y. (2002) Proc. Natl. Acad. Sci. USA 99, 3099-3104. [DOI] [PMC free article] [PubMed] [Google Scholar]
- 11.Asher, G., Lotem, J., Sachs, L., Kahana, C. & Shaul, Y. (2002) Proc. Natl. Acad. Sci. USA 99, 13125-13130. [DOI] [PMC free article] [PubMed] [Google Scholar]
- 12.Ko, L. J. & Prives, C. (1996) Genes Dev. 10, 1054-1072. [DOI] [PubMed] [Google Scholar]
- 13.Oren, M. (1992) FASEB J. 6, 3169-3176. [DOI] [PubMed] [Google Scholar]
- 14.Benchimol, S. (2001) Cell Death Differ. 8, 1049-1051. [DOI] [PubMed] [Google Scholar]
- 15.Burns, T. F. & El-deiry, W. S. (1999) J. Cell. Physiol. 181, 231-239. [DOI] [PubMed] [Google Scholar]
- 16.Michalovitz, D., Halevy, O. & Oren, M. (1990) Cell 62, 671-680. [DOI] [PubMed] [Google Scholar]
- 17.Lotem, J., Peled-Kamar, M., Groner, Y. & Sachs, L. (1996) Proc. Natl. Acad. Sci. USA 93, 9166-9171. [DOI] [PMC free article] [PubMed] [Google Scholar]
- 18.Kannan, K., Amariglio, N., Rechavi, G., Jakob-Hirsch, J., Kela, I., Kaminski, N., Getz, G., Domany, E. & Givol, D. (2001) Oncogene 20, 2225-2234. [DOI] [PubMed] [Google Scholar]
- 19.Fontemaggi, G., Kela, I., Amariglio, N., Rechavi, G., Krishnamurthy, J., Strano, S., Sacchi, A., Givol, D. & Blandino, G. (2002) J. Biol. Chem. 277, 43359-43368. [DOI] [PubMed] [Google Scholar]
- 20.Blatt, M., Wiseman, S. & Domany, E. (1996) Phys. Rev. Lett. 76, 3251-3254. [DOI] [PubMed] [Google Scholar]
- 21.Getz, G., Levine, E. & Domany, E. (2000) Proc. Natl. Acad. Sci. USA 97, 12079-12084. [DOI] [PMC free article] [PubMed] [Google Scholar]
- 22.Crabtree, G. R. (2001) J. Biol. Chem. 276, 2313-2316. [DOI] [PubMed] [Google Scholar]
- 23.Stull, J. T. (2001) J. Biol. Chem. 276, 2311-2312. [DOI] [PubMed] [Google Scholar]
- 24.Mitchell, T. C., Hildeman, D., Kedl, R. M., Teague, T. K., Schaefer, B. C., White, J., Zhu, Y., Kappler, J. & Marrack, P. (2001) Nat. Immunol. 2, 397-402. [DOI] [PubMed] [Google Scholar]
- 25.Rebollo, A., Dumoutier, L., Renauld, J. C., Zaballos, A., Ayllon, V. & Martinez, A. C. (2000) Mol. Cell. Biol. 20, 3407-3416. [DOI] [PMC free article] [PubMed] [Google Scholar]
- 26.Denhardt, D. T., Giachelli, C. M. & Rittling, S. R. (2001) Annu. Rev. Pharmacol. Toxicol. 41, 723-749. [DOI] [PubMed] [Google Scholar]
- 27.Kishimoto, T., Taga, T. & Akira, S. (1994) Cell 76, 253-262. [DOI] [PubMed] [Google Scholar]
- 28.Narimatsu, M., Maeda, H., Itoh, S., Atsumi, T., Ohtani, T., Nishida, K., Itoh, M., Kamimura, D., Park, S. J., Mizuno, K., et al. (2001) Mol. Cell. Biol. 21, 6615-6625. [DOI] [PMC free article] [PubMed] [Google Scholar]
- 29.Yepes, M., Sandkvist, M., Wong, M. K., Coleman, T. A., Smith, E., Cohan, S. L. & Lawrence, D. A. (2000) Blood 96, 569-576. [PubMed] [Google Scholar]
- 30.Buchberg, A. M., Bedigian, H. G., Jenkins, N. A. & Copeland, N. G. (1990) Mol. Cell. Biol. 10, 4658-4666. [DOI] [PMC free article] [PubMed] [Google Scholar]
- 31.Sachs, L. (1996) Proc. Natl. Acad. Sci. USA 93, 4742-4749. [DOI] [PMC free article] [PubMed] [Google Scholar]
- 32.Lotem, J. & Sachs, L. (2002) Semin. Cancer Biol. 12, 339-346. [DOI] [PubMed] [Google Scholar]
- 33.Agata, Y., Kawasaki, A., Nishimura, H., Ishida, Y., Tsubata, T., Yagita, H. & Honjo, T. (1996) Int. Immunol. 8, 765-772. [DOI] [PubMed] [Google Scholar]
- 34.Juven-Gershon, T. & Oren, M. (1999) Mol. Med. 5, 71-83. [PMC free article] [PubMed] [Google Scholar]
- 35.Teodoro, J. G. & Branton, P. E. (1997) J. Virol. 71, 1739-1746. [DOI] [PMC free article] [PubMed] [Google Scholar]
- 36.Querido, E., Blanchette, P., Yan, Q., Kamura, T., Morrison, M., Boivin, D., Kaelin, W. G., Conaway, R. C., Conaway, J. W. & Branton, P. E. (2001) Genes Dev. 15, 3104-3117. [DOI] [PMC free article] [PubMed] [Google Scholar]
- 37.Bergamaschi, D., Samuels, Y., O'Neil, N. J., Trigiante, G., Crook, T., Hsieh, J. K., O'Connor, D. J., Zhong, S., Campargue, I., Tomlinson, M. L., et al. (2003) Nat. Genet. 33, 162-167. [DOI] [PubMed] [Google Scholar]
- 38.Altura, R. A., Inukai, T., Ashmun, R. A., Zambetti, G. P., Roussel, M. F. & Look, A. T. (1998) Blood 92, 1397-1405. [PubMed] [Google Scholar]
- 39.Lotem, J. & Sachs, L. (1996) Proc. Natl. Acad. Sci. USA 93, 12507-12512. [DOI] [PMC free article] [PubMed] [Google Scholar]
- 40.Lotem, J. & Sachs, L. (1992) Blood 80, 1750-1757. [PubMed] [Google Scholar]
Associated Data
This section collects any data citations, data availability statements, or supplementary materials included in this article.


