

Abstract
The γ-aminobutyrate (GABA) shunt is a metabolic pathway that bypasses two steps of the tricarboxylic acid cycle, and it is present in both prokaryotes and eukaryotes. In plants the pathway is composed of the calcium/calmodulin-regulated cytosolic enzyme glutamate decarboxylase and the mitochondrial enzymes GABA transaminase and succinic-semialdehyde dehydrogenase (SSADH). The activity of the GABA shunt in plants is rapidly enhanced in response to various biotic and abiotic stresses. However the physiological role of this pathway remains obscure. To elucidate its role in plants, we analyzed Arabidopsis T-DNA knockout mutants of SSADH, the ultimate enzyme of the pathway. Four alleles of the ssadh mutation were isolated, and these exhibited a similar phenotype. When exposed to white light (100 μmol of photons per m2 per s), they appear dwarfed with necrotic lesions. Detailed spectrum analysis revealed that UV-B has the most adverse effect on the mutant phenotype, whereas photosynthetic active range light has a very little effect. The ssadh mutants are also sensitive to heat, as they develop necrosis when submitted to such stress. Moreover, both UV and heat cause a rapid increase in the levels of hydrogen peroxide in the ssadh mutants, which is associated with enhanced cell death. Surprisingly, our study also shows that trichomes are hypersensitive to stresses in ssadh mutants. Our work establishes a role for the GABA shunt in preventing the accumulation of reactive oxygen intermediates and cell death, which appears to be essential for plant defense against environmental stress.
The γ-aminobutyrate (GABA) shunt is predominantly associated with neurotransmission in the mammalian brain (1) and with some genetic disorders (2, 3). However, it is also present in nonneuronal cells (4), in plants (5, 6), in unicellular eukaryotes (7), and in prokaryotes (8). The activity of the GABA shunt in plants is drastically enhanced in response to biotic and abiotic stresses (5, 6). GABA synthesis from glutamate is controlled by glutamate decarboxylase (GAD), a Ca2+/calmodulin-regulated enzyme in plants (9–12). GABA is catabolized in mitochondria through the GABA shunt, a metabolic pathway that bypasses two successive steps of the tricarboxylic acid (TCA) cycle catalyzed by α-ketoglutarate dehydrogenase and succinyl-CoA synthetase (Fig. 1). The enzymes involved in GABA catabolism are GABA transaminase, which converts GABA to succinic semialdehyde, and succinic-semialdehyde dehydrogenase (SSADH), which oxidizes succinic semialdehyde to succinate coupled with NADH production. Hence GABA is a metabolite en route from glutamate to the TCA cycle, which provides succinate and NADH to the respiratory machinery. Two regulatory check points of the GABA shunt have been described in plants (Fig. 1): positive regulation of GAD by Ca2+/calmodulin in the cytosol and negative regulation of SSADH by ATP and NADH in the mitochondrion (13, 14). The former is considered to be a mechanism involved in the activation of the enzyme in response to stress, whereas the latter is thought to control the GABA shunt by mitochondrial energy charge and reducing potential.
Fig. 1.

Schematic presentation of the GABA shunt metabolic pathway. The GABA shunt is composed of three enzymes (depicted in boldface type): glutamate decarboxylase (GAD; EC 4.1.1.15), GABA transaminase (GABA-T; EC 2.6.1.19), and succinic-semialdehyde dehydrogenase (SSADH; EC 1.2.1.16). TCA cycle, tricarboxylic acid cycle; SSA, succinic semialdehyde; SCS, succinyl-CoA synthetase; α-KGDH, α-ketoglutarate dehydrogenase; dashed lines, effectors; solid lines, substrates and products.
We previously cloned the Arabidopsis SSADH cDNA (GenBank accession no. AF117335) and showed that it encodes an enzyme targeted to the mitochondrion (13). Making use of the complete Arabidopsis genome sequence (15), we identified a unique SSADH gene (At1g79440) corresponding to the AtSSADH cDNA. Because in Arabidopsis thaliana SSADH is encoded by a single gene, we decided to study loss-of-function mutants of this gene to elucidate the role of the GABA shunt in plants. Here we show that compromising the function of the GABA shunt causes enhanced accumulation of reactive oxygen intermediates (ROIs) and cell death in response to light and heat stresses.
Materials and Methods
Isolation of T-DNA Insertion Mutants and Genotype Characterization. The ssadh-1 mutant was isolated from the Institut National de la Recherche Agronomique (Versailles, France) collection of Arabidopsis T-DNA-inserted mutants (ecotype Wassilewskija) as described (16). DNA pools were screened by PCR using genespecific primers (f3 and r3 as described below) and primers anchored in the T-DNA borders (16). Insertion in the SSADH gene was confirmed by sequencing PCR products spanning the insertion. The knockout line (line CSV5) was isolated and homozygous plants were selected. The Arabidopsis (ecotype Columbia) ssadh-2 knockout (line SALK_03223) was isolated from the Salk Institute Genomic Analysis Laboratory T-DNA insertion lines (http://signal.salk.edu). The ssadh-3 (line 1278_B12) and ssadh-4 (line 205_C07) are Arabidopsis (ecotype Columbia) knockouts from the Syngenta T-DNA-inserted collection of mutants (www.tmri.org). Genotypes of the different knockouts were analyzed by PCR using primers specific for the SSADH ORF: for ssadh-3, f1 (CTTTGTTCGATTGAAGTTTGGG) and r1 (CATGATGTCAACATAAAGCATTCC); for ssadh-2, f2 (GTCTCTGGTCACATCTAGATGGATTTCC) and r2 (GTACCAGGGGGTATTCAATCTAGATTC); for ssadh-1, f3 (GTTATACCCTTGATGATTGAGG) and r3 (AATGCGAGGAACACTATGT); for ssadh-4, f4 (GCTCCATTCGGGGGAGTGA AG) and r4 (GCCA AGAGCCCAGAATC); and primers specific for the T-DNAs: for the Salk T-DNA, LB3 (TAGCATCTGAATTTCATAACCAATCTCGATACAC); for the Syngenta T-DNA, LBa1 (ATGGTTCACGTAGTGGGCCATC); and for the Institut National de la Recherche Agronomique T-DNA, TAG (TCCTTCTCATCTAAGCGTAG).
Analysis of the SSADH mRNA Expression by RT-PCR. Total RNA was isolated from 3-week-old seedlings and RNA extraction was performed with the RNeasy plant kit (Qiagen, Valencia, CA) as indicated by the supplier. Reverse transcriptase was used to prepare the corresponding cDNA templates from the total RNA extracts. PCR amplification of a 439-bp SSADH cDNA specific sequence was performed with a forward (AATCACGTTCACGGGATCAA) and a reverse (CGCGGATAACAGTAGGCT) primer amplifying a region spanning nucleotides 868-1307 of the SSADH cDNA (GenBank accession no. AF117335) (13). PCR amplification of the cDNA encoding the elongation factor 1-α of Arabidopsis (GenBank accession no. AY039583) with a forward primer (GCACTGTCATTGATGCTCC) and a reverse primer (GTCAAGAGCCTCAAGGAGAG) served as control.
Plant Culture. Surface-sterilized seeds were plated on Gamborg B5 medium pH 6.4 (Sigma) containing 1–2% sucrose and 0.8% agar (plant cell culture tested, Sigma), incubated at 4°C for 48 hr, and grown in vitro under the following conditions: for long days, a day/night cycle of 16/8 hr was applied and for short days, 9/15 hr; light intensity was ≈100–150 μmol of photons per m2 per s if not specified otherwise, temperature day/night was 20/15°C. Seedlings were transferred from plates to soil and grown in controlled-environment MC1750 chambers with 58-W Brite Gro 2084 and 2023 lighting, from Snijders Scientific (Tilburg, Holland), or in Binder/Brinkmann growth chambers (model KBWF720, Tuttlinger, Germany) equipped with Fluora growth daylight-fluorescent lamps (Osram, product description: L 18W/860 PLUS ECO 25 × 1, lighting color 11), or GE Polylux XL F58W/835 fluorescent tubes. Temperatures and light/dark cycles were the same as for in vitro cultures with relative humidity kept at 65%.
Light Spectrum Analysis. WT and ssadh mutant seedlings were germinated and grown under low-fluence white light (WL; 280–700 nm) for 4 weeks (short days) as described above followed by exposure to different irradiation conditions. Seedlings were irradiated for 7 days with Farnell 5-mm/T1¾ untainted clear-lens light-emitting diode rigs supplying either monochromatic blue light (458 nm, 11 μmol·m-2·s-1) or monochromatic red light (660 nm, 70 μmol·m-2·s-1). For UV irradiation, seedlings were exposed to low-fluence (30 μmol·m-2·s-1) or high-fluence (70 μmol·m-2·s-1) photosynthetically active radiation (PAR; 400–700 nm, including UV-Amax 0.45 μmol·m-2·s-1 and UV-Bmax 0.012 μmol·m-2·s-1) alone as a control, and supplemented with low- or high-fluence UV-A (320–400 nm; 4.5 μmol·m-2·s-1 or 11.7 μmol·m-2·s-1) or with low- or high-fluence UV-B (280–320 nm; 0.65 μmol·m-2·s-1 or 3.6 μmol·m-2·s-1) irradiation. UV-A and UV-B were supplied by Philips TL20W/09N and TL20W/01RS fluorescent tubes, respectively. All fluences were measured with a StellarNet EPP2000 fiber optic spectrometer (Tampa, FL).
Detection of ROI and Cell Death. Trypan blue (TB) stain was used to visualize dying cells as described (17). H2O2 was detected in situ by using 3,3′-diaminobenzidine (DAB) as described (18). Quantification of the DAB staining was performed as follow. For each time-point, all leaves (four to seven) from three plants were pictured and the DAB-stained area was determined with software (PHOTOSHOP, Adobe Systems, Mountain View, CA) using a grid. The percentage of staining was calculated per leaf and then averaged by the number of leaves per plant. H2O2 extraction was performed as described (19, 20). Concentrations of H2O2 were determined by using a spectrophotometric assay (21, 22) as described by Willekens et al. (20). After addition of the horseradish peroxidase to the sample, the increase of OD at 412 nm was monitored. The rate of change was extrapolated from the linear phase of increase in OD (mostly within the first minute). The content of H2O2 was calculated on the basis of a calibration curve, which, for concentrations ranging from 2 to 180 nmol·g-1 of fresh weight, was shown to be linear.
Results and Discussion
Isolation and Molecular Characterization of ssadh Mutants. A collection of Arabidopsis T-DNA insertion mutants (23) was screened by PCR using oligonucleotides anchored in the AtSSADH gene. One knockout mutant containing a T-DNA element inserted in the gene was isolated and designated ssadh-1. Segregation analysis of the T-DNA-encoded kanamycin-resistance marker established the presence of only one T-DNA locus in the genome of this mutant. By comparing the AtSSADH genomic sequence with T-DNA-flanking genomic sequences deposited in the databases we identified three additional ssadh alleles designated ssadh-2 to ssadh-4. The genomic DNAs of the four independent ssadh mutants were characterized by PCR (Materials and Methods), confirming that the insertions of the T-DNA element in each mutant occurred within the SSADH gene (Fig. 2A). The presence of the SSADH mRNA was assessed by reverse transcription and PCR amplification using primers specific of the SSADH cDNA and flanking the T-DNA integration site. The full-length SSADH mRNA could not be detected in total RNA extracted from ssadh-1 plants, in contrast to the WT (Fig. 2B, RT-PCR forward and reverse primers). This result indicates that ssadh-1 is a null allele because of the disrupted SSADH gene in the mutant. Amplification of an elongation factor mRNA worked equally well on ssadh-1 and WT RNA templates (Fig. 2B, control primers).
Fig. 2.

Genotypes and phenotypes of ssadh mutants. (A) Schematic presentation of the structure of the SSADH ORF (At1g79440). The 20 exons are represented by gray boxes (drawn to scale). The T-DNA location for each of the four ssadh knockouts is indicated, namely, ssadh-1 (Versailles collection, line CSV5), ssadh-2 (Salk collection, line 03223), ssadh-3 (Syngenta collection, line 1278_B12), and ssadh-4 (Syngenta collection, line 205_C07). (B) Expression analysis of SSADH mRNA in the ssadh-1 mutant and WT by RT-PCR. Total RNAs from the ssadh-1 mutant and WT were isolated from 3-week-old seedlings and used as templates for reverse transcription (RT). A 439-bp DNA fragment corresponding to a region of the SSADH mRNA was amplified with primers flanking the T-DNA integration site. Amplification of the corresponding region from the SSADH cDNA clone (SSADH cDNA cloned in pZL1 vector; GenBank accession no. AF117335) served as a positive control. -RT designates negative control experiments in which reverse transcriptase was omitted before the final PCR amplification step. Control primers were used to amplify a region of the Arabidopsis mRNA (after RT) encoding elongation factor 1-α (GenBank accession no. AY039583). MW, molecular weight markers, with lengths in bp. (C) Phenotype of the ssadh-1 mutant. After 3 weeks of in vitro growth, seedlings were transferred to soil and grown for a total of 3 months under high-fluence WL at 100μmol·m-2·s-1 before being photographed. (D) Phenotype of the four ssadh alleles. Seeds of the mutants and WT (Arabidopsis ecotype Wassilewskija) were grown in vitro for 3 weeks. Seedlings were transferred to soil and grown for an additional 4 weeks under high-fluence WL at 100 μmol·m-2·s-1 before being photographed.
The four ssadh homozygous mutant lines and WT were germinated and grown at 100 μmol·m-2·s-1 WL (280–700 nm), 21°C, 16-hr day length. All four mutants were phenotypically dwarfed with necrotic lesions, bleached leaves, reduced leaf area, lower chlorophyll content, shorter hypocotyls, and fewer flowers (Table 1; Fig. 2 C and D). As we show further on in this study, different alleles respond similarly to environmental stresses. Interestingly, ssadh-3 is a weaker allele, as inflorescences were 25–30% higher than those of ssadh-1. In ssadh-3, the T-DNA is inserted just downstream of the first exon (Fig. 2 A), which encodes the transit peptide targeting the protein to mitochondria (13). One possible explanation for the weaker phenotype of ssadh-3 is that a functional SSADH protein is expressed, but not targeted to the mitochondria, or that some functional protein reaches the mitochondria in the absence of the target peptide. Genetic complementation of the ssadh-1 mutation was performed with a CaMV35S-SSADH cDNA transgene (GenBank accession no. AF117335). Two transgenic lines tested exhibited partially complemented phenotypes (data not shown). Thus, on the basis of the phenotype of the four independent ssadh knockout alleles and of the complementation lines, we concluded that the observed phenotype is caused by disruption of the SSADH gene.
Table 1. Comparison of WT and ssadh-1 morphologies.
| Parameter | ssadh-1 | WT |
|---|---|---|
| Leaf area, mm2 | 2.7 ± 1.1 | 67.6 ± 24.0 |
| Inflorescence height, mm | 7.7 ± 3.4 | 192.6 ± 34.8 |
| No. of inflorescences per plant | 0.8 ± 0.4 | 1.9 ± 0.8 |
| Chlorophyll, mg·mg-1 FW | 0.05 ± 0.01 | 0.15 ± 0.06 |
Plants were grown for 7 weeks at 90 μmol·m-2·s-1 and parameters were recorded. Leaf area was measured for at least four individual plants on the four most expanded leaves in each rosette. For inflorescence measurements, at least 15 individual plants were analyzed. Chlorophyll from leaves of three different plants was extracted as described (48). FW, fresh weight.
ssadh Mutants Are Hypersensitive to Environmental Stress. To investigate the role of the GABA shunt in greater detail, WT and mutant plants were exposed to different environmental conditions. When WT and the ssadh-1 mutant were germinated and kept in the dark for 10 days, both lines were similarly etiolated, with the same hypocotyl length (data not shown). This observation suggested that light might be the factor responsible for the phenotype of the ssadh mutants in standard growth conditions. To further test this possibility, ssadh-1 and WT plants were grown under low-fluence WL (10 μmol·m-2·s-1), 10% of the standard light conditions used, which still allows greening and normal plant development. No statistically significant differences in leaf number were found between WT and mutant. The morphology of the mutant was very similar to that of the WT, with apparent normal leaf development after 6 weeks in low-fluence WL (Fig. 3A, WL-low). In contrast, ssadh-1 plants transferred after 4 weeks of low-fluence WL to high-fluence WL (90 μmol·m-2·s-1) for 2 additional weeks developed severe necrotic lesions in all plants (Fig. 3A, WL-low + WL-high). Necrosis was confirmed by treating leaves with TB (17), which selectively stains dead cells (Fig. 3A, TB). Even under low-fluence WL ssadh-1 leaves were stained with TB (Fig. 3A, WL-low and TB). However, in this case staining was mild, and the cells that consistently stained were identified as the trichomes and the epidermal cells at the base of the trichomes (as further shown in Fig. 6). Under the same light conditions, WT plants did not develop any necrosis (Fig. 3A, WL-low and TB). These results confirmed that the ssadh-1 mutant is sensitive to WL, which causes necrosis.
Fig. 3.

Hypersensitivity of the ssadh-1 mutant to light and heat stress. (A) Necrosis formation on leaves of ssadh-1 plants exposed to heat and light. WT and ssadh-1 plants were grown under low-fluence WL at 10 μmol·m-2·s-1 for 6 weeks (WL-low) or for 4 weeks under low-fluence WL followed by 2 weeks under high-fluence WL at 90 μmol·m-2·s-1 (WL-low + WL-high). For heat stress treatment, plants were grown for 2 weeks under low-fluence WL (10 μmol·m-2·s-1) at 21°C and 65% relative humidity and for 2 more weeks were heated at 37°C daily for 5 hr in the dark (WL-low + HS). Between 5 and 25 plants (6- to 10-leaf-rosette stage) of each line were measured in each treatment. TB, leaves stained with trypan blue. Red arrows show necrotic lesions. (B) Spectrum analysis of ssadh-1 sensitivity to light. WT and ssadh-1 plants were grown under low-fluence WL at 10 μmol·m-2·s-1 for 4 weeks followed by exposure to photosynthetically active radiation (PAR; 400–700 nm) alone at 30 μmol·m-2·s-1 (PAR-low) or 70 μmol·m-2·s-1 (PAR-high). Wherever indicated, PAR was supplemented with UV-A irradiation at 4.5 μmol·m-2·s-1 (UVA-low) or 11.7 μmol·m-2·s-1 (UVA-high) or UV-B irradiation at 0.65 μmol·m-2·s-1 (UVB-low) or 3.6 μmol·m-2·s-1 (UVB-high). Seedlings were visualized after 24 hr, 48 hr, and 7 days of irradiation.
Fig. 6.

Cell death and H2O2 accumulation in ssadh-1 trichomes. Plants were grown at 10 μmol·m-2·s-1 WL for 4 weeks and then subjected to low-fluence PAR at 30 μmol·m-2·s-1 (PAR-low) or transferred to high-fluence PAR at 70 μmol·m-2·s-1 supplemented by UV-B at 3.6 μmol·m-2·s-1 (PAR-high UVB-high). After 2, 24, or 48 hr, plants were treated with TB or DAB, as indicated. Numbers indicate the percentage of representative trichomes shown in pictures. Values represent a mean of 20 trichomes per time point.
Plants monitor both the quality and quantity of light (24). Because our WL sources contain a broad light spectrum (280–700 nm) we dissected the phenomenon of light-dependent necrosis in ssadh-1 by exposing seedlings to individual wavelengths. Seedlings were germinated and grown under low-fluence WL for 4 weeks followed by exposure to different light conditions for 7 days. Initially seedlings were exposed to low- and high-fluence WL, high-fluence blue light (11 μmol·m-2·s-1), and high-fluence red light (70 μmol·m-2·s-1). Importantly, no necrosis was observed in response to high-fluence red or blue light irradiation (data not shown), suggesting that neither phytochrome nor cryptochrome photoreceptors play a dominant role in ssadh-1 sensitivity to light. Subsequently, we tested the effect of UV irradiation because our initial high-fluence WL sources contained 3.9 μmol·m-2·s-1 of UV-A and 0.17 μmol·m-2·s-1 of UV-B. Seedlings were grown under low-fluence WL (10 μmol·m-2·s-1) for 4 weeks followed by exposure to photosynthetically active radiation (PAR; 400–700 nm) alone, or supplemented with either UV-A or UV-B irradiation. Both UV-A and UV-B irradiation had dramatic effects on ssadh-1 seedlings, causing rapid necrosis (Fig. 3B). The most dramatic effect was observed upon high-fluence UV-B irradiation (3.6 μmol·m-2·s-1), where mutant seedlings developed necrotic lesions within 24 hr, followed by extensive necrosis after 48 hr (Fig. 3B, PAR-high UVB-high). In sharp contrast, WT seedlings developed no necrotic lesions under these conditions (Fig. 3B, PAR-high UVB-high). Mutant seedlings also developed necrotic lesions under low-fluence UV-B irradiation (0.65 μmol·m-2·s-1) but, as expected, this effect was less severe than that of high-fluence UV-B, showing the effect only after 48 hr of irradiation (Fig. 3B, PAR-low UVB-low). High-fluence UV-A irradiation (11.7 μmol·m-2·s-1) showed a similar effect to low-fluence UV-B irradiation with necrosis developing after 48 hr of treatment (Fig. 3B, PAR-high UVA-high). Low UV-A irradiation (4.5 μmol·m-2·s-1) had little effect on mutant seedling development, showing weak necrosis after 7 days of irradiation (Fig. 3B, PAR-low UVA-low). Mutant seedlings treated with PAR alone developed few necrotic lesions under high fluence (70 μmol·m-2·s-1) after 7 days of exposure (Fig. 3B, PAR-high). Other ssadh mutants (ssadh-2 and ssadh-4) were also sensitive to UV irradiation as seen by the appearance of necrotic lesions within 24 hr of high-fluence UV-B irradiation (see Movie 1, which is published as supporting information on the PNAS web site, www.pnas.org). These data suggest that light-controlled signaling pathways are not altered in ssadh mutants and that the necrosis observed is due to increased sensitivity to stresses like UV.
In plants, the activity of the GABA shunt and GABA production are drastically enhanced in response to various biotic and abiotic environmental stresses (5, 6). To investigate whether ssadh mutants are sensitive to environmental stresses other than light, we examined the response of ssadh-1 to heat stress. Plants grown under low-fluence WL for 2 weeks were transferred to 37°C for 5 hr, daily, during 2 weeks. The ssadh-1 plants subjected to such a stress developed severe necrotic lesions as confirmed by heavy staining of mutant leaves with TB (Fig. 3A, WL-low + HS). In response to heat stress, ≈50% of the true leaves of all mutant plants exhibited extensive cell death, with TB staining at least 30% of their leaf area. Untreated mutant plants exhibited only minor lesions in cotyledons and in older leaves (first pair), and mostly seen as isolated spots of stained cells covering <30% of the leaf area. Importantly, little necrosis was observed in the WT under control or heat-stress conditions. Taken together, our results indicate that ssadh plants are more sensitive than WT to at least two types of environmental stresses: light (UV-B being the most effective) and heat. When ssadh plants are exposed to these treatments, their development is drastically retarded (Fig. 2 C and D) and associated with the appearance of necrotic lesions.
H2O2 Accumulation Is Enhanced in ssadh Mutants Exposed to Stress. There is ample evidence that oxidative stress can cause cell death in plants and animals. For instance, programmed cell death (PCD), like the hypersensitive response, is associated with an oxidative burst (25). Moreover, abiotic stresses such as UV or heat also enhance the production of ROIs in organelles such as chloroplasts and mitochondria by interfering with electron-transfer chains (26, 27). The role of oxidative stress and in particular H2O2 in mediating plant responses to environmental stresses is not yet clearly understood. To gain further insight into cellular processes that are compromised in ssadh mutants, we investigated possible changes in the levels of ROIs in ssadh-1, focusing on H2O2. After 3 weeks at 60 μmol·m-2·s-1, leaves of the mutant, but not of the WT, were clearly stained with DAB, a substance that detects H2O2 in situ (18) (Fig. 4A). Under these conditions all ssadh-1 plants tested showed DAB staining on most of the leaves within the rosettes. WT and mutant plants were also treated with DAB after exposure to heat (Fig. 4B). After the treatment, 63% of all mutant leaves and 3% of WT leaves were stained with DAB (Fig. 4B). In control conditions only 26% of the mutant leaves, but almost no WT leaves, had this level of staining (Fig. 4B).
Fig. 4.
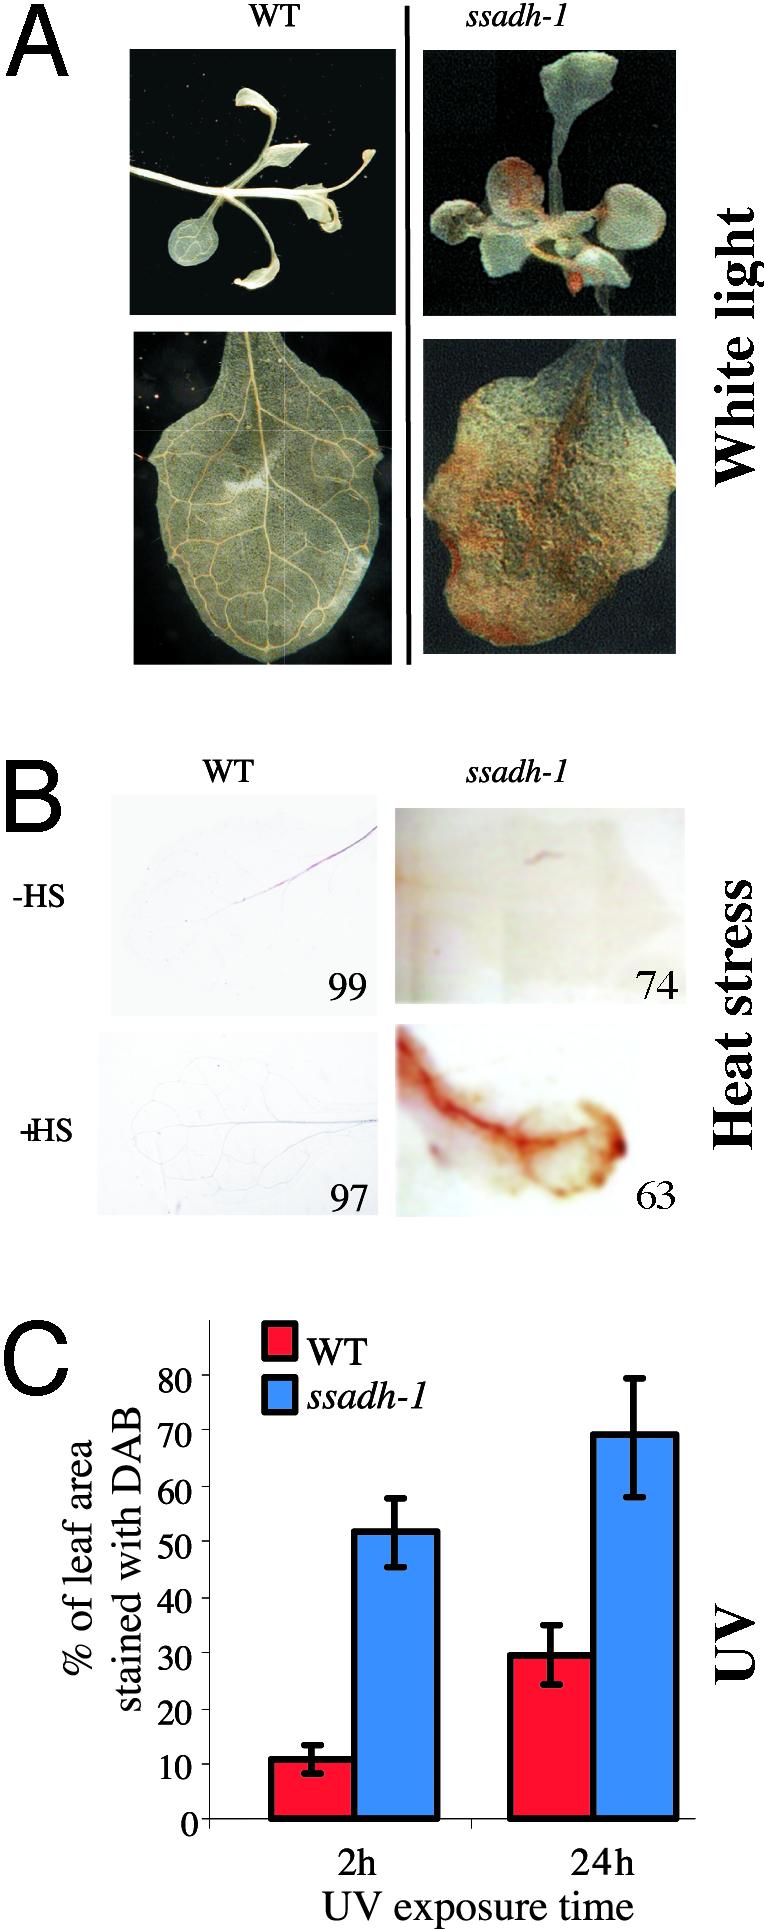
H2O2 accumulation detected in situ by DAB staining. (A) Plants grown at 60 μmol·m-2·s-1 WL for 3 weeks. (B) Plants grown at 10 μmol·m-2·s-1 WL for 2 weeks and subjected to heat treatments (HS), as described in the legend of Fig. 3A. Numbers indicate the percentages of leaves showing DAB staining similar to that presented in the pictures (total number of leaves observed was 72 for WT - HS, 70 for WT + HS, 96 for ssadh-1 - HS, and 102 for ssadh-1 + HS). (C) Quantitative analysis of DAB staining of leaves from ssadh-1 plants exposed to UV-B. Plants were grown under low-fluence WL at 10 μmol·m-2·s-1 for 4 weeks followed by exposure at 70 μmol·m-2·s-1 of PAR supplemented with UV-B irradiation at 3.6 μmol·m-2·s-1 for 2 or 24 hr. Leaves (four to seven) from three plants were pictured, and the DAB-stained area was determined as a percentage of total leaf area. Error bars represent SD.
We also analyzed H2O2 accumulation in seedlings exposed specifically to UV-B irradiation, which has the most adverse effects on the mutant. As early as 2 hr after irradiation, ssadh-1 seedlings accumulated H2O2, showing DAB staining in 50% of all leaf tissue compared with WT seedlings with only 10% of leaf tissue stained (Fig. 4C). The difference between WT and mutant remained after 24 hr of treatment (Fig. 4C). Thus, the results obtained with DAB-stained plants show that ssadh-1 has increased levels of H2O2 in response to light and heat stress.
To confirm the differences in H2O2 accumulation between the WT and ssadh mutants in response to stress, we performed direct measurements of H2O2 concentrations in shoot extracts. Seedlings were exposed to various light conditions and H2O2 was extracted and quantified as described in refs. 19 and 20. Our results revealed H2O2 concentrations between 20 and 70 nmol·g-1 of fresh weight, which is in the range previously reported by others (28). The concentration of H2O2 was lowest in seedlings grown and kept in the dark (Fig. 5, Dark) compared with seedlings grown under various WL conditions (Fig. 5, WL-low and WL-low + WL-high). No differences in H2O2 levels could be detected between the WT and the mutant when seedlings were grown in the dark (Fig. 5, Dark) or under low-fluence WL at 10 μmol·m-2·s-1 for 4 weeks (Fig. 5, WL-low). In contrast, ssadh-1 seedlings grown under low-fluence WL for 2 weeks and transferred to high-fluence WL at 90 μmol·m-2·s-1 for another 2 weeks (Fig. 5, WL-low + WL-high) accumulated more H2O2 than the WT. All in all, our results indicate that H2O2 content increases in ssadh-1 plants exposed to stress, as shown by DAB staining and direct H2O2 quantification. Excess levels of ROIs either could be the direct cause of cell death and/or could interfere with the normal role of ROIs as signaling molecules (29).
Fig. 5.

H2O2 content in the ssadh-1 mutant exposed to various light conditions. H2O2 was quantified in ssadh-1 and WT shoots as described in Materials and Methods. Plants were grown in vitro for 4 weeks in complete darkness (Dark) or under low-fluence WL at 10 μmol·m-2·s-1 for 4 weeks (WL-low) or for 2 weeks under low-fluence WL followed by 2 weeks under high-fluence WL at 90 μmol·m-2·s-1 (WL-low + WL-high). Measurements were performed on bulks of 5–10 individual seedlings. For each light condition, data represent an average of six measurements performed in two independent experiments. Error bars represent SD.
Cell Death and H2O2 Accumulation in Trichomes of ssadh Mutants. To further assess the relationship between H2O2 levels and cell death in ssadh mutants, we monitored trichomes because of their apparent sensitivity to light in the mutant, and their distinct structures. Under low-fluence PAR (Fig. 6, PAR-low), an increased H2O2 level was apparent in ssadh-1 trichomes, and 60% of ssadh-1 trichome epidermal base cells showed strong TB staining indicative of cell death. No DAB or TB staining was apparent in WT trichomes under the same conditions (Fig. 6, PAR-low). Therefore, cell death and high H2O2 levels occur in ssadh-1 trichomes shortly after exposure to low-fluence PAR. We then assessed H2O2 levels in trichomes of plants exposed to UV-B. Interestingly, H2O2 levels in ssadh-1 trichomes decreased upon extended UV-B irradiation with an apparent lack of detectable H2O2 after 48 hr (Fig. 6, PAR-high UVB-high). The decrease in H2O2 in ssadh-1 trichomes coincided with cell death, as seen by TB staining in both the epidermal base cells and trichomes. The number of TB-stained ssadh-1 trichome base cells increased to ≈95% after 48 hr of irradiation (Fig. 6). Therefore, trichomes, like whole plants, cannot cope with a defective GABA shunt and this ultimately leads to trichome cell death when the plants are exposed to environmental stresses. Importantly, we noticed that prolonged high-fluence UV-B irradiation leads to increased H2O2 levels in WT trichomes as well (Fig. 6, PAR-high UVB-high), but, in contrast to the mutant, this increase is not associated with cell death, although occasional trichome cell death was observed (Fig. 6). Trichomes have been suggested to participate in detoxification processes and they contain high levels of glutathione (30), which is involved in defense against oxidative stress (26, 31–34). Our results show that trichomes of WT plants accumulate H2O2 in response to stress. Moreover, our results suggest that in case the control of ROIs levels is impaired, such as in the ssadh mutants, trichomes are particularly sensitive to stress, resulting in their rapid death.
Conclusions
Our studies reveal that a functional GABA shunt is essential for normal plant growth, and at least in part it may be doing so by suppressing the accumulation of H2O2 generated under light and heat stresses. There are two possible mechanisms underlying the role of the GABA shunt in suppressing the accumulation of H2O2. One explanation is the ability of the GABA shunt to supply NADH and/or succinate under conditions that inhibit the tricarboxylic acid (TCA) cycle (Fig. 1), impair respiration, and enhance the accumulation of ROIs. In brain cortex nerve terminals aconitase is the TCA-cycle enzyme most sensitive to H2O2. However, inhibition of α-ketoglutarate dehydrogenase plays a critical role in limiting the amount of NADH during H2O2-induced oxidative stress (35). This inhibition is associated with a decline in the levels of glutamate (35), which could be due to enhanced GABA shunt activity. A role for the GABA shunt in protecting yeast against oxidative stress has also been suggested, on the basis of the fact that knockouts of GABA shunt genes increased sensitivity to exogenous application of H2O2, whereas overexpression of the corresponding genes increased tolerance (7). Moreover, recent studies revealed the relationship between Ca2+ signaling and ROIs in plants (36–39). The GABA shunt, whose activity is Ca2+ regulated (9–12), is activated under stress conditions that cause enhanced ROI production. Another possible link between Ca2+ signaling and GABA in plants may involve members of the glutamate receptor family recently identified in Arabidopsis (40, 41), which share some structural similarities with mammalian metabotropic GABA receptors, and likely mediate Ca2+ entry into plant cells (42, 43). Alternatively, the apparent role of the GABA shunt in supporting normal plant growth and stress tolerance could be associated with a requirement to sustain the levels of other metabolites, either of the GABA shunt per se or derived from the GABA shunt. Hence, potential GABA and/or succinic semialdehyde (SSA) accumulation in ssadh mutants could be lethal for cells by causing ROI accumulation. For instance, mutants altered in the chlorophyll and heme biosynthetic pathway exhibit lesions caused by the accumulation of highly oxidative intermediates such as coproporphyrin (44). Proline and GABA are two structurally similar amino acids, and intermediates of proline metabolism were shown to be toxic for plants (45). In humans, SSADH deficiency causes neurological disorders attributable to the accumulation of γ-hydroxybutyrate (GHB) in the brain (46). GHB is a neuromodulator derived from SSA by a reduction step involving a specific SSA reductase (47). At present, it is unclear whether GHB exists in plants, and sequences similar to mammalian SSA reductase cannot be detected in the Arabidopsis genome (N.B., unpublished results).
In summary, we attribute a role to the GABA shunt in Arabidopsis that is different from that described for vertebrates. However, given the similarities in the metabolism of GABA in plants and vertebrates, the possible involvement of the GABA shunt in a response to oxidative stress in vertebrates is intriguing.
Supplementary Material
Acknowledgments
We thank Graham Noctor for helpful discussions and Prof. G. Galili for continuous support. We also thank the Torrey Mesa Research Institute and the Salk Institute for providing the sequence-indexed Arabidopsis T-DNA insertion mutants, the Arabidopsis Biological Resource Center (Ohio State University, Columbus) for providing the ssadh-2 seeds and EST clones, and Wendy Stoddart for technical assistance. N.B. is a Marie-Curie Postdoctoral Fellow. Part of this research was supported by Research Award 2743-96 from the United States–Israel Binational Agricultural Research and Development Fund.
This paper was submitted directly (Track II) to the PNAS office.
Abbreviations: DAB, 3,3′-diaminobenzidine; GABA, γ-aminobutyrate; PAR, photosynthetically active radiation (400–700 nm); ROIs, reactive oxygen intermediates; SSADH, succinic-semialdehyde dehydrogenase; TB, trypan blue; WL, white light (280–700 nm).
References
- 1.Varju, P., Katarova, Z., Madarasz, E. & Szabo, G. (2001) Cell Tissue Res. 305, 239-246. [DOI] [PubMed] [Google Scholar]
- 2.Medina-Kauwe, L. K., Tobin, A. J., De Meirleir, L., Jaeken, J., Jakobs, C., Nyhan, W. L. & Gibson, K. M. (1999) J. Inherit. Metab. Dis. 22, 414-427. [DOI] [PubMed] [Google Scholar]
- 3.Jakobs, C., Jaeken, J. & Gibson, K. M. (1993) J. Inherit. Metab. Dis. 16, 704-715. [DOI] [PubMed] [Google Scholar]
- 4.Tillakaratne, N. J., Medina-Kauwe, L. & Gibson, K. M. (1995) Comp. Biochem. Physiol. A 112, 247-263. [DOI] [PubMed] [Google Scholar]
- 5.Shelp, B. J., Bown, A. W. & McLean, M. D. (1999) Trends Plant Sci. 4, 446-452. [DOI] [PubMed] [Google Scholar]
- 6.Snedden, W. A. & Fromm, H. (1999) in Plant Responses to Environmental Stresses: From Phytohormones to Genome Reorganization, ed. Lerner, H. R. (Dekker, New York), pp. 549-574.
- 7.Coleman, S. T., Fang, T. K., Rovinsky, S. A., Turano, F. J. & Moye-Rowley, W. S. (2001) J. Biol. Chem. 276, 244-250. [DOI] [PubMed] [Google Scholar]
- 8.Metzer, E. & Halpern, Y. S. (1990) J. Bacteriol. 172, 3250-3256. [DOI] [PMC free article] [PubMed] [Google Scholar]
- 9.Arazi, T., Baum, G., Snedden, W. A., Shelp, B. J. & Fromm, H. (1995) Plant Physiol. 108, 551-561. [DOI] [PMC free article] [PubMed] [Google Scholar]
- 10.Baum, G., Lev-Yadun, S., Fridmann, Y., Arazi, T., Katsnelson, H., Zik, M. & Fromm, H. (1996) EMBO J. 15, 2988-2996. [PMC free article] [PubMed] [Google Scholar]
- 11.Snedden, W. A., Koutsia, N., Baum, G. & Fromm, H. (1996) J. Biol. Chem. 271, 4148-4153. [DOI] [PubMed] [Google Scholar]
- 12.Zik, M., Arazi, T., Snedden, W. A. & Fromm, H. (1998) Plant Mol. Biol. 37, 967-975. [DOI] [PubMed] [Google Scholar]
- 13.Busch, K. B. & Fromm, H. (1999) Plant Physiol. 121, 589-597. [DOI] [PMC free article] [PubMed] [Google Scholar]
- 14.Busch, K., Piehler, J. & Fromm, H. (2000) Biochemistry 39, 10110-10117. [DOI] [PubMed] [Google Scholar]
- 15.The Arabidopsis Genome Initiative (2000) Nature 408, 796-815. [DOI] [PubMed] [Google Scholar]
- 16.Sunkar, R., Kaplan, K., Bouché, N., Arazi, T., Dolev, D., Talke, I. N., Maathuis, F. J. M., Sanders, D., Bouchez, D. & Fromm, H. (2000) Plant J. 24, 533-542. [DOI] [PubMed] [Google Scholar]
- 17.Koch, E. & Slusarenko, A. (1990) Plant Cell 2, 437-445. [DOI] [PMC free article] [PubMed] [Google Scholar]
- 18.Thordal-Christensen, H., Zhang, Z., Wei, Y. & Collinge, D. B. (1997) Plant J. 11, 1187-1194. [Google Scholar]
- 19.Okuda, T., Matsuda, Y., Yamanaka, A. & Sagisaka, S. (1991) Plant Physiol. 97, 1265-1267. [DOI] [PMC free article] [PubMed] [Google Scholar]
- 20.Willekens, H., Chamnongpol, S., Davey, M., Schraudner, M., Langebartels, C., Van Montagu, M., Inze, D. & Van Camp, W. (1997) EMBO J. 16, 4806-4816. [DOI] [PMC free article] [PubMed] [Google Scholar]
- 21.Ngo, T. T. & Lenhoff, H. M. (1980) Anal. Biochem. 105, 389-397. [DOI] [PubMed] [Google Scholar]
- 22.Shindler, J. S., Childs, R. E. & Bardsley, W. G. (1976) Eur. J. Biochem. 65, 325-331. [DOI] [PubMed] [Google Scholar]
- 23.Bechtold, N., Ellis, J. & Pelletier, G. (1993) C. R. Acad. Sci. Ser. III 316, 1194-1199. [Google Scholar]
- 24.Møller, S. G., Ingles, P. J. & Whitelam, G. C. (2002) New Phytol. 154, 553-590. [DOI] [PubMed] [Google Scholar]
- 25.Beers, E. P. & McDowell, J. M. (2001) Curr. Opin. Plant Biol. 4, 561-567. [DOI] [PubMed] [Google Scholar]
- 26.Mittler, R. (2002) Trends Plant Sci. 7, 405-410. [DOI] [PubMed] [Google Scholar]
- 27.Levine, A. (1999) in Plant Responses to Environmental Stresses: From Phytohormones to Genome Reorganization, ed. Lerner, H. R. (Dekker, New York), pp. 247-264.
- 28.Veljovic-Jovanovic, S., Noctor, G. & Foyer, C. H. (2002) Plant Physiol. Biochem. 40, 501-507. [PMC free article] [PubMed] [Google Scholar]
- 29.Neill, S., Desikan, R. & Hancock, J. (2002) Curr. Opin. Plant Biol. 5, 388-395. [DOI] [PubMed] [Google Scholar]
- 30.Gutierrez-Alcala, G., Gotor, C., Meyer, A. J., Fricker, M., Vega, J. M. & Romero, L. C. (2000) Proc. Natl. Acad. Sci. USA 97, 11108-11113. [DOI] [PMC free article] [PubMed] [Google Scholar]
- 31.May, M., Vernoux, T., Leaver, C., Van Montagu, M. & Inze, D. (1998) J. Exp. Bot. 49, 649-667. [Google Scholar]
- 32.Noctor, G. & Foyer, C. H. (1998) Annu. Rev. Plant Physiol. Plant Mol. Biol. 49, 249-279. [DOI] [PubMed] [Google Scholar]
- 33.Karpinski, S., Reynolds, H., Karpinska, B., Wingsle, G., Creissen, G. & Mullineaux, P. (1999) Science 284, 654-657. [DOI] [PubMed] [Google Scholar]
- 34.Adams, J. D., Jr., Klaidman, L. K., Chang, M. L. & Yang, J. (2001) Curr. Top. Med. Chem. 1, 473-482. [DOI] [PubMed] [Google Scholar]
- 35.Tretter, L. & Adam-Vizi, V. (2000) J. Neurosci. 20, 8972-8979. [DOI] [PMC free article] [PubMed] [Google Scholar]
- 36.Yang, T. & Poovaiah, B. W. (2002) Proc. Natl. Acad. Sci. USA 99, 4097-4102. [DOI] [PMC free article] [PubMed] [Google Scholar]
- 37.Pei, Z. M., Murata, Y., Benning, G., Thomine, S., Klusener, B., Allen, G. J., Grill, E. & Schroeder, J. I. (2000) Nature 406, 731-734. [DOI] [PubMed] [Google Scholar]
- 38.Larkindale, J. & Knight, M. R. (2002) Plant Physiol. 128, 682-695. [DOI] [PMC free article] [PubMed] [Google Scholar]
- 39.Coelho, S. M., Taylor, A. R., Ryan, K. P., Sousa-Pinto, I., Brown, M. T. & Brownlee, C. (2002) Plant Cell 14, 2369-2381. [DOI] [PMC free article] [PubMed] [Google Scholar]
- 40.Lam, H. M., Chiu, J., Hsieh, M. H., Meisel, L., Oliveira, I. C., Shin, M. & Coruzzi, G. (1998) Nature 396, 125-126. [DOI] [PubMed] [Google Scholar]
- 41.Davenport, R. (2002) Ann. Bot. (London) 90, 549-557. [DOI] [PMC free article] [PubMed] [Google Scholar]
- 42.Dennison, K. L. & Spalding, E. P. (2000) Plant Physiol. 124, 1511-1514. [DOI] [PMC free article] [PubMed] [Google Scholar]
- 43.Kim, S. A., Kwak, J. M., Jae, S. K., Wang, M. H. & Nam, H. G. (2001) Plant Cell Physiol. 42, 74-84. [DOI] [PubMed] [Google Scholar]
- 44.Ishikawa, A., Okamoto, H., Iwasaki, Y. & Asahi, T. (2001) Plant J. 27, 89-99. [DOI] [PubMed] [Google Scholar]
- 45.Deuschle, K., Funck, D., Hellmann, H., Daschner, K., Binder, S. & Frommer, W. B. (2001) Plant J. 27, 345-356. [DOI] [PubMed] [Google Scholar]
- 46.Gibson, K. M., Christensen, E., Jakobs, C., Fowler, B., Clarke, M. A., Hammersen, G., Raab, K., Kobori, J., Moosa, A., Vollmer, B., et al. (1997) Pediatrics 99, 567-574. [DOI] [PubMed] [Google Scholar]
- 47.Schaller, M., Schaffhauser, M., Sans, N. & Wermuth, B. (1999) Eur. J. Biochem. 265, 1056-1060. [DOI] [PubMed] [Google Scholar]
- 48.Arnon, D. I. (1949) Plant Physiol. 24, 1-15. [DOI] [PMC free article] [PubMed] [Google Scholar]
Associated Data
This section collects any data citations, data availability statements, or supplementary materials included in this article.