Abstract
Replica-exchange molecular dynamics simulations in implicit solvent have been carried out to study the folding thermodynamics of a designed 20-residue peptide, or ``miniprotein.'' The simulations in this study used the amber (parm94) force field along with the generalized Born/solvent-accessible surface area implicit solvent model, and they spanned a range of temperatures from 273 to 630 K. Starting from a completely extended initial conformation, simulations of one peptide sequence sample conformations that are <1.0 Å Cα rms positional deviation from structures in the corresponding NMR ensemble. These folded states are thermodynamically stable with a simulated melting temperature of ≈400 K, and they satisfy the majority of experimentally observed NMR restraints. Simulations of a related mutant peptide show a degenerate ensemble of states at low temperature, in agreement with experimental results.
Arecent paper by Neidigh et al. (1) describes the design of a stably folded, 20-residue ``miniprotein.'' This protein was derived from C-terminal fragments of the 39-residue exendin-4 peptide (2). Several constructs of increasing stability were made, gradually introducing stabilizing features like helical N-capping residues and a solvent-exposed salt bridge. The final 20-residue peptide showed a cooperative melting transition with a midpoint of ≈315 K in aqueous solution at pH 7. The NMR structure [Protein Data Bank ID 1L2Y (3)] of this peptide, denoted TC5b by Neidigh et al. (1), was determined based on 169 interproton distance restraints, and it shows a well structured hydrophobic core where the indole side chain of a Trp residue is buried between the rings of two Pro residues. The small size and stability of this protein make it an ideal choice for simulation studies of protein folding.
There are three main types of questions that arise in computational simulations of the protein folding process: questions of structure, thermodynamics, and kinetics. The first and most basic question is whether the simulation can reproduce the folded conformation of the protein. Once it is clear that the simulations can sample between the folded and unfolded states of the protein, thermodynamic questions arise. Specifically, the simulation's ability to reproduce the stability of the folded state as a function of temperature or denaturant should be assessed. If the simulation reproduces the melting curve of the protein, it becomes reasonable to look at further thermodynamic details of the folding process, including its entropic and enthalpic contributions as well as the nature of the heat-capacity changes on protein folding or unfolding. The final area of interest is the question of kinetics: whether the simulation predicts the correct overall rate of protein folding, and the nature of that process. Kinetics is an area of interest where the microscopic insights from simulation are a valuable complement to experiment, helping to establish whether folding is a simple process with several clear intermediates and barriers or one with a broad ensemble of paths from unfolded conformations to the folded state.
The ``Trp-cage'' has lived up to its promise as a system accessible to both experimental and computational characterization. Simmerling et al. (4) have reported a blind structure prediction of the TC5b sequence based on a simulated annealing protocol using a combination of implicit and explicit solvent with a modified version of the Assisted Model Building with Energy Refinement (AMBER) force field (5). Their prediction reproduced the experimental structure to within <1.0 Å Cα rms positional deviation (RMSD). After these experimental and computational characterizations of the folded structure, significant work was done to study the kinetics of folding in this protein. Laser temperature jump relaxation experiments have shown that it is the most rapidly folding protein known, with a folding time of ≈4.1 μs (6). These experiments were complemented by simulations of the folding kinetics that indicated a folding time between 1.5 and 8.7 μs (7). The work described below represents the third piece of the puzzle for computational studies of Trp-cage folding: the characterization of the folding thermodynamics for the Trp-cage via computer simulation.
To achieve thorough sampling of the conformational space of the protein, the replica-exchange simulation method (8) was used. Replica-exchange calculations have proven to be a simple, effective, and moderately parallel simulation technique to significantly improve thermodynamic sampling in simulations of glassy systems like biomolecules (9). In replica-exchange calculations, several copies, or ``replicas,'' of the same system are simulated in parallel at different temperatures. Periodically, attempts are made to ``swap'' the conformations of replicas adjacent in temperature, moving the low-temperature conformation to the high-temperature simulation and vice versa. In canonical replica exchange, these replica swaps are accepted or rejected according to a Monte Carlo procedure with an acceptance probability: P(accept) = min[1, e+(βlo–βhi)(Uhi–Ulo)], where U is the potential energy of each replica. The net effect of replica exchange is to prevent low-temperature simulations from becoming trapped in local minima, because they are occasionally swapped to higher temperatures where they can escape these minima and move to other regions of phase space. Simultaneously, the low-temperature simulations are always being seeded with uncorrelated low-energy conformations produced by simulations at higher temperatures.
The replica-exchange method has been used to simulate proteins and peptides with a range of different potential functions, from empirical energy functions (10) to physically based molecular mechanics energy functions involving either implicit or explicit solvent models. Using different water models and force fields, several groups, including Sanbonmatsu and Garcia (11) and Zhou et al. (12), have reported explicit solvent replica-exchange simulations of the C-terminal β-hairpin from the B1 domain of protein G (13). Zhou and Berne (14) also have simulated the same system by using an implicit solvent model and found significant differences between the explicit and implicit solvent folding free-energy landscapes.
In addition to the Trp-cage, several other peptides have been folded successfully to near their native structure via computer simulations that start with a completely extended or disordered structure, including β-hairpins (15–18), ββα structures (18, 19), and a three-stranded β-sheet (18, 20). Nonnatural peptides composed of β-amino acids also have been folded successfully into helical (21) and hairpin (22) structures. These successes hint that careful, accurate computer simulations hold great promise for the modeling of protein folding.
Systems and Methods
Two of the 20-residue peptides designed by Neidigh et al. (1) were simulated in this study. The first, referred to by Neidigh et al. (1) as TC5b, consisted of the sequence NLYIQWLKDGGPSSGRPPPS. The second, less stably folded peptide, denoted TC3b, has the sequence NLFIEWLKNGGPSSGAPPPS. Both termini of each peptide were simulated as charged species, and all ionizable side chains were set to their pH 7 protonation state.
All simulations and calculations were carried out with the programs from the amber 6.0 simulation package (www.amber.ucsf.edu) unless noted. The peptides were represented by using the Cornell et al. (23) all-atom force field, which resulted in a total of 304 and 289 atoms for TC5b and TC3b, respectively. The generalized Born/solvent-accessible surface area (GB/SA) implicit solvent model [Bondi radii, solvent dielectric constant 78.5, surface tension 0.005 cal·mol–1·Å2 (24); 1 cal = 4.184 J] was used to model the effects of solvation (25). No attempt was made to modify the parameters of the implicit solvent model to capture the temperature dependence of solvation. All intrapeptide non-bonded interactions were included in the calculation. The SHAKE algorithm (26) with a relative geometric tolerance of 10–5 was used to constrain all bond lengths to their equilibrium distances. Although this would normally permit use of a 2-fs time step, a 1-fs time step was used because energy conservation tests showed that a 2-fs time step led to unacceptably large drifts (>0.5 kcal·mol–1·ps–1) in the total energy of the system.
Both peptides (TC5b and TC3b) were initially built in extended conformations. They were initially subjected to 5,000 steps of steepest descent minimization, followed by a single equilibration trajectory of 50 ps where the temperature was established by velocity reassignment from a Maxwell–Boltzmann distribution at 298 K and maintained at that temperature by using a Berendsen thermostat (27) with a coupling constant of 1 ps–1. The final state of this simulation was used as the initial conformation for every simulation of the subsequent replica-exchange calculations.
For this study, we made use of the parallel replica-exchange simulation method (8), an efficient technique for enhancing sampling in glassy systems like biomolecules (9). The replica-exchange method was implemented as an external driver script for the sander molecular dynamics program. Twenty-three replicas were simulated over a range of temperatures from 250 to 630 K: 250, 255, 260, 265, 273, 284, 298, 315, 333, 353, 373, 393, 413, 433, 454, 473, 493, 513, 533, 555, 580, 605, and 630 K. Initial attempts to use a more standard exponential spacing of replica temperatures and fewer replicas (12 replicas; data not shown) showed a significant drop in the replica-swap acceptance ratio at higher temperatures, indicating a significant temperature dependence of the heat capacity. Exchange attempts were made after every 5 ps of simulation. Multiple, successive trial moves were considered at each exchange attempt, allowing for rapid movement of the replica systems over a range of temperatures. Average acceptance ratios for the replica-swap moves ranged from 30% to 80%. Replica temperatures were maintained at the appropriate values by a combination of velocity reassignment from a Maxwell–Boltzmann distribution (after each exchange attempt) and a Berendsen thermostat (27) with a coupling constant of 1 ps–1. Because replica-exchange simulation is a thermodynamic sampling technique, it is not possible for us to quantitatively discuss any of the kinetics or time scales for the folding process we observed.
After an initial replica-exchange equilibration period of 2 ns per replica, conformations were saved from the simulation of each replica every 0.25 ps over a production simulation time of 2 ns. This yielded a total of 8,000 conformations of each peptide at each temperature. Calculations in which the initial nanosecond of production replica exchange was discarded and only the latter nanosecond of each simulation was analyzed yielded results similar to the full 2-ns simulations, so only the latter are reported. For TC5b, similar replica-exchange runs starting from either the same extended structure with a different random number seed or the first structure of the NMR ensemble both yield results similar to the simulations reported in this article, suggesting that our simulations are well converged (data not shown). The aggregate simulation time was ≈92 ns per peptide, requiring a total wall clock time of 19 days on 23 200 MHz IBM POWER3 SP2 processors per peptide.
Cα positional RMSD, Cα distance matrix error (DME), and hydrogen bond occupancy measurements were made for the structures in each trajectory. α-Helical (i)–(i + 4) backbone hydrogen bond occupancies were measured by using a maximal donor–acceptor heavy-atom distance of 3.5 Å and a maximal donor–hydrogen–acceptor angle of 120°. The simulation structures were compared against all 38 NMR structures in the Protein Data Bank file. For the Cα RMSD measurements, simulated structures were counted as ``folded'' if they were within 2.0 Å Cα RMSD of any of these 38 structures.
A simple Cα DME-based iterative clustering scheme was used to find the dominant conformational clusters as a function of temperature for each peptide. First, the Cα DME was calculated between each pair of the 8,000 conformations sampled at a given temperature. Next, the conformation at the center of the largest cluster was found. This was defined as the conformation with the most other conformations within 1.0-Å DME. All of the members of this cluster (conformations within 1.0-Å DME of the cluster center) were removed from the calculation, and the center of the next largest cluster was determined. This procedure was continued until all conformations were assigned to a cluster or 50 clusters were found.
The 169 NMR distance restraints for the 1L2Y structure (determined at 282 K) were downloaded from the Protein Data Bank (3). The corresponding inverse sixth-power averaged interproton distances were calculated separately for each of the 23 TC5b simulation trajectories, and the values were compared. A restraint was counted as ``violated'' if the simulated distance was outside either the upper or lower bound of the NMR distance restraint by >0.25 Å.
Constant-volume heat capacities were calculated as a function of temperature by finite difference of the average total energies of the system at adjacent temperatures. The value at each temperature was calculated by Cv(Tn) = [E(Tn+1)–E(Tn–1)] /(Tn+1–Tn–1), where E is the total energy (kinetic plus potential) of the simulated system and the temperatures used were the target values for each replica. The reported uncertainty in the heat-capacity determination was derived by propagating the uncertainties in the average total energies.†
Results
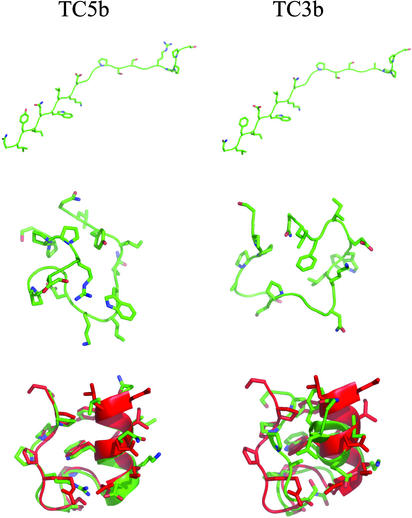
Fig. 1 shows several representative structures from both sets of simulations. These images were generated by using the pymol (http://pymol.sourceforge.net/) program package. The initial extended structures of TC5b and TC3b are >14 Å Cα RMSD from the structures in the TC5b NMR ensemble. Both peptides collapse rapidly during the initial equilibration to produce the second pair of structures in Fig. 1. These collapsed states of course have lower RMSD from the TC5b NMR ensemble (≈4.6 Å in both cases). After the 2 ns of replica-exchange equilibration, we find that most of the low-temperature replicas are already in native-like folded states (<2.0 Å Cα RMSD). The third structures shown for each peptide in Fig. 1 represent the final conformations of the 298-K replica from each 2-ns production replica-exchange simulation. In this case, the TC5b structure is 1.3 Å Cα RMSD from structure 16 of the NMR ensemble, and within 2.0 Å of all 38 NMR structures. In contrast, the TC3b structure is still at least 3.3 Å Cα RMSD from any of the NMR structures. These final structures are shown superimposed on the first structure of the TC5b NMR ensemble. It is clear from Fig. 1 that the TC5b simulation samples structures that not only reproduce the overall topology of the NMR structures but also show Trp-cage packing of Trp-6 between Pro-12 and Pro-17–Pro-19. Although the TC3b structures are compact and show a native-like overall topology, they lack this packing.
Fig. 1.
Sample structures from the TC5b (Left) and TC3b (Right) simulations. Simulated structures are shown in green. (Top) Initial extended conformation of each peptide. (Middle) Peptide structures after 50 ps of 298-K molecular dynamics (MD) equilibration. (Bottom) Final 298-K conformation for each peptide after the 4-ns replica-exchange run. The simulated structures are shown superimposed on the first conformation of the TC5b NMR ensemble (shown in red). The structures were superimposed based on Cα RMSD. These images were generated with the pymol program.
The quality of the simulated folded structures also can be assessed by comparing the TC5b simulations against the experimental NMR restraints. As an example, there are 24 restraint violations (of a total of 169) of >0.25 Å in the 298-K TC5b simulation. Eight of these violations are severe (>1.0 Å). The severe violations highlight the few significant differences between the simulated structures and the NMR ensemble. Five of the eight severe violations involve the δ protons of Leu-7, which is tightly packed against the hydrophobic core in the NMR structures but takes a slightly more solvent-exposed conformation in the simulated structures. One violation is related to a shift in the position of the first N-terminal residue. In many of the NMR structures, the side chain of Asn-1 projects into solution, whereas in the simulated structures, the amide group of this side chain is often found accepting a hydrogen bond from the backbone N–H group of Ile-4. Another severe violation is due to the rotation of Ser-14 to donate an intramolecular hydrogen bond to the backbone carbonyls of Gly-10 and Gly-11, rather than Asp-9. A final violation arises because the guanidinium group of Arg-16 packs more tightly against the surface of the protein than it does in the simulated structures, lengthening the distance between the HD2 and HD3 protons of this side chain and the δ proton of the Trp-6 indole ring. Many of these strong violations seem to be associated with intramolecular hydrogen bonds in solvent-exposed positions on the protein.
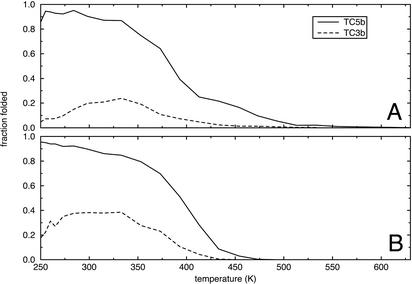
Although it is clear from Fig. 1 that the TC5b simulations sample conformations that are very similar to the folded state, this result does not reveal anything about the folding thermodynamics. Fig. 2 shows several quantitative measures of the fraction of folded structure present in the simulations at each temperature, for both TC5b and TC3b. Fig. 2A shows the fraction of peptide conformations that are within 2.0 Å Cα RMSD from 1 of the 38 structures of the TC5b NMR ensemble. For comparison, the 38 structures of the TC5b NMR ensemble are all within 1.23 Å Cα RMSD of one another. When the 2.0-Å threshold is used for the TC5b simulations, there is clearly a sharp melting transition at ≈390 K. With a more restrictive 1.5-Å threshold, we see a folded state that is at most 67% populated with a broad melting transition (data not shown). For the TC3b simulations, there is at most 24% of conformations within 2.0 Å Cα RMSD of the TC5b NMR structures. Moreover, the fraction of TC3b simulations that fit these criteria actually decays at low temperatures, indicating that the TC5b folded structure is not the free-energy minimum for the TC3b peptide. Fig. 2B shows the fraction of conformations in each simulation that are within 2.0 Å Cα RMSD of the average structure from the corresponding 250-K simulation for the same peptide. The TC5b curve in this panel is qualitatively identical to the curve based on Cα RMSD from the NMR ensemble, showing a melting temperature of ≈400 K. However, in this case it is clear that the TC3b peptide exhibits some sort of stable structure at low temperatures. At low temperatures, ≈40% of the simulated TC3b conformations are within 2.0 Å Cα RMSD of the 250-K average conformation. It is important to note that even in highly denatured ensembles or molten globules, the average structure can have significant native-like character (28, 29). In this case, the 250-K average structures for TC5b and TC3b are 1.6 and 1.9 Å Cα RMSD from the NMR ensemble, respectively.
Fig. 2.
(A) The fraction of conformations for each peptide that are within 2.0 Å Cα RMSD of any of the 38 structures of the TC5b NMR ensemble as a function of temperature. (B) The fraction of conformations for each peptide that are within 2.0 Å Cα RMSD of the average structure for that peptide from the simulation at 250 K.
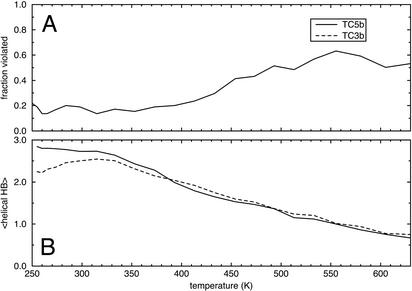
Fig. 3A shows the fraction of the experimental NMR restraints that are satisfied by the TC5b simulations as a function of temperature. Again, we see a melting transition at ≈400 K, where the number of restraint violations begins to rise. Similar NMR data are not available for TC3b. Fig. 3B shows the average number of α-helical hydrogen bonds formed at each temperature, and it serves to show that the folding transition is somewhat independent of helix formation. Moreover, both TC3b and TC5b show roughly similar overall stability of the helical structure, with some deviation at low temperatures.
Fig. 3.
(A) The fraction of the 169 experimental NMR distance measurements that were violated by the TC5b simulation data as a function of temperature. Similar experimental data were not available for TC3b. (B) Average number of α-helical hydrogen bonds that are present in each simulation as a function of temperature.
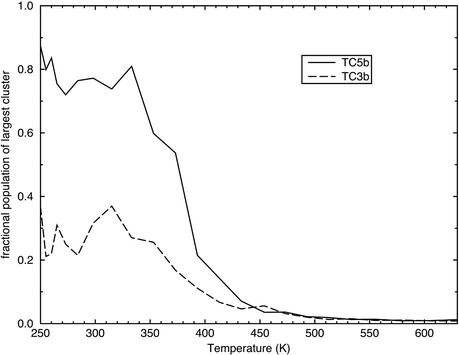
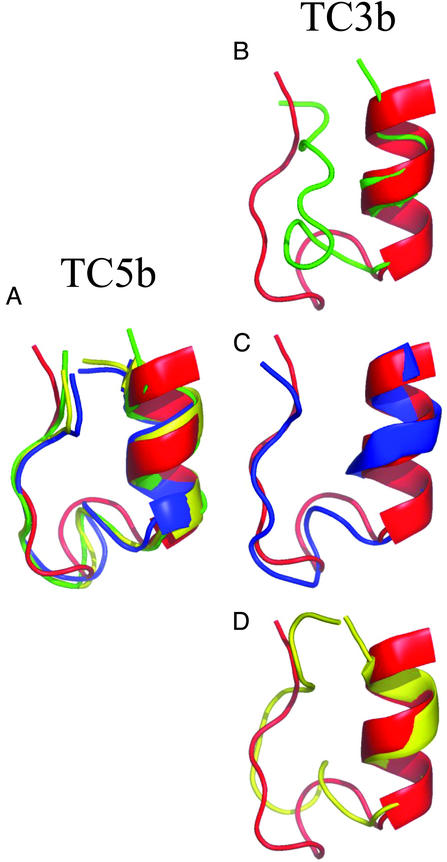
To avoid any bias inherent in comparisons with the TC5b experimental data, we separately carried out conformational clustering on the simulations of both TC5b and TC3b. For each peptide, the simulation conformations at each temperature were sorted into clusters by using a simple iterative clustering algorithm. Fig. 4 shows the fraction of conformations that belong to the largest cluster at each temperature. For TC5b, it is clear that the clustering produces results similar to the comparison with the experimental structure, yielding a clear melting temperature of ≈380 K. In addition, this central cluster is 87% populated at low temperatures, whereas the next largest cluster is only 6% populated. In contrast, the TC3b simulation shows a largest cluster that is, at most, 37% populated, with only a weak folding transition. At low temperatures the TC3b simulation populates three distinct clusters, which are 37%, 21%, and 19% populated. The conformations at the center of the top three clusters for each peptide at 250 K are shown superimposed on a structure from the TC5b NMR ensemble in Fig. 5. It is clear that the top three clusters for the TC5b peptide are all highly similar, whereas the TC3b cluster centers are all quite distinct. They each show a well formed N-terminal α-helix, but they differ in the packing of the proline-rich C-terminal strand against the hydrophobic face of the helix.
Fig. 4.
The fraction of conformations for each peptide that belong to the largest conformational cluster at each temperature. Conformations were clustered by using a simple iterative scheme based on a Cα DME threshold of 1.0 Å.
Fig. 5.
Structures of the major cluster centers from the TC5b and TC3b simulations. Cartoon backbone representations are shown for the centers of the three largest clusters from the 250-K simulations for both peptides. The simulation structures (green, blue, and yellow, in order of cluster size) are shown superimposed on the first structure from the TC5b NMR ensemble (red) based on the Cα positions of residues 2–9. (A) Cluster centers for TC5b, where the top three clusters all have very similar conformations. These clusters account for 87%, 6%, and 5% of the sampled TC5b conformations at 250 K. (B) The center of the largest TC3b 250-K cluster in green (37% of sampled conformations). (C) The second largest TC3b 250-K cluster in blue (21% of sampled conformations). (D) The third largest TC3b cluster in yellow (19% of sampled conformations). (B–D) The three major TC3b clusters differ significantly in the packing of the C-terminal polyproline helix against the N-terminal α-helix. These images were generated with the pymol program.
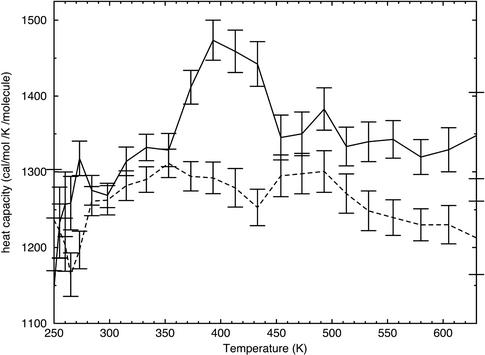
One hallmark of the protein folding–unfolding transition is a spike in heat capacity at the melting temperature. Also, the unfolded state has a higher heat capacity than the folded state (30). To see whether our simulations reproduced this property, we calculated the heat capacity as a function of temperature. It is critical to note that the generalized Born/solvent-accessible surface area (GB/SA) implicit solvent model has no explicit temperature dependence. As a result, heat-capacity changes on hydrophobic hydration or association (31) are not reproduced. Instead, the heat-capacity data shown in Fig. 6 merely reflect the changes in the peptide's energy and chain entropy. Although the uncertainties are large, there is a clear spike of ≈200 cal·mol–1·K–1·molecule–1 (10 cal·mol–1·K–1·residue–1) in the TC5b heat-capacity curve from 373 to 433 K, spanning the range of temperatures where unfolding seems to occur based on the structural observables of Figs. 2, 3, 4. No such feature is seen in the TC3b heat-capacity curve, showing that it does not undergo an unfolding transition.
Fig. 6.
The heat capacity of each simulated peptide system is shown as a function of temperature. The TC5b simulation data points are shown connected with a solid line, whereas the TC3b simulation data points are connected by a dashed line. Error bars represent one standard deviation about the mean.
Discussion and Conclusions
The Trp-cage is a case where simulations using a physically based molecular mechanics potential accurately (<1 Å Cα RMSD) reproduce the stable folded structure of a peptide or small protein when started from a completely extended state. Simple structural agreement, however, is not a complete test of a computational model of the folding process. The simulations described in this article have verified that these low-RMSD native-like structures are the global free-energy minimum for the TC5b peptide in this model. In addition, we have shown that these computational models can reproduce the sequence-dependent stability of two related sequences and give some clue to its origin. Given the stability of this structure and the small size of the system, it will not be surprising if similar results are obtained for Trp-cage variants with other force field and solvent model combinations.
Our TC5b simulations show strong, cooperative folding to a well structured native state that reproduces most of the experimental NMR distance restraints. Some of the close geometric agreement between our simulated structures and the reported NMR structures is undoubtedly due to the fact that both our simulations and the final stages of the NMR structure determination used the same molecular mechanics force field. The observation that most of the strong violations of NMR distance restraints in our simulated structures seem to be associated with solvent-exposed intramolecular hydrogen bonds suggests that these structural differences may be due to deficiencies in the implicit solvent model used in our calculations.
Interestingly, the folded state of TC5b seems to be too stable in this potential, with an unphysical melting temperature of ≈400 K, far beyond the experimental value of ≈315 K. We do not expect to quantitatively reproduce the experimental melting curves, because the implicit solvent model used in this simulation has no temperature dependence. It has also been noted that generalized Born/solvent-accessible surface area (GB/SA)-type solvation models, and perhaps continuum models in general, overstabilize solvent-exposed salt bridges (14) like the critical Asp-9–Arg-16 salt bridge in TC5b. GB/SA models have also been found to overstabilize the folded states of proteins (32). A further issue contributing to the anomalous stability is likely the tendency of the Cornell et al. (23) force field to overstabilize α-helical structures (33).
In contrast to the clear folding transition seen for TC5b, the TC3b simulations in this study are at best weakly folded. The low-temperature average ``folded'' state for TC3b is at most ≈40% populated. Cluster analysis reveals three substates for TC3b that are conformationally distinct, but each is at most 37% populated at low temperatures. However, the TC5b and TC3b simulations show similar helical stability. Structural analysis shows that the degenerate substates of TC3b involve alternative packing arrangements of the polyproline helix against the N-terminal α-helical secondary structure. Moreover, our TC3b simulations lack the clear heat-capacity peak that is a hallmark of strong cooperative folding in the TC5b system. All these data combine to give a picture of TC3b folding where there is a set of degenerate, compact, and structurally distinct states of low free energy. In contrast, our TC5b simulations show strong folding to a single, relatively unique, global free-energy minimum.
There are several clear future directions for simulation research on these peptides. First, the effect of different force field parameters on the folding of these peptides can be addressed by carrying out similar simulations with other common biomolecular force fields, like AMBER parm99 (5), OPLS-AA/L (34), and CHARMm 22 (35). Second, the implicit solvation model used in the current study could be replaced by explicit solvent. Given the 1/√N scaling of replica-exchange acceptance probabilities with system size (36), this latter project may require a large computational resource like the IBM Blue Gene/L machine (37) or the Folding@Home distributed cluster (http://folding.stanford.edu). Finally, the TC5b peptide seems to be somewhat ``preorganized'' to fold because of the intrinsic rigidity of the Trp-cage motif. Experiments indicate that it is the most rapidly folding protein known, with a folding time of ≈4.1 μs (6), and similar rapid folding has been observed in simulation (7). This preorganization certainly could serve to accelerate the kinetics of folding, and it may make the mechanism of Trp-cage folding different from that of more flexible proteins. It is clear from this study that it is possible to sample the folded state and folding thermodynamics of these peptides with relatively short simulation times, so they are an ideal test case for improvements in both simulation models and methodology.
Acknowledgments
This article is dedicated to the memory of Peter Kollman. We thank Ruhong Zhou for his advice and support during this project.
This paper was submitted directly (Track II) to the PNAS office.
Abbreviations: RMSD, rms positional deviation; DME, distance matrix error.
Footnotes
The uncertainties were computed as the standard deviation of the total energy divided by the square root of the number of uncorrelated samples. The number of uncorrelated samples was estimated as the total simulation time (2 ns) divided by twice the correlation time. The correlation time was computed by integrating the normalized fluctuation autocorrelation function of the total energy, produced by sampling the total energy every 0.25 ps.
References
- 1.Neidigh, J. W., Fesinmeyer, R. M. & Andersen, N. H. (2002) Nat. Struct. Biol. 9, 425–430. [DOI] [PubMed] [Google Scholar]
- 2.Neidigh, J. W., Fesinmeyer, R. M., Pricket, K. S. & Andersen, N. H. (2001) Biochemistry 40, 13188–13200. [DOI] [PubMed] [Google Scholar]
- 3.Berman, H. M., Westbrook, J., Feng, Z., Gilliland, G., Bhat, T. N., Weissig, T., Shindyalov, I. N. & Bourne, P. E. (2000) Nucleic Acids Res. 28, 235–242. [DOI] [PMC free article] [PubMed] [Google Scholar]
- 4.Simmerling, C., Strockbine, B. & Roitberg, A. E. (2002) J. Am. Chem. Soc. 38, 11258–11259. [DOI] [PubMed] [Google Scholar]
- 5.Wang, J. M., Cieplak, P. & Kollman, P. A. (2000) J. Comput. Chem. 21, 1049–1074. [Google Scholar]
- 6.Qiu, L. L., Pabit, S. A., Roitberg, A. E. & Hagen, S. J. (2002) J. Am. Chem. Soc. 124, 12952–12953. [DOI] [PubMed] [Google Scholar]
- 7.Snow, C. D., Zagrovic, B. & Pande, V. S. (2002) J. Am. Chem. Soc. 124, 14548–14549. [DOI] [PubMed] [Google Scholar]
- 8.Hansmann, U. H. E. (1997) Chem. Phys. Lett. 281, 140–150. [Google Scholar]
- 9.Mitsutake, A., Sugita, Y. & Okamoto, Y. (2001) Biopolymers 60, 96–123. [DOI] [PubMed] [Google Scholar]
- 10.Kihara, D., Lu, H., Kolinski, A. & Skolnick, J. (2001) Proc. Natl. Acad. Sci. USA 98, 10125–10130. [DOI] [PMC free article] [PubMed] [Google Scholar]
- 11.Garcia, A. E. & Sanbonmatsu, K. Y. (2002) Proteins 42, 345–354. [DOI] [PubMed] [Google Scholar]
- 12.Zhou, R. H., Germain, R. & Berne, B. J. (2001) Proc. Natl. Acad. Sci. USA 98, 14931–14936. [DOI] [PMC free article] [PubMed] [Google Scholar]
- 13.Munoz, V., Thompson, P. A., Hofrichter, J. & Eaton, W. A. (1997) Nature 390, 196–199. [DOI] [PubMed] [Google Scholar]
- 14.Zhou, R. H. & Berne, B. J. (2002) Proc. Natl. Acad. Sci. USA 99, 12777–12782. [DOI] [PMC free article] [PubMed] [Google Scholar]
- 15.Zagrovic, B., Sorin, E. J. & Pande, V. (2001) J. Mol. Biol. 313, 151–169. [DOI] [PubMed] [Google Scholar]
- 16.Wu, H. W., Wang, S. M. & Brooks, B. R. (2002) J. Am. Chem. Soc. 124, 5282–5283. [DOI] [PMC free article] [PubMed] [Google Scholar]
- 17.Okur, A., Strockbine, B., Hornak, V. & Simmerling, C. (2003) J. Comput. Chem. 24, 21–31. [DOI] [PubMed] [Google Scholar]
- 18.Jang, S., Shin, S. & Pak, Y. (2002) J. Am. Chem. Soc. 124, 4976–4977. [DOI] [PubMed] [Google Scholar]
- 19.Snow, C. D., Nguyen, N., Pande, V. S. & Gruebele, M. (2002) Nature 420, 102–106. [DOI] [PubMed] [Google Scholar]
- 20.Ferrara, P. & Caflisch, A. (2000) Proc. Natl. Acad. Sci. USA 97, 10780–10785. [DOI] [PMC free article] [PubMed] [Google Scholar]
- 21.Daura, X., Jaun, B., Seebach, D., van Gunsteren, W. F. & Mark, A. E. (1998) J. Mol. Biol. 280, 925–932. [DOI] [PubMed] [Google Scholar]
- 22.Daura, X., Gademann, K., Schafer, H., Jaun, B., Seebach, D. & van Gunsteren, W. F. (2001) J. Am. Chem. Soc. 123, 2393–2404. [DOI] [PubMed] [Google Scholar]
- 23.Cornell, W. D., Cieplak, P., Bayly, C. I., Gould, I. R., Merz, K. M., Ferguson, D. M., Spellmeyer, D. C., Fox, T., Caldwell, J. W. & Kollman, P. A. (1995) J. Am. Chem. Soc. 117, 5179–5197. [Google Scholar]
- 24.Sitkoff, D., Sharp, K. A. & Honig, B. (1994) J. Phys. Chem. 98, 1978–1988. [Google Scholar]
- 25.Tsui, V. & Case, D. A. (2001) Biopolymers 56, 275–291. [DOI] [PubMed] [Google Scholar]
- 26.Ryckaert, J.-P., Ciccotti, G. & Berendsen, H. J. C. (1977) J. Comput. Phys. 23, 327–341. [Google Scholar]
- 27.Berendsen, H. J. C., Postma, J. P. M., van Gunsteren, W. F., DiNola, A. & Haak, J. R. (1984) J. Chem. Phys. 81, 3684–3690. [Google Scholar]
- 28.Onuchic, J. (1997) Proc. Natl. Acad. Sci. USA 94, 7129–7131. [DOI] [PMC free article] [PubMed] [Google Scholar]
- 29.Zagrovic, B., Snow, C. D., Khaliq, S., Shirts, M. R. & Pande, V. S. (2002) J. Mol. Biol. 323, 153–164. [DOI] [PubMed] [Google Scholar]
- 30.Privalov, P. L. (1979) Adv. Protein Chem. 33, 167–241. [DOI] [PubMed] [Google Scholar]
- 31.Privalov, P. L. & Gill, S. J. (1989) Pure Appl. Chem. 61, 1097–1104. [Google Scholar]
- 32.Bursulaya, B. D. & Brooks, C. L. (2000) J. Phys. Chem. B 104, 12378–12383. [Google Scholar]
- 33.Cornell, W. D., Caldwell, J. W. & Kollman, P. A. (1997) J. Chim. Phys.-Chim. Biol. 94, 1417–1435. [Google Scholar]
- 34.Kaminski, G. A., Friesner, R. A., Tirado-Rives, J. & Jorgensen, W. L. (2001) J. Phys. Chem. B 105, 6474–6487. [Google Scholar]
- 35.MacKerell, A. D., Bashford, D., Bellott, M., Dunbrack, R. L., Evanseck, J. D., Field, M. J., Fischer, S., Gao, J., Guo, H., Ha, S., et al. (1998) J. Phys. Chem. B 102, 3586–3616. [DOI] [PubMed] [Google Scholar]
- 36.Allen, F., Almasi, G., Andreoni, W., Beece, D., Berne, B. J., Bright, A., Brunheroto, J., Cascaval, C., Castanos, J., Coteus, P., et al. (2001) IBM Syst. J. 40, 310–327. [Google Scholar]
- 37.Kofke, D. A. (2002) J. Chem. Phys. 117, 6911–6914. [Google Scholar]


