Abstract
Utrophin levels have recently been shown to be more abundant in slow vs. fast muscles, but the nature of the molecular events underlying this difference remains to be fully elucidated. Here, we determined whether this difference is due to the expression of utrophin A or B, and examined whether transcriptional regulatory mechanisms are also involved. Immunofluorescence experiments revealed that slower fibers contain significantly more utrophin A in extrasynaptic regions as compared with fast fibers. Single-fiber RT-PCR analysis demonstrated that expression of utrophin A transcripts correlates with the oxidative capacity of muscle fibers, with cells expressing myosin heavy chain I and IIa demonstrating the highest levels. Functional muscle overload, which stimulates expression of a slower, more oxidative phenotype, induced a significant increase in utrophin A mRNA levels. Because calcineurin has been implicated in controlling this slower, high oxidative myofiber program, we examined expression of utrophin A transcripts in muscles having altered calcineurin activity. Calcineurin inhibition resulted in an 80% decrease in utrophin A mRNA levels. Conversely, muscles from transgenic mice expressing an active form of calcineurin displayed higher levels of utrophin A transcripts. Electrophoretic mobility shift and supershift assays revealed the presence of a nuclear factor of activated T cells (NFAT) binding site in the utrophin A promoter. Transfection and direct gene transfer studies showed that active forms of calcineurin or nuclear NFATc1 transactivate the utrophin A promoter. Together, these results indicate that expression of utrophin A is related to the oxidative capacity of muscle fibers, and implicate calcineurin and its effector NFAT in this mechanism.
Ever since its initial characterization in the early 1990s, there has been considerable interest in understanding the mechanisms regulating the expression of utrophin in skeletal muscle. This level of interest can be partially attributed to the fact that utrophin accumulates at the level of the neuromuscular junction where it seems to participate in the full differentiation of the postsynaptic membrane domain (1–3). In addition, because of its high degree of sequence identity with dystrophin, utrophin is also a solid candidate in a therapeutic strategy aimed at increasing the expression of a functional substitute for dystrophin in muscle of patients afflicted with Duchenne muscular dystrophy (DMD).
Several studies have shown that utrophin levels can be modulated according to the state of innervation and differentiation of muscle cells. For example, myogenic differentiation leads to a 2-fold increase in the expression of utrophin transcripts (4). Additionally, muscle denervation (5) as well as regeneration have been shown to also affect expression of utrophin (6, 7). In this context, several laboratories have now identified specific transcription factors and promoter elements that are important for regulating the abundance and localization of utrophin transcripts within muscle fibers (8–15). Of particular relevance, it was shown recently that utrophin can be transcribed from two different promoters, resulting in the expression of utrophin A and B transcripts that differ in their 5′ end (16).
In a recent study, we examined the expression and localization of utrophin in slow vs. fast muscles. By using a combination of approaches, we found that, in comparison with the fast extensor digitorum longus (EDL) muscle, the slow soleus contains 3- to 4-fold more utrophin mRNA (17). Accordingly, these findings may have important functional implications in designing a therapeutic strategy based on utrophin up-regulation because it is known that fast fibers are preferentially affected in DMD (18). In the present study, we have capitalized on a combination of approaches to determine whether this difference between fast and slow muscles is due to the expression of utrophin A or B. Additionally, we have also examined whether transcriptional regulatory mechanisms are also involved in the differential pattern of expression of this protein (see ref. 17).
Materials and Methods
Animal Care and Protocols. EDL and soleus muscles from control C57BL/6 mice were dissected and subsequently used for immunofluorescence experiments or to isolate single muscle fibers (see below). Soleus muscles were also used in direct gene transfer studies (see below). Bilateral functional overload of the plantaris muscle was performed by surgically removing the soleus and gastrocnemius muscles from both hindlimbs (19, 20). Injection of mice with cyclosporine A (CsA) (25 mg/kg; twice per day) or vehicle was performed as described in detail (20). Two to four wk later, plantaris muscles were removed, rapidly frozen in liquid nitrogen, and stored at -80°C until further analysis. Transgenic mice expressing a constitutively active form of calcineurin (CnA* Tg) have been characterized (21).
Production of Utrophin A Antibody. A polyclonal antibody for utrophin A was raised in New Zealand White rabbits against the synthetic peptide NH2-CMAKYGDLEARPDDGQNEFSD-COOH (Dalton Chemical Laboratories, Toronto) coupled to keyhole lymphocyte hemocyanin to increase immunogenicity (Covance Research Products, Denver, PA). The peptide was injected intradermally in the back or s.c. in the neck, at a concentration of 250 μg/ml at alternating 3-wk intervals. Production bleeds of antisera were collected 1 wk after each respective peptide boost. Immunoblotting. Total protein was extracted from muscle cells with RIPA buffer (0.15 mM NaCl/0.05 mM Tris·HCl, pH 7.2/1% Triton X-100/1% sodium deoxycholate/0.1% SDS) containing anti-proteases. Forty to 50 micrograms of protein was electrophoresed on 5.5% SDS-polyacrylamide gels and transferred onto poly(vinylidene difluoride) membranes (Immobilon P, Millipore). After preincubation, the membrane was incubated with the rabbit anti-utrophin A antibody (see above). The blot was then washed, incubated with a horse radish peroxidase-conjugated goat anti-rabbit IgG (Jackson ImmunoResearch), and revealed by using an enhanced chemiluminescence kit (Pierce).
Immunofluorescence. The presence of utrophin was detected on serial cross-sections of mouse soleus, EDL, plantaris, and tibialis anterior muscles with either a mouse monoclonal antibody (2002 catalog no. NCL-DRP2, Nova Castra, Newcastle upon Tyne, U.K.) using a mouse on mouse kit (M.O.M., Vector Laboratories), or with a polyclonal anti-utrophin antibody (2002 catalog no. C-19: SC-7459, Santa-Cruz Biotechnology). These two antibodies recognize separate regions of utrophin, i.e., C-19 recognizes the C terminus, whereas DRP2 is against the N terminus. In separate experiments, sections were incubated with a polyclonal utrophin A antibody (see above). Specificity of the labeling was determined by preabsorption of utrophin A antibodies with the peptide used to raise this antibody. Furthermore, the specificity of the three antibodies was ascertained by using muscles from utrophin-deficient and mdx mice.
To label acetylcholine receptors, Alexa 488-conjugated α-bungarotoxin was used (Molecular Probes). Myosin heavy chain (MyHC) IIb was detected by using the BF-F3 antibody (German Collection of Microorganisms and Cell Cultures; refs. 22 and 23). Sections were viewed with a Zeiss Axioskop-2 microscope, and quantitative analyses were performed by using SCION IMAGE software.
Single-Fiber Isolation. Single fibers from EDL and soleus muscles were isolated as described (24).
Expression of Utrophin A Promoter-Reporter Gene Constructs. We used a utrophin A promoter-LacZ reporter gene construct. In addition, we used plasmids that contained a constitutively active form of calcineurin, CnA*, or a constitutively nuclear form of nuclear factor of activated T cells (NFAT) c1 (nNFATc1; refs. 25 and 26). The nNFATc1 plasmid was prepared by RT-PCR using mouse skeletal muscle total RNA and primers that selectively amplify an NFATc1 fragment that lacks the coding region for the first 250 aa (27).
Mouse myogenic C2C12 cells were cultured (see refs. 8, 10, and 28) and transfected with the utrophin A promoter-reporter construct alone, or together with pCnA* or pnNFATc1 plasmids, by using the lipofectamine reagent (GIBCO/BRL). In all these studies, a constitutively expressed chloramphenicol acetyltransferase (CAT) plasmid (Promega) was also included to control for transfection efficiency.
Direct gene transfer was performed on mouse soleus muscles as described in detail elsewhere (8, 9, 17). The soleus muscles were isolated and injected with 10 μl of a solution containing the appropriate plasmids (utrophin A promoter, pCnA* and pCAT) diluted at a concentration of 2–4 μg/μl. Seven days later, injected muscles were excised and immediately frozen in liquid nitrogen, and total RNA was extracted.
RNA Extraction and Quantitative RT-PCR. Total RNA was extracted by using TriPure (Boehringer Mannheim) as recommended by the manufacturer. Quantitative RT-PCR was carried out to determine the relative abundance of total utrophin (both A and B together), utrophin A and B separately, and MyHC transcripts in EDL and soleus single muscle fibers, in whole muscles from mice subjected to different experimental treatments, and to determine the abundance of both LacZ and CAT transcripts in transfected C2C12 muscle cells and in transduced soleus muscles. These assays were performed as described (10, 17, 28). Primers that selectively amplified total utrophin, utrophin A, utrophin B, S12 rRNA, MyHC I, IIa, IIx, IIb, LacZ, and CAT were designed on the basis of available sequences (16, 17, 29). Cycle numbers varied depending on the primers used and were within the linear range (17, 30). For amplification of LacZ and CAT mRNAs, samples were first digested by using DNase 1 to eliminate plasmid contamination (17). In all these assays, negative controls consisted of reverse transcription-mixtures in which total RNA was replaced with RNase-free water. PCR products were first visualized on 1% agarose gels containing ethidium bromide. For quantitative measurements, PCR products were separated and visualized on agarose gels containing the fluorescent dye Vistra Green (Amersham Pharmacia). Values obtained for utrophin, utrophin A, and utrophin B were standardized relative to the amount of S12 rRNA present in the same sample. Values obtained for LacZ were standardized relative to the amount of CAT expressed in the same sample.
Electrophoretic Mobility-Shift Assay (EMSA). Total muscle protein extraction and EMSAs were performed as described (10, 28). The sequences of the synthetic 32P-labeled oligonucleotides encompassing the NFAT binding site in the utrophin A promoter were (in 5′-3′ orientation) gtg cat att gga aaa cag aaa aat (sense) and att ttt ctg ttt tcc aat atg cac (antisense). For competition and supershift experiments, the samples were incubated with a 200× molar excess of unlabeled oligonucleotides or with 2.5 μl of a commercially available NFATc1 antibody (Santa Cruz Biotechnology), respectively.
Statistics. Two tailed Student's t tests, analysis of variance, and regression analysis were used to analyze the data. Means ± SEM are presented throughout.
Results
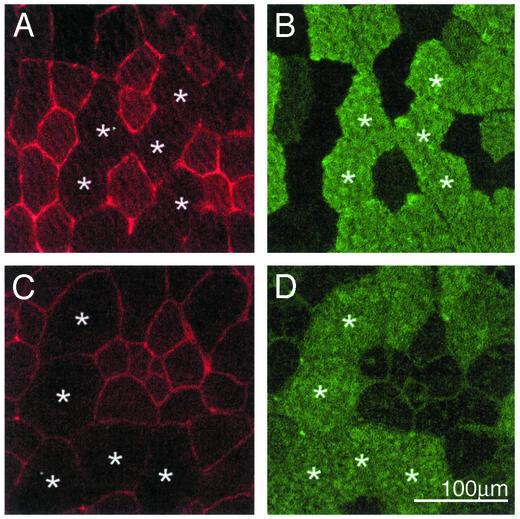
Serial cross sections were used in immunofluorescence experiments to detect both utrophin and MyHC IIb. Exposure times were increased when images were taken to examine extrasynaptic utrophin between fibers. As shown in Fig. 1 A and B, muscle fibers expressing MyHC IIb contain little or no extrasynaptic utrophin. By contrast, MyHC IIb-negative fibers displayed a clear signal for utrophin at their sarcolemma. It is important to note that identical results were obtained by using another commercially available antibody (that recognizes a different region of utrophin; data not shown) and on muscle sections obtained from mdx mice (Fig. 1 C and D) thereby ruling out the possibility of cross-reactivity with dystrophin.
Fig. 1.
Localization of utrophin in extrasynaptic compartments of type IIb-negative fibers. Shown are representative examples of photomicrographs of serial sections processed to detect utrophin by using the DRP2 antibody (A and C) and MyHC IIb (B and D) by immunofluorescence. Note the lack (or low level) of utrophin staining in extrasynaptic regions of IIb fibers from both normal (A and B) and mdx (C and D) mice.*, The same fibers are identified on these serial sections. Images for utrophin were taken with increased exposure times to show the difference in the staining pattern between fiber types.
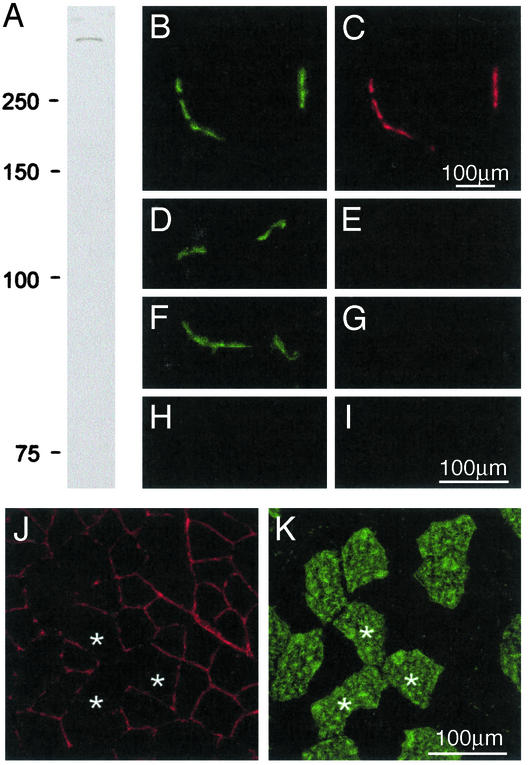
We next examined whether this fiber type-specific pattern of expression could be attributed to the presence of utrophin A (see ref. 31). We therefore generated a rabbit polyclonal antibody against a specific peptide sequence in the distinct N-terminal region of utrophin A (16). Western blot analysis demonstrated that this antibody recognizes a single high-molecular mass protein (Fig. 2A). Fluorescence studies using this antibody clearly showed labeling of neuromuscular junctions (Fig. 2 B and C). Importantly, this utrophin A immunoreactivity was effectively competed by first incubating the antibody serum with the original peptide (Fig. 2 D and E). Furthermore, no immunostaining was detected in junctional regions of utrophin-deficient mice (Fig. 2 F and G). In both the peptide block experiment and on muscle sections from utrophin-deficient mice, no immunoreactivity was observed in extrasynaptic regions (Fig. 2 H and I). Together, these experiments highlight the specificity of the utrophin A antibody and its lack of cross-reactivity with dystrophin. Using this antibody, we observed that MyHC IIb-negative fibers showed higher extrasynaptic expression of utrophin A at the sarcolemma (Fig. 2 J and K). These data indicate therefore that the fiber type differences seen in utrophin expression (see Fig. 1) are caused by differences in the expression pattern of utrophin A.
Fig. 2.
Extrasynaptic utrophin is the A isoform. (A) A polyclonal antibody raised against utrophin A recognizes a single high molecular mass band in Western blots by using muscle proteins. (B and C) Shown is the presence of AChR and utrophin A in cryostat sections of muscle fibers, respectively. Note the accumulation of utrophin A at the neuromuscular junctions. Preincubation of the rabbit serum with the utrophin A peptide, used to raise the antibody, completely abolished the utrophin A labeling (E) at AChR-rich regions (D). This labeling was also absent at AChR-rich regions from utrophin-deficient mice (F and G). In both the peptide block experiments (H) and in sections from utrophin-deficient mice (I), no labeling could be observed using this utrophin A antibody in extrasynaptic compartment of muscle fibers. Double immunofluorescence experiments showed that utrophin A (J) is expressed at the sarcolemma of MyHC IIb-negative fibers (K) and is thus not confined to junctional regions.*, The same fibers are identified in these serial sections.
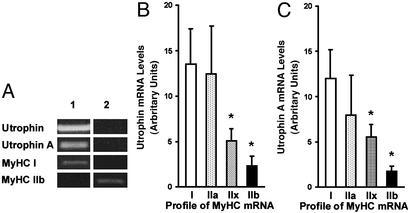
We attempted to establish a correlation between the level of utrophin expression and the MyHC profile of muscle fibers, which is known to reflect not only the speed characteristics of individual fibers, but also their reliance on oxidative capacity. To this end, we performed RT-PCR analysis on single fibers isolated from soleus and EDL muscles. Our initial findings demonstrated that fibers expressing MyHC I contained more utrophin transcripts (A and B together) and that this difference was caused by a greater abundance of utrophin A mRNAs (Fig. 3A). Fibers expressing MyHC IIb mRNA contained much less utrophin transcripts. Because these single fiber experiments displayed such a striking pattern, we counted the number of utrophin-positive fibers expressing a particular isoform of MyHC transcript. We found that 94% of single fibers positive for MyHC I mRNA were also positive for utrophin transcripts. By contrast, <50% of IIb fibers expressed detectable levels of utrophin mRNA. The relative abundance of utrophin mRNA was also dramatically different among the various fiber types. As illustrated in Fig. 3B, utrophin mRNA levels were significantly (P < 0.05) higher in fibers expressing MyHC I and IIa in comparison with those fibers expressing MyHC IIx and IIb. RT-PCR experiments using primers specific for utrophin A and B transcripts further revealed that this difference was in fact due to the presence of utrophin A mRNAs (Fig. 3C). Transcripts encoding utrophin B were low and did not vary according to the MyHC profile (data not shown). As displayed in Fig. 3 B and C, there also seemed to be a progressive decline in the pattern of utrophin expression based on the continuum of fiber types. In fact, a significant correlation (P < 0.05) was seen between the mRNA levels of utrophin A and combined MyHC I and IIa (r = 0.76), but not between utrophin A and MyHC IIb (r = 0.20).
Fig. 3.
Expression of utrophin and utrophin A mRNAs in single fibers. (A) Examples of ethidium bromide-stained agarose gels showing PCR products obtained from two single fibers (1 and 2) for total utrophin, utrophin A, MyHC I, and MyHC IIb. Note the presence of strong utrophin signals in the fiber expressing MyHC I. Quantitation of the RT-PCR data shows that MyHC I and IIa fibers contained considerably more total utrophin (B) and utrophin A (C) transcripts.*, Denoted are significant differences from type I (P ≤ 0.05). A total of 60 fibers were analyzed from three different mice. Mean ± SEM are shown.
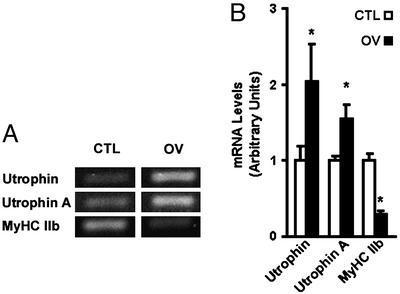
To determine whether adaptive changes resulting in a shift of muscle fiber type toward a slower phenotype could increase utrophin mRNA expression in whole muscle, we subjected plantaris muscle to functional overload because this experimental paradigm is well known to increase the proportion of slower, more oxidative muscle fibers (19, 23). In comparison with sham-operated animals, plantaris muscles that were overloaded demonstrated the typical hypertrophic response as determined by wet muscle mass (increased by ≈2-fold) and a decrease in the level of MyHC IIb transcripts (P < 0.05; Fig. 4; ref. 19). Analysis of utrophin mRNA levels standardized to S12 rRNA indicated that overload induced a 2-fold increase (P < 0.05) in the abundance of utrophin transcripts (Fig. 4). As observed with the single muscle fibers, this increased expression of utrophin mRNA was largely caused by an induction in the levels of utrophin A transcripts (Fig. 4) and protein (not shown).
Fig. 4.
Expression of utrophin transcripts is increased in overloaded plantaris muscle. (A) Examples of ethidium bromide-stained agarose gels showing PCR products obtained from control (CTL) and overloaded (OV) muscles for total utrophin, utrophin A, and MyHC IIb transcripts. Note the increased utrophin and utrophin A mRNAs concurrent with a decrease in MyHC IIb transcripts in OV muscles (B).*, Denoted are significant differences from control (P ≤ 0.05). n = 3 for CTL and n = 6 for OV. Means ± SEM are shown.
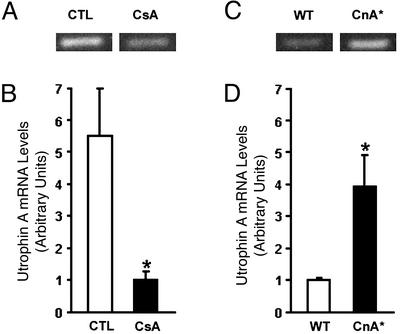
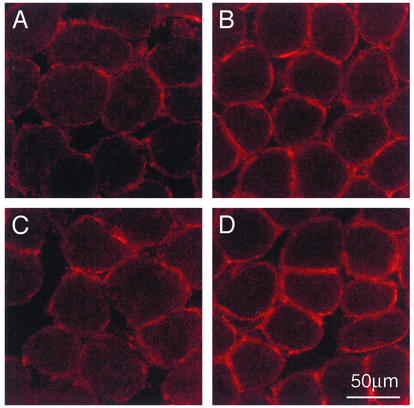
Given these findings and the fact that calcineurin has been recently implicated in regulating the expression of a slower, more oxidative phenotype in muscle fibers (26, 32–35), we also examined the levels of utrophin A mRNA expression in muscle presenting altered levels of calcineurin activity. In comparison with mice treated with a vehicle solution, analysis of muscle from mice treated with CsA showed that calcineurin inhibition led to an ≈80% decrease in utrophin A mRNA levels (Fig. 5 A and B). To further characterize the apparent relationship between utrophin mRNA expression and calcineurin, we determined the levels of utrophin A and B mRNAs in transgenic mice (CnA* mice) engineered to express a constitutively active form of calcineurin (21), which can stimulate the slower, high oxidative fiber myogenic program (34). Examination of these mice revealed that soleus muscles from CnA* mice contained significantly more utrophin A transcripts (P < 0.05) in comparison with wild-type animals (Fig. 5 C and D). Immunofluorescence experiments showed that individual soleus muscle fibers from CnA* mice expressed considerably more utrophin (P < 0.05; ≈70–120% more) at the extrasynaptic sarcolemma in comparison with the levels seen in muscle from age-matched controls (Fig. 6).
Fig. 5.
Expression of utrophin A mRNA is regulated by calcineurin. (A and C) Examples of ethidium bromide-stained agarose gels showing PCR products for utrophin A mRNA in control (CTL) and cyclosporine (CsA)-treated muscles, and in WT and transgenic (CnA*) muscles, respectively. Quantitation showed that, in comparison with vehicle-treated CTL muscles, muscles from CsA-treated mice contained significantly fewer utrophin A transcripts (B). By contrast, muscles from CnA* transgenic mice contained significantly more utrophin A transcripts than WT mice (D).*, Denoted are significant differences (P < 0.05). Muscles from three to six mice were analyzed for each group. Means ± SEM are shown.
Fig. 6.
Increase in utrophin A expression in muscle fibers from CnA* mice. Immunofluorescence experiments were done using the utrophin A antibody on soleus muscle sections from control (A and C) and CnA* (B and D). Note that muscles from CnA* mice express high levels of utrophin A at the sarcolemma of each individual fiber.
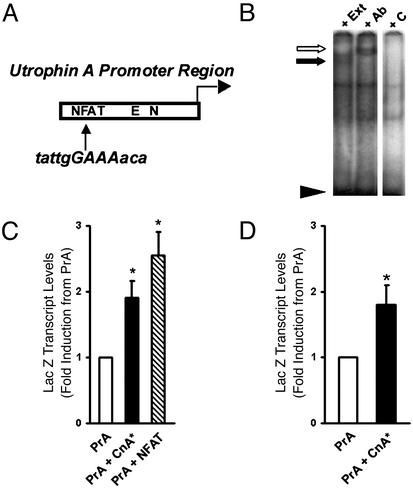
Because the effects of calcineurin on expression of the slower, high oxidative myofiber program involve transcriptional mechanisms (26, 33, 36, 37), we examined whether the mouse and human utrophin A promoters contain a consensus sequence for NFAT, a transcription factor whose nuclear translocation is regulated by calcineurin. Sequence analysis revealed the presence of a putative NFAT-binding site in both the human and mouse promoters upstream of previously characterized N– and E-box motifs (8, 9, 15, 38; Fig. 7A). EMSAs performed using an oligonucleotide that encompasses the NFAT site in the utrophin A promoter showed that muscle proteins could specifically interact with this sequence because this binding was effectively competed on incubation with a 200× molar excess of unlabeled probe (Fig. 7B). Supershift assays confirmed that NFATc1 could directly interact with this region in the utrophin A promoter. Cotransfection studies using C2C12 muscle cells demonstrated that a constitutively active CnA* or nuclear NFATc1 could induce a significant increase (P < 0.05) in the activity of the utrophin A promoter (Fig. 7C). Direct plasmid injection performed in soleus muscles further confirmed that calcineurin affects the activity of the utrophin A promoter in vivo (Fig. 7D).
Fig. 7.
Activity of the utrophin A promoter is modulated by calcineurin and NFAT. (A) Schematic representation of a putative NFAT site in the utrophin A promoter. (B) EMSAs using protein extracts (lane “+ Ext”) incubated with
32P-labeled double-stranded oligonucleotides corresponding to the NFAT motif (black arrow). Note the specific binding activity that is competed by a 200× molar excess of unlabeled probe (lane “+ C”). This binding can be supershifted by adding NFATc1 antibodies in the reaction mixture (white arrow; lane “+ Ab”). (C) C2C12 muscle cells transfected with plasmids containing the utrophin A promoter-LacZ reporter gene alone or with expression vectors containing CnA* or nNFATc1. (D) Mouse soleus muscles were transduced with plasmids containing the utrophin A promoter-reporter gene alone or with an expression vector containing CnA*. Note that, in these two sets of experiments, expression of active CnA* or nuclear NFATc1 increased (P < 0.05) the activity of the utrophin A promoter as measured by the relative abundance of LacZ transcripts. For the transfection experiments, n = 2 to 4 in duplicate. For the injection, n = 4 mice. Means ± SEM are shown.
Discussion
We have used single fiber RT-PCR and immunofluorescence to determine the expression level of utrophin and the MyHC profile of individual muscle fibers. Our results demonstrate that fibers expressing MyHC I and IIa contain significantly more utrophin than type IIx and IIb fibers and that its expression is not confined to junctional regions. By using isoform-specific PCR primers and antibodies, we were also able to show that the increased utrophin expression in type I and IIA fibers is due to a greater expression of utrophin A. This particular isoform of utrophin is preferentially expressed at the level of the postsynaptic membrane of the neuromuscular junction (31). It is therefore interesting to note that, under specific conditions, expression of this utrophin isoform extends well into extrasynaptic compartments of muscle fibers.
Our findings showed that the relative abundance of utrophin A mRNAs correlates well with fiber type characteristics. In fact, it seems that the expression level of utrophin correlates more with the oxidative capacity of the fibers rather than with their contractile, speed-related properties per se. It is well established that type I and IIa fibers display slower MyHC and higher oxidative capacity (19, 39, 40). Fast type IIb fibers, on the other hand, display high energy utilization characteristics and rely more on glycolytic metabolism to derive ATP whereas type IIx fibers lay somewhere in between these two classes in terms of the source of their energy supply. Accordingly, it seems reasonable to argue that utrophin A expression is directly related to the oxidative capacity and mitochondrial content of the fibers, as opposed to their speed of contraction. Interestingly, this relationship may extend even to the subcellular level because, similar to utrophin A, mitochondria and enzymes of oxidative metabolism accumulate within the postsynaptic sarcoplasm (41).
Given that type I and IIa fibers have smaller diameters, an alternative explanation is that utrophin expression may be related to the size of individual muscle fibers. However, our experiments employing functional overload allowed us to rule out this possibility because it is well established that functional overload, which caused a significant increase in utrophin A expression, results in a dramatic doubling in the size of all MyHC fiber types (19, 20, 23). In fact, the shift toward slower MyHC profiles and improved oxidative metabolism (21, 32) that also occurs within overloaded muscles fits nicely with our view that utrophin A expression correlates with the oxidative capacity of muscle fibers.
One of the key questions that arises based on these findings concerns the nature of the signaling pathways involved in controlling utrophin A expression in oxidative fibers as well as in muscle subjected to functional overload. One common feature, due to their recruitment properties, is that oxidative fibers and overloaded muscle fibers likely present sustained levels of intracellular calcium (35, 42). In this context, it is well established that calcium activates calcineurin via calmodulin, which in turn affects muscle characteristics by stimulating the expression of a slower and more oxidative phenotype (20, 32, 43, 44). In our experiments, inhibition of calcineurin with CsA caused a large decrease in utrophin A expression. This result is in fact in excellent agreement with previous findings showing a reduction in oxidative capacity (37, 45) and an increase in the percentage of fast fibers in CsA-treated rodents (26, 37). Furthermore, in our study, we also showed that muscles from transgenic mice expressing a constitutively active form of calcineurin contained ≈4-fold more utrophin A mRNA. Because it has been shown that mice that express an activated form of calcineurin harbor a greater proportion of slower and oxidative fibers (34, 46), these results further support the link between utrophin A expression and the profile of muscle fibers, and clearly implicate calcium and calcineurin as key mediators.
It is now well documented that the slower, oxidative myofiber program is under the influence of sustained calcium influx (caused by tonic electrical activity), which, in turn, can activate calcium-dependent transcription pathways such as the calcineurin/NFAT signaling cascade (26, 37). Calcineurin dephosphorylates NFAT factors, allowing them to travel to the nucleus where they can exert their transcriptional effects by binding to the promoter region of target genes (26, 36, 44, 46, 47). We have shown in the present study that the utrophin A promoter contains an NFAT-binding site, and that calcineurin and NFATc1 can increase the transcriptional activity of this promoter in cultured myogenic cells as well as in muscle in vivo. In this context, we have previously shown that posttranscriptional events acting via the 3′ UTR of utrophin transcripts can, at least partially, account for the increased expression of utrophin transcripts in slow vs. fast muscles (17). Together with the findings of the present study, these results indicate that the regulation of utrophin A in extrasynaptic compartments of slow, oxidative muscle fibers involves the complex interplay between transcriptional and posttranscriptional mechanisms. In one possible scenario, calcineurin could increase the transcriptional activity of the utrophin A promoter while also affecting, through an unknown signaling cascade, the stability of existing transcripts.
One of the questions raised by our findings concerns the functional significance of having more utrophin A in the extrasynaptic compartment of slow, oxidative fibers. Although there are no clear data suggesting a preferential role in slow fibers for utrophin A, several possibilities may be envisaged. For example, it is possible that slow fibers may contain more dystroglycan, thereby allowing for the association of extrasynaptic utrophin with available binding sites at the sarcolemma. In addition, it seems plausible that utrophin-containing dystrophin complex may associate with different signaling molecules in contrast to complexes containing dystrophin. A third possibility is that utrophin-containing complexes may be more or less stable than those containing dystrophin. Finally, the differential binding characteristics of utrophin vs. dystrophin for actin may result in differences in the remodeling of actin filaments in response to mechanical stimulation (48, 49).
The results of the present study may have some important clinical implications. For example, fast IIb fibers from DMD muscles are known to be more prone to degeneration (18) whereas the abundance of MyHC IIx transcripts is reduced in DMD patients (50). It seems likely therefore that, based on our findings, fibers expressing MyHC I and IIa can somewhat compensate for the lack of dystrophin by allowing utrophin A to interact with the dystrophin complex at the sarcolemma. This result could indeed be the case because, as part of the current study, we have observed that expression of utrophin A in mdx mouse muscle is fiber type-specific. In support of this finding, it is important to note also that slow muscles from the mdx mouse contain more utrophin than fast muscles (for example, ref. 51). As expected on the basis of the foregoing discussion, mdx EDL muscles are known to be more sensitive to the effects of eccentric contractions than soleus muscles (52). Importantly, this greater sensitivity of mdx EDL fibers to mechanical stress is rescued on transgenic expression of utrophin in fast muscles (53). Together, these observations suggest that utrophin A may therefore play a protective role in slower, oxidative fibers from DMD patients.
The reduction in utrophin A expression after calcineurin inhibition with cyclosporine is troubling particularly because previous studies have used calcineurin-inhibiting immunosuppressants in various therapeutic strategies for DMD. Based on our findings, it seems that the use of these calcineurin inhibitors could somewhat mask any beneficial effects linked to particular DMD therapies. Finally, the identification of calcineurin and NFAT as signaling molecules involved in controlling utrophin A expression in muscle provides a unique opportunity to design pharmacological interventions aimed at increasing the endogenous levels of utrophin in muscle fibers from DMD patients.
Acknowledgments
We thank Dr. D. J. Parry for assistance with the single-fiber experiments, Dr. M. Jones for the Western blot, Dr. R. S. Williams for assistance with generating CnA* mice, and C. Humphries and L. Brosseau for breeding and maintaining these lines. The utrophin-deficient mice were kindly provided by Dr. J. R. Sanes. This work was supported by grants from the Canadian Institutes of Health Research (to B.J.J. and R.N.M.), the Muscular Dystrophy Association (to B.J.J. and L.A.M.), Association Française contre les Myopathies (to B.J.J.), and the Natural Sciences and Engineering Research Council of Canada (to R.N.M.). J.V.C. is supported by a studentship from the Ontario Graduate Scholarship Program. L.A.M. is a Canadian Institutes of Health Research New Investigator and B.J.J. is a Canadian Institutes of Health Research Investigator.
Abbreviations: CnA*, constitutively active form of calcineurin; CsA, cyclosporine A; DMD, Duchenne muscular dystrophy; EDL, extensor digitorum longus; MyHC, myosin heavy chain; CAT, chloramphenicol acetyltransferase; EMSA, electrophoretic mobility-shift assay; NFAT, nuclear factor of activated T cells.
References
- 1.Krag, T. O., Gyrd-Hansen, M. & Khurana, T. S. (2001) Acta Physiol. Scand. 171, 349-358. [DOI] [PubMed] [Google Scholar]
- 2.Blake, D. J., Weir, A., Newey, S. E. & Davies, K. E. (2002) Physiol. Rev. 82, 291-329. [DOI] [PubMed] [Google Scholar]
- 3.Jasmin, B. J., Angus, L. M., Belanger, G., Chakkalakal, J. V., Gramolini, A. O., Lunde, J. A., Stocksley, M. A. & Thompson, J. (2002) J. Physiol. (Paris) 96, 31-42. [DOI] [PubMed] [Google Scholar]
- 4.Gramolini, A. O. & Jasmin, B. J. (1999) Nucleic Acids Res. 27, 3603-3609. [DOI] [PMC free article] [PubMed] [Google Scholar]
- 5.Jasmin, B. J., Alameddine, H., Lunde, J. A., Stetzkowski-Marden, F., Collin, H., Tinsley, J. M., Davies, K. E., Tome, F. M., Parry, D. J. & Cartaud, J. (1995) FEBS Lett. 374, 393-398. [DOI] [PubMed] [Google Scholar]
- 6.Helliwell, T. R., Man, N. T., Morris, G. E. & Davies, K. E. (1992) Neuromuscul. Disord. 2, 177-184. [DOI] [PubMed] [Google Scholar]
- 7.Lin, S., Gaschen, F. & Burgunder, J. M. (1998) J. Neuropathol. Exp. Neurol. 57, 780-790. [DOI] [PubMed] [Google Scholar]
- 8.Gramolini, A. O., Dennis, C. L., Tinsley, J. M., Robertson, G. S., Cartaud, J., Davies, K. E. & Jasmin, B. J. (1997) J. Biol. Chem. 272, 8117-8120. [DOI] [PubMed] [Google Scholar]
- 9.Gramolini, A. O., Burton, E. A., Tinsley, J. M., Ferns, M. J., Cartaud, A., Cartaud, J., Davies, K. E., Lunde, J. A. & Jasmin, B. J. (1998) J. Biol. Chem. 273, 736-743. [DOI] [PubMed] [Google Scholar]
- 10.Gramolini, A. O., Angus, L. M., Schaeffer, L., Burton, E. A., Tinsley, J. M., Davies, K. E., Changeux, J. P. & Jasmin, B. J. (1999) Proc. Natl. Acad. Sci. USA 96, 3223-3227. [DOI] [PMC free article] [PubMed] [Google Scholar]
- 11.Galvagni, F., Capo, S. & Oliviero, S. (2001) J. Mol. Biol. 306, 985-996. [DOI] [PubMed] [Google Scholar]
- 12.Galvagni, F., Cantini, M. & Oliviero, S. (2002) J. Biol. Chem. 277, 19106-19113. [DOI] [PubMed] [Google Scholar]
- 13.Gyrd-Hansen, M., Krag, T. O., Rosmarin, A. G. & Khurana, T. S. (2002) J. Neurol. Sci. 197, 27-35. [DOI] [PubMed] [Google Scholar]
- 14.Khurana, T. S., Rosmarin, A. G., Shang, J., Krag, T. O., Das, S. & Gammeltoft, S. (1999) Mol. Biol. Cell 10, 2075-2086. [DOI] [PMC free article] [PubMed] [Google Scholar]
- 15.Perkins, K. J., Burton, E. A. & Davies, K. E. (2001) Nucleic Acids Res. 29, 4843-4850. [DOI] [PMC free article] [PubMed] [Google Scholar]
- 16.Burton, E. A., Tinsley, J. M., Holzfeind, P. J., Rodrigues, N. R. & Davies, K. E. (1999) Proc. Natl. Acad. Sci. USA 96, 14025-14030. [DOI] [PMC free article] [PubMed] [Google Scholar]
- 17.Gramolini, A. O., Belanger, G., Thompson, J. M., Chakkalakal, J. V. & Jasmin, B. J. (2001) Am. J. Physiol. 281, C1300-C1309. [DOI] [PubMed] [Google Scholar]
- 18.Webster, C., Silberstein, L., Hays, A. P. & Blau, H. M. (1988) Cell 52, 503-513. [DOI] [PubMed] [Google Scholar]
- 19.Dunn, S. E. & Michel, R. N. (1997) Am. J. Physiol. 273, C371-C383. [DOI] [PubMed] [Google Scholar]
- 20.Dunn, S. E., Burns, J. L. & Michel, R. N. (1999) J. Biol. Chem. 274, 21908-21912. [DOI] [PubMed] [Google Scholar]
- 21.Dunn, S. E., Chin, E. R. & Michel, R. N. (2000) J. Cell Biol. 151, 663-672. [DOI] [PMC free article] [PubMed] [Google Scholar]
- 22.Schiaffino, S., Gorza, L., Sartore, S., Saggin, L., Ausoni, S., Vianello, M., Gundersen, K. & Lomo, T. (1989) J. Muscle Res. Cell Motil. 10, 197-205. [DOI] [PubMed] [Google Scholar]
- 23.Kandarian, S. C., Peters, D. G., Taylor, J. A. & Williams, J. H. (1994) Am. J. Physiol. 266, C1190-C1197. [DOI] [PubMed] [Google Scholar]
- 24.Rosenblatt, J. D., Lunt, A. I., Parry, D. J. & Partridge, T. A. (1995) In Vitro Cell Dev. Biol. Anim. 31, 773-779. [DOI] [PubMed] [Google Scholar]
- 25.O'Keefe, S. J., Tamura, J., Kincaid, R. L., Tocci, M. J. & O'Neill, E. A. (1992) Nature 357, 692-694. [DOI] [PubMed] [Google Scholar]
- 26.Chin, E. R., Olson, E. N., Richardson, J. A., Yang, Q., Humphries, C., Shelton, J. M., Wu, H., Zhu, W., Bassel-Duby, R. & Williams, R. S. (1998) Genes Dev. 12, 2499-2509. [DOI] [PMC free article] [PubMed] [Google Scholar]
- 27.Pan, S., Koyano-Nakagawa, N., Tsuruta, L., Amasaki, Y., Yokota, T., Mori, S., Arai, N. & Arai, K. (1997) Biochem. Biophys. Res. Commun. 240, 314-323. [DOI] [PubMed] [Google Scholar]
- 28.Angus, L. M., Chan, R. Y. & Jasmin, B. J. (2001) J. Biol. Chem. 276, 17603-17609. [DOI] [PubMed] [Google Scholar]
- 29.Goblet, C. & Whalen, R. G. (1995) Dev. Biol. 170, 262-273. [DOI] [PubMed] [Google Scholar]
- 30.Michel, R. N., Vu, C. Q., Tetzlaff, W. & Jasmin, B. J. (1994) J. Cell Biol. 127, 1061-1069. [DOI] [PMC free article] [PubMed] [Google Scholar]
- 31.Weir, A. P., Burton, E. A., Harrod, G. & Davies, K. E. (2002) J. Biol. Chem. 277, 45285-45290. [DOI] [PubMed] [Google Scholar]
- 32.Bigard, X., Sanchez, H., Zoll, J., Mateo, P., Rousseau, V., Veksler, V. & Ventura-Clapier, R. (2000) J. Biol. Chem. 275, 19653-19660. [DOI] [PubMed] [Google Scholar]
- 33.Lin, J., Wu, H., Tarr, P. T., Zhang, C. Y., Wu, Z., Boss, O., Michael, L. F., Puigserver, P., Isotani, E., Olson, E. N., et al. (2002) Nature 418, 797-801. [DOI] [PubMed] [Google Scholar]
- 34.Naya, F. J., Mercer, B., Shelton, J., Richardson, J. A., Williams, R. S. & Olson, E. N. (2000) J. Biol. Chem. 275, 4545-4548. [DOI] [PubMed] [Google Scholar]
- 35.Olson, E. N. & Williams, R. S. (2000) Bioessays 22, 510-519.10842305 [Google Scholar]
- 36.Allen, D. L. & Leinwand, L. A. (2002) J. Biol. Chem. 277, 45323-45330. [DOI] [PubMed] [Google Scholar]
- 37.Serrano, A. L., Murgia, M., Pallafacchina, G., Calabria, E., Coniglio, P., Lomo, T. & Schiaffino, S. (2001) Proc. Natl. Acad. Sci. USA 98, 13108-13113. [DOI] [PMC free article] [PubMed] [Google Scholar]
- 38.Quandt, K., Frech, K., Karas, H., Wingender, E. & Werner, T. (1995) Nucleic Acids Res. 23, 4878-4884. [DOI] [PMC free article] [PubMed] [Google Scholar]
- 39.Pette, D. & Staron, R. S. (1997) Int. Rev. Cytol. 170, 143-223. [DOI] [PubMed] [Google Scholar]
- 40.Schiaffino, S. & Reggiani, C. (1996) Physiol. Rev. 76, 371-423. [DOI] [PubMed] [Google Scholar]
- 41.Jasmin, B. J., Campbell, R. J. & Michel, R. N. (1995) J. Physiol (London) 484, 155-164. [DOI] [PMC free article] [PubMed] [Google Scholar]
- 42.Berchtold, M. W., Brinkmeier, H. & Muntener, M. (2000) Physiol. Rev. 80, 1215-1265. [DOI] [PubMed] [Google Scholar]
- 43.Dunn, S. E., Simard, A. R., Bassel-Duby, R., Williams, R. S. & Michel, R. N. (2001) J. Biol. Chem. 276, 45243-45254. [DOI] [PubMed] [Google Scholar]
- 44.Liu, Y., Cseresnyes, Z., Randall, W. R. & Schneider, M. F. (2001) J. Cell Biol. 155, 27-39. [DOI] [PMC free article] [PubMed] [Google Scholar]
- 45.Biring, M. S., Fournier, M., Ross, D. J. & Lewis, M. I. (1998) J. Appl. Physiol. 84, 1967-1975. [DOI] [PubMed] [Google Scholar]
- 46.Wu, H., Rothermel, B., Kanatous, S., Rosenberg, P., Naya, F. J., Shelton, J. M., Hutcheson, K. A., DiMaio, J. M., Olson, E. N., Bassel-Duby, R., et al. (2001) EMBO J. 20, 6414-6423. [DOI] [PMC free article] [PubMed] [Google Scholar]
- 47.Kubis, H. P., Scheibe, R. J., Meissner, J. D., Hornung, G. & Gros, G. (2002) J. Physiol (London) 541, 835-847. [DOI] [PMC free article] [PubMed] [Google Scholar]
- 48.Rybakova, I. N., Patel, J. R., Davies, K. E., Yurchenco, P. D. & Ervasti, J. M. (2002) Mol. Biol. Cell 13, 1512-1521. [DOI] [PMC free article] [PubMed] [Google Scholar]
- 49.Ort, T., Voronov, S., Guo, J., Zawalich, K., Froehner, S. C., Zawalich, W. & Solimena, M. (2001) EMBO J. 20, 4013-4023. [DOI] [PMC free article] [PubMed] [Google Scholar]
- 50.Pedemonte, M., Sandri, C., Schiaffino, S. & Minetti, C. (1999) Biochem. Biophys. Res. Commun. 255, 466-469. [DOI] [PubMed] [Google Scholar]
- 51.Pons, F., Robert, A., Marini, J. F. & Léger, J. J. (1994) J. Neurol. Sci., 122, 162-170. [DOI] [PubMed] [Google Scholar]
- 52.Moens, P., Baatsen, P. H. W. W. & Maréchal, G. (1993) J. Muscle Res. Cell Motil. 14, 447-451. [DOI] [PubMed] [Google Scholar]
- 53.Tinsley, J. M., Deconnick, N., Fisher, R., Kahn, D., Phelps, S., Gillis, J. M. & Davies, K. E. (1998) Nat. Med. 4, 1441-1444. [DOI] [PubMed] [Google Scholar]


