

Abstract
The pyruvate dehydrogenase multienzyme complexes are among the largest multifunctional catalytic machines in cells, catalyzing the production of acetyl CoA from pyruvate. We have previously reported the molecular architecture of an 11-MDa subcomplex comprising the 60-mer icosahedral dihydrolipoyl acetyltransferase (E2) decorated with 60 copies of the heterotetrameric (α2β2) 153-kDa pyruvate decarboxylase (E1) from Bacillus stearothermophilus (Milne, J. L. S., Shi, D., Rosenthal, P. B., Sunshine, J. S., Domingo, G. J., Wu, X., Brooks, B. R., Perham, R. N., Henderson, R., and Subramaniam, S. (2002) EMBO J. 21, 5587–5598). An annular gap of ~90 Å separates the acetyltransferase catalytic domains of the E2 from an outer shell formed of E1 tetramers. Using cryoelectron microscopy, we present here a three-dimensional reconstruction of the E2 core decorated with 60 copies of the homodimeric 100-kDa dihydrolipoyl dehydrogenase (E3). The E2E3 complex has a similar annular gap of ~75 Å between the inner icosahedral assembly of acetyltransferase domains and the outer shell of E3 homodimers. Automated fitting of the E3 coordinates into the map suggests excellent correspondence between the density of the outer shell map and the positions of the two best fitting orientations of E3. As in the case of E1 in the E1E2 complex, the central 2-fold axis of the E3 homodimer is roughly oriented along the periphery of the shell, making the active sites of the enzyme accessible from the annular gap between the E2 core and the outer shell. The similarities in architecture of the E1E2 and E2E3 complexes indicate fundamental similarities in the mechanism of active site coupling involved in the two key stages requiring motion of the swinging lipoyl domain across the annular gap, namely the synthesis of acetyl CoA and regeneration of the dithiolane ring of the lipoyl domain.
The pyruvate dehydrogenase (PDH)2 multienzyme complexes play a central role in cellular metabolism, catalyzing the oxidative decarboxylation of pyruvate to acetyl CoA, to link glycolysis and the tricarboxylic acid cycle. Of key medical importance in several metabolic disorders (1, 2), the chemistry of this multicomponent enzyme assembly has been extensively studied (3–5). Detailed structures of individual enzymes or their subdomains have been elucidated using x-ray crystallographic and NMR techniques (Ref. 5 and references therein and Refs. 6 and 7), whereas cryoelectron microscopic analyses have begun to illuminate the overall molecular architecture of PDH complexes from eukaryotes (8–11) and bacteria (12–14). These systems are ideal paradigms for the structural study of highly dynamic macromolecular machines because they mediate efficient transport of reaction intermediates between the active sites of component enzymes that can be spatially separated by as much as 100 Å (10, 14).
PDH complexes based on icosahedral symmetry are among the largest of cellular machines and are found in the mitochondria of eukaryotes and in Gram-positive bacteria such as Bacillus stearothermophilus. These complexes, like the octahedral PDH complexes present in Gram-negative bacteria, contain a dihydrolipoyl acetyltransferase (E2), a pyruvate decarboxylase (E1), a dihydrolipoyl dehydrogenase (E3), and, in the case of the mammalian enzymes, an E3-binding protein and regulatory kinases and phosphatases (reviewed in Ref. 5). The E2 component of the B. stearothermophilus PDH complex, characteristically of the family, is composed of a 28-kDa catalytic (acetyltransferase) domain, a 4-kDa peripheral subunit-binding domain (PSBD), and a 9-kDa lipoyl domain (15–18), which are connected by long stretches of polypeptide chain thought be largely flexible in conformation (3–5). In the native PDH complex, 60 copies of the E2 self-associate through the interactions of their catalytic domains to form an icosahedral assembly, to which 42–48 copies of an α2β2 E1 (153 kDa) and 6–12 copies of a homodimeric E3 (100 kDa) bind tightly around the outside (19). Biochemical and structural evidence indicates that E1 and E3 bind competitively to mutually exclusive, but partly overlapping, sites on the PSBD (20–24).
During the synthesis of acetyl CoA, E1 catalyzes the thiamine diphosphate-dependent decarboxylation of pyruvate and the reductive acetylation of a lipoyl group attached to a specific lysine residue in the lipoyl domain of the E2 component. The E1 active site (specifically the thiazole ring of the thiamine diphosphate cofactor) is located at the bottom of a funnel-shaped cleft ~20-Å deep (Ref. 7 and references therein and Ref. 25). The lipoyl domain must then migrate to the active site in the acetyltransferase domain of E2 where the acetyl group is transferred to CoA, and finally to the active site of E3 where the pendant dihydrolipoyl group is oxidized at the expense of NAD+ to regenerate its dithiolane ring, preparing it to re-enter the active site of E1 to initiate a new cycle of catalytic events (4, 5).
Cryoelectron microscopy studies of a fully assembled E1E2 PDH sub-complex from B. stearothermophilus reveal the general architecture as an inner core of 60 E2 acetyltransferase domains surrounded by an outer shell of 60 E1 tetramers, characterized by an annular gap as wide as ~90 Å (14). The orientation of the E1 tetramers is such that the E1 active sites can be accessed efficiently from the annular space by lipoyl domains that are clearly required to move back and forth across the annular gap. This unexpectedly organized architecture could promote highly efficient active site coupling by confining the trajectories of the lipoyl domains as they shuttle between the successive active sites. A somewhat similar architecture has been reported for the PDH complexes from bovine kidney (10) and Saccharomyces cerevisiae (11).
Here, we extend our previous studies with the report of the architecture of a 1:1 stoichiometric complex containing 60 copies each of the E2 and E3 enzymes. We present a cryoelectron microscopic analysis of the reconstructed three-dimensional structure of the purified E2E3 complex and use automated docking methods to interpret the density map in terms of the probable localization of the E2 and E3 molecules. Our findings show that the arrangement of E1 and E3 molecules in the outer shell of the pyruvate dehydrogenase complex are remarkably similar and indicate that the design of the annular gap allows the lipoyl domain to have access to the active sites of E1, E2, and E3 enzymes from within the annular gap.
EXPERIMENTAL PROCEDURES
Sample Preparation
E2E3 complexes containing 60 copies of full-length E2 dihydrolipoyl acetyltransferase and 60 copies of the E3 dihydrolipoyl dehydrogenase homodimer were prepared as described (26) by individually expressing the full-length recombinant genes in Escherichia coli and purifying the protein products, which were then reconstituted together in a 1:1 stoichiometric ratio and isolated from unbound E3 by size exclusion chromatography. Aliquots of the complex at ~2 mg/ml were frozen in liquid nitrogen and stored at −80 °C until use.
Electron Microscopy
Frozen hydrated specimens of E2E3 were obtained by applying 5 μl of 200–300 μg of protein/ml to homemade holey carbon grids, blotting for typically 2–5 s at room temperature, and plunging into a slurry of liquid ethane using a manually operated cryoplunge apparatus. Images were collected under cryo conditions on a FEI Tecnai 30 microscope operating at 300 kV on film, using an electron dose of 10 electrons/Å2, a nominal magnification of 39,000× and under-focus values of 3.0–4.0 μm. Film images were assessed for quality using an optical diffractometer, and those displaying negligible astigmatism and minimal drift were scanned on a flat-bed Zeiss SCAI scanner using a pixel step size of 7 μm. Under-focus values for film images were computationally determined using algorithms implemented in the MRC image processing package (27).
Construction of a Three-dimensional Model of E2E3
A set of 6054 molecular images the E2E3 complex was manually selected using Xim-disp (28) from 74 films binned 2-fold to give a final pixel size of 3.59 Å pixel at the level of the specimen. The boxed images (210 × 210 pixels) were filtered to retain information between 200 and 30 Å and used to construct an initial three-dimensional model using the image processing package IMAGIC (29) in multiple rounds of iterative alignment and classification, essentially as described for the E1E2 subcomplex (14). To obtain representative classes with a range of orientations that had both low internal variance and that corresponded well to the projections of the resultant three-dimensional model, images were grouped into subgroups that contained images extracted from classes of ~2-fold, 3-fold, or 5-fold symmetry or from two other distinct views of the complex. Each subgroup was processed individually to identify appropriate class averages. These class averages were used as references for the entire data set for multi-reference alignment, which then was partitioned to identify class average views. Following determination of the Eulerian angles between pairs of the most representative class average projections using angular reconstitution with imposed icosahedral symmetry and refinement of these angles, the oriented class averages with the lowest error in the angular parameters were used to calculate a three-dimensional model. A set of 172 reprojections from the model that uniformly sampled the icosahedral asymmetric triangle were calculated and used for multireference alignment of the data set, which was followed by classification, Euler angle determination and refinement, and calculation of a new three-dimensional map. These steps were repeated three more times to generate the three-dimensional map that was refined using the complete data set and the program FREALIGN (30), which determines the orientation and center of individual particles, corrects for the contrast transfer function of each input image, and calculates a three-dimensional reconstruction. The map and images were padded to create a box size of 256, binned 2 × 2, and alignment was performed using data between 200 and 25 Å. The map was reconstructed to include Fourier components up to 15 Å using a B-factor of 3000 Å2. Docking of the coordinates for the E3 homodimer from B. stearothermophilus complexed to the E2 PSBD (Ref. 21, Protein Data Bank entry 1EBD) was performed using a core-weighted Monte Carlo grid-searching algorithm as described previously (31). Briefly, the coordinates of the Cα atoms of the E3·PSBD complex were used to generate a density map at 25 Å resolution using the Gaussian blurring procedure implemented in the program CHARMM (32). A grid of 3 × 3 × 3 × 3 × 3 × 3 in six-dimensional translational and rotational space was then used to initiate 729 Monte Carlo searches, each of 1000 steps, to identify local maximum positions. Estimation of the relative contributions of the two best fit positions of E3 to the overall density map was determined by calculating the density correlation between the experimentally determined map and a series of theoretically generated maps in which the proportion of the two contributing fitted positions was progressively varied. Visualization of maps was performed either in the environment of the program O (33) using the associated program Molray (34), or using the program VMD (35).
RESULTS
A three-dimensional model of the fully occupied E2E3 subcomplex was constructed from 6054 individual molecular images computationally selected from cryoelectron micrographs, which contained well separated and randomly oriented complexes that are considerably larger and more intricate (Fig. 1, A and B) than those formed by the undecorated E2 core alone (14). Inspection of the three-dimensional model shows that the complex is ~450 Å across. Representative class average images correspond well to projection views both of the original filtered particles and of the initial reconstruction generated using IMAGIC (29) (Fig. 1, B–D). Refinement of this model using FREALIGN (30) sharpened features of the central icosahedral feature arising from the E2 catalytic core more than the outer E3 densities, suggesting a greater degree of disorder in the outer protein shell of the complex (Fig. 1E). A very similar situation occurs in the E1E2 complex, with greater disorder observed in the outer shell of E1 tetramers. A surface representation of the structure is shown in Fig. 2A. A central slice through the model (Fig. 2B) indicates the presence of the central E2 catalytic core, the outer shell of E3 enzymes, and an annular gap as wide as ~75 Å between the core and the outer shell.
FIGURE 1.
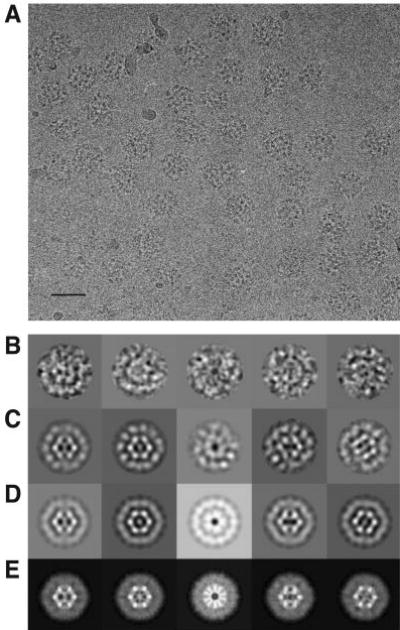
A, a representative micrograph recorded at 300 kV from a frozen hydrated specimen of the fully occupied E2E3 complex. The scale bar equals 500 Å. B, gallery of molecular images of the E2E3 complex after filtering to suppress noise and inverting the density as an initial correction for the effects of the microscope contrast transfer function. Class-averaged views (C) of the set of images, two-dimensional projections (D) of the initial model, and two-dimensional projections (E) of the refined three-dimensional model, each shown in about the same orientation as seen in the molecular images in A.
FIGURE 2.
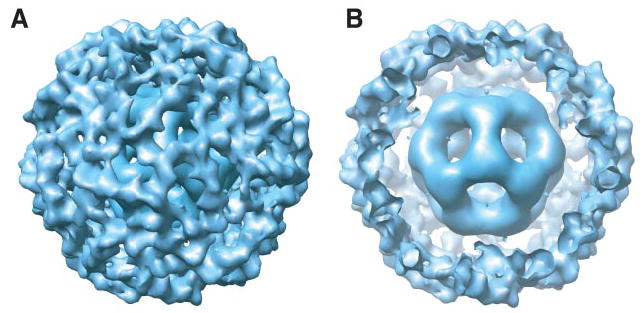
A, surface representation of the refined three-dimensional model of E2E3 viewed along a 3-fold axis of symmetry. B, the same representation with a portion of the outer protein shell removed to aid visualization of the inner E2 core. Both panels were generated using the program Chimera (43).
Evidence that the density map shown in Fig. 2 results from molecular images with a broad range of orientations is presented in Fig. 3A. Inspection of the distribution of the 6054 images in the icosahedral asymmetric triangle demonstrates that they are uniformly distributed throughout the entire angular space, thus eliminating the potential of sampling or orientation bias in selection of particles used to construct the map. A plot of the resolution dependence of the correlation coefficient between two maps constructed from two randomly divided halves of the data is shown in Fig. 3B. The correlation coefficient falls to 0.5 at ~27 Å, which we denote as the nominal resolution (36) of the map presented here, even though the plot indicates that there is significant information in the map well beyond this resolution. The nominal resolution of the map obtained for the E2E3 complex is about the same as that previously obtained for the E1E2 complex (14).
FIGURE 3.

A, angular distribution of the 6054 molecular images represented within the icosahedral asymmetric triangle. Each point represents the angular parameters derived by the refinement procedure of the projection calculated from the reference density map that has the highest correspondence to the experimentally observed projection image. The 2-fold apex (oval), the 3-fold apex (triangle), and the 5-fold apices (pentagons) correspond to angular values for φ and θ of 0° and 90°, 0° and 69.1°, 31.8° and 90°, and −31.8° and 90°, respectively. B, plot of the Fourier shell correlation (triangles) and the corresponding Fourier shell phase residual (circles) at different resolutions. The values in the plot reflect the resolution-dependence of the agreement between two halves of the set of 6054 molecular images used to construct the refined model. The resolution (~27 Å) at which the Fourier shell correlation drops to 0.5, and the Fourier shell phase residual increases to 45° is taken to represent the resolution limit of the reconstruction.
The atomic coordinates of the B. stearothermophilus E3 homodimer bound to the PSBD of E2 were automatically fitted using a grid-threading Monte Carlo approach into the density map. As described previously (31), the identification of the best fits involves a search in six-dimensional space. The search resulted in two clearly defined best fit positions with very similar values (0.738 and 0.724) for correlation coefficients (Fig. 4A). A section of the landscape showing these peaks is shown as a contour plot (Fig. 4B). The positions of these two fits, viewed from the 3-fold vertex, is shown in Fig. 5, A and B. Taken together, these two fits occupy most regions of the space defined by the outer shell of the density map. Inspection of a central section of the map clearly shows the annular gap and the locations of E3 dimers in the two best fit orientations (Fig. 5, C and D). In both positions, the orientation of each E3 dimer is such that the 2-fold axis lies roughly along the surface of the outer shell. In this orientation, the PSBD faces the annular gap, and the active site of the E3 enzyme is easily accessible to the lipoyl domain located in the gap between the outer shell and the catalytic core, in the same way as previously discussed for the E1 enzyme in the E1E2 complex (14). It is important to note that the identification of the best fits assumes that all 60 copies are in one or the other preferred position. A more realistic interpretation of these results is that they represent the two most likely locations of a given E3 dimer at any given time. We have derived a quantitative estimate of the relative probabilities by calculating the density correlation between the experimentally determined map and a series of theoretically generated maps in which the proportion of the two contributing fitted positions was systematically varied (Fig. 4C). The peak correlation is observed with fractional occupancies of 0.33 from the first best fit (Fig. 5, A and C) and 0.67 from the second best fit (Fig. 5, B and D), respectively. We therefore conclude that on average, each E3 dimer is likely to spend about twice as long in the second best than in the first best fit. This is not a surprising result because the core-weighted correlation coefficients for the two fits are very similar and also because the value may be influenced to some extent by the overall relative E3 proximities in the entire complex, which are different in the two positions (Fig. 5, compare A with B).
FIGURE 4.
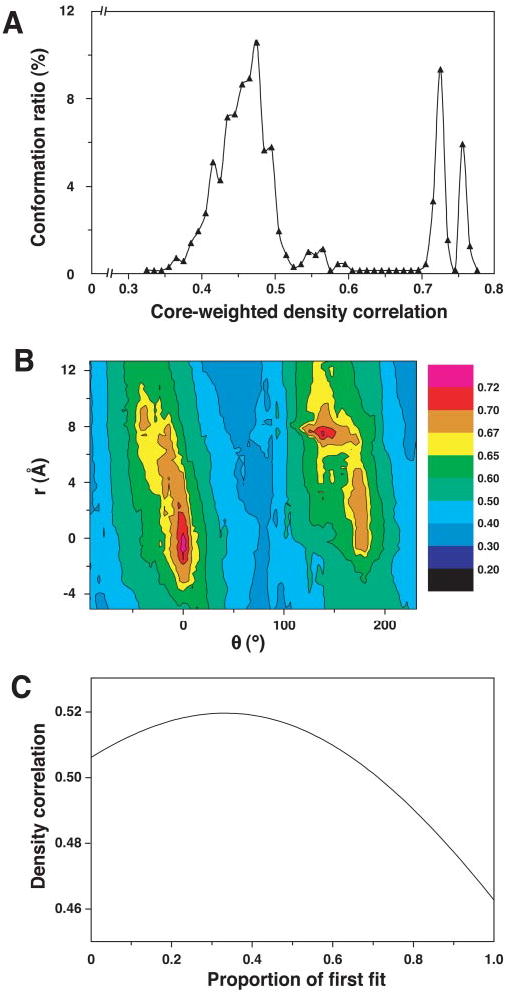
A, core-weighted density distribution of the 729 local maximums obtained from fitting the homodimeric E3·PSBD complex to the density of the E2E3 map using an automated Monte Carlo search performed as described under “Experimental Procedures.” B, contour plot of the core-weighted correlation function describing the locations of the two best fits of the homodimeric E3·PSBD complex, which are represented by the peaks with correlation values above 0.7. The spatial translation in x, y, z (r) and angular rotation (φ) from the best fit (global minimum) to the second best fit is indicated. C, plot describing the variation in correlation coefficients with change in relative proportion of the occupancies of the two best fit orientations. The fractional occupancy of the best fit was varied from 0 to 1 in increments of 0.01.
FIGURE 5. Superposition of the atomic coordinates of the homodimeric E3·PSBD complex into the E2E3 density map generated by electron microscopy (blue mesh).

Visualization of the map from the 3-fold axis sectioned to include density contributed by only one layer of the outer E3 protein shell (A and C) or the central section of density from the E2 core and the E3 protein shell (B and D). The complementary locations of the E3·PSBD complex present in the best fitting (A and C) and second-best fitting (B and D) orientations identified by the core-weighted Monte Carlo search are illustrated. The E3 dimers and PSBD are represented as red and black ribbons, respectively. For visual clarity, a thicker ribbon is used to represent the PSBD.
Because the overall sizes of the E2E3 and E1E2 subcomplexes are similar (450 and 475 Å, respectively), one might expect the E3 homodimers (100 kDa) to occupy a smaller proportion of the surface area of the outer shell in comparison to the E1 tetramers (153 kDa) in the E1E2 complex (14). Inspection of the fitted coordinates in Fig. 5 confirms this expectation. A simulated model (Fig. 6) of a native complex with 50 copies of the E1 tetramer and 10 copies of the E3 dimer, shows that even at this maximal occupancy of the outer shell, there are no steric constraints that prevent the placement of the E1 and E3 enzymes in the outer shell at the locations deduced form the fitted coordinates. A schematic view of a single E1 trimer and a single E3 trimer positioned above the E2 core is presented in Fig. 7 to illustrate both the similarities in the location of E1 and E3 relative to the core and to highlight the point that the extended reach of the lipoyl domain is likely to allow access of a given domain to the active sites of multiple enzymes in the outer shell.
FIGURE 6.

A, atomic representation of a hypothetical native PDH complex consisting of 50 E1 heterotetramers and 10 E3 dimers randomly distributed around the central E2 core. The Protein Data Bank coordinates for E1 (1QS0), E3 complexed to the PSBD (1EBD), and E2 catalytic domain (1B5S) were used. Positions of the E1 heterotetramer (purple) are based on the best fit orientation as described in Ref. 14 and also represent the fit that has a higher occupancy evaluated using the criterion (X. Wu, J. L. S. Milne, and S. Subramaniam, unpublished observations) shown in Fig. 4C. Positions of the E3 homodimer complexed with the E2 PSBDs (yellow) are based on the fit shown in Fig. 5B, which represents the fit with the higher E3 occupancy. Positions of the E2 catalytic domain (gray) were generated by application of icosahedral symmetry to the coordinates of the monomer derived by x-ray crystallography (17).
FIGURE 7. Model for active-site coupling in a hypothetical E1E2E3 complex.

Three E1 tetramers (purple) and three E3 dimers (yellow) are shown located in the outer protein shell above the inner icosahedron (gray) formed by 60 E2 catalytic domains. Six full-length E2 molecules are highlighted in red, green, or yellow, to illustrate in each the catalytic domain, PSBD, and lipoyl domain that are separated by interdomain linkers. The E1 and E3 densities are shown as separate trimers to facilitate comparison; under physiological conditions, the E1 and E3 molecules are expected to be randomly distributed around the core. The inner linkers are shown to originate from the region of the density map that is near residue 204, as deduced from the map derived using cryoelectron microscopy by Borgnia et al. (44). The lipoyl domains are shown in a range of possible positions inside the annular gap. Selected active sites of E1, E2, and E3 are depicted in white. The lipoyl domain of each E2 molecule is expected to shuttle between the active sites of E3 and E1 molecules located in the outer shell and those of E2 located in the inner core and are long enough to reach across one trimer in the outer shell to another, as indicated schematically.
DISCUSSION
The PDH complex of B. stearothermophilus self-assembles from a mixture of E1 heterotetramers and E3 dimers in the presence of the icosahedrally symmetric core formed by 60 E2 polypeptide chains. Typically a complex of ~42–48 E1 heterotetramers and 6–12 E3 dimers around one 60-mer E2 can be generated, but these values represent averages and the precise E1:E2:E3 stoichiometry is likely to vary from one complex to another (19). E1 and E3 both bind tightly to the PSBD of the E2 chain (Kds of 0.33 and 0.58 nM, respectively) (37), but the binding is mutually exclusive, and the distribution of these components about the E2 core is thus likely to have a major element of randomness to it. This intrinsic heterogeneity restricts the utility of approaches that involve averaging the structure of individual PDH complex assemblies that contain all of the constituent enzymes.
A key finding from the cryoelectron microscopic analysis of fully assembled E1E2 (14) and E2E3 subcomplexes is that the E1 and E3 components are located as well defined radial shells with a clear gap of 75–90 Å separating them from the icosahedral inner core constructed of 60 E2 acetyltransferase domains (Figs. 2 and 5 and Ref. 14). The gap in the E2E3 subcomplex appears to be slightly smaller than that in the E1E2 subcomplex but that may be because of differences in the overall shapes of the E3-PSBD (21) and E1-PSBD (7) structures. Three sections of the E2 polypeptide must be located in this gap, although none of them makes any apparent contribution to the density map: the N-terminal lipoyl domain, which shuttles between the catalytic core and the outer shell, the linker region connecting the lipoyl domain to the binding domain, and the linker region connecting the binding domain to the catalytic core domain.
The structural mechanisms that contribute to the presence of the gap and maintain the size of the E1E2 and E2E3 subcomplexes and native PDH complexes are not yet clear. One possibility is that steric interactions between neighboring molecules reduce the possibility of large inward movements of the E1 tetramers and/or of the E3 dimers. It also seems plausible that the extended inner linker region (approximately between Ala167 and Gly204 may play a critical role in determining the distance of closest approach between the catalytic domain and the bound E1 and E3 enzyme complexes. No apparent secondary structure was detected in this stretch of amino acids by the program PredictProtein (38), although all of the known secondary structure elements of E2 were correctly determined (data not shown). However, most of the X-Pro peptide bonds present in the inner linker appear to occupy the all-trans rather than cis configuration (39), which could provide a certain level of rigidity to the chain of amino acids. Inspection of the structure of the assembled E2 core of 60 acetyltransferase domains (17) suggests that the Gly204 residues of each of the three monomers that constitute a trimer at each vertex of the icosahedral core are separated by 42 Å, and the Gly204 residues in adjacent trimers are even further apart, making it unlikely that neighboring linker regions can form close associations to form a higher order structure. Further work by means of NMR spectroscopy and other techniques will be needed to analyze the structure and mechanistic relevance of the linker region in more detail.
The architecture of the B. stearothermophilus PDH complex is likely to be broadly similar to that of the icosahedral PDH complexes of its eukaryotic counterparts. Thus cryoelectron microscopy of the PDH complex from bovine kidney (10) and S. cerevisiae (11) indicates that the E1 components form a radial shell ~50 Å above the central E2 core, although it is reported in the former paper that a high occupancy of the E1 binding sites can lead to an extension of the linker region from 50 to ~75 Å. Moreover, in these complexes, the E3 homodimers are bound to the E2 core by association with an additional component, an E3-binding protein. This appears to lead to the E3 being more intimately associated with the inner E2 core in the openings on the 12 5-fold faces of the dodecahedron (8, 10). Other cryoelectron microscopic (9) and biochemical studies (40) indicate a more exterior positioning of the E3 in the mammalian PDH complex. Thus, while following the same general pattern, the molecular architecture of PDH complexes from different sources may differ in detail.
We had previously suggested that the presence of a high surface concentration of the E1 heterotetramers limits the search space required for active site coupling, by allowing the lipoyl domain to shuttle back and forth across and within the gap between the E1 and E2 active sites (14). A complete turnover of the complex requires the successive participation of an E1, E2, and E3 active site working on a given lipoyl domain. Given the high ratio (~4–8:1) of E1 to E3 in the assembled B. stearothermophilus PDH complex (19), and the apparently random placement of E1 and E3 over the surface of E2, it would clearly be desirable for the lipoyl domain to easily access the more limited number of E3 active sites. The positioning of E3 in an annular shell at about the same level as E1, rather than outside of the E1 protein layer, and with active sites accessible from the annular gap, is therefore likely to be important for the effective regeneration of the lipoyl moiety (Fig. 5). The lack of E1 and E3 protein density in the annular gap could also facilitate movement of the lipoyl domain that may have to sweep through considerable annular space before reaching an available E3 homodimer, especially in native PDH complexes with only a few E3 enzymes per complex. An individual lipoyl domain is predicted to migrate up to 140 Å away from its PSBD given the ~50 amino acid linker that separates the two domains (14). In a native PDH complex, this movement would enable it to interact with at least nine peripherally bound enzymes. A hypothetical model of a native pyruvate dehydrogenase complex containing 60 E2, 50 E1, and 10 E3 (Fig. 6) positioned about the E2 core using the best fitting coordinates derived from models of the E1E2 (14) and E2E3 subcomplexes (Fig. 5) indicates that there are no apparent steric constraints that might prevent the formation of such a complex. The arrangement of the enzymes is consistent with the hypothesis that the lipoyl domain primarily resides and functions inside the annular gap.
The possibility that the movement of the lipoyl domain is not completely free but instead may occur via constrained trajectories has been suggested previously (41, 42). Inspection of the outer surface of the icosahedral inner core of E2 reveals it to be predominantly positively charged, with a ring of positive charges near the entrance to each active site. In contrast, the lipoyl domain is predominantly negatively charged. Although the lysine residue to which the lipoyl group is attached is positively charged, this charge is neutralized by the amide bond formation that occurs upon attachment of the terminal amino group to the lipoyl domain. Thus, the movement of the lipoyl domain may not be random and could be guided, in part, by simple electrostatic interactions in the interior of this elegant molecular machine.
Acknowledgments
We thank Dr. Gonzalo Domingo (Seattle Biomedical Research Institute, Seattle, WA) for preparation of the E2E3 PDH subcomplex and Donald Bliss and Alan Hoofring (Medical Arts and Photography Branch, NIH) for generating the illustration depicted in Fig. 7.
Footnotes
This research was supported by grants from the Center for Cancer Research at the NCI, National Institutes of Health (to J. L. S. M. and S. S.).
The abbreviations used are: PDH, pyruvate dehydrogenase; E1, pyruvate decarboxylase; E2, dihydrolipoyl acetyltransferase; E3, dihydrolipoyl dehydrogenase; PSBD, peripheral subunit-binding domain.
References
- 1.Patel MS, Harris RA. FASEB J. 1995;9:1164–1172. doi: 10.1096/fasebj.9.12.7672509. [DOI] [PubMed] [Google Scholar]
- 2.Yeaman SJ, Kirby JA, Jones DEJ. Immunol Rev. 2000;174:238–249. doi: 10.1034/j.1600-0528.2002.00021h.x. [DOI] [PubMed] [Google Scholar]
- 3.Reed LJ, Hackert ML. J Biol Chem. 1990;265:8971–8974. [PubMed] [Google Scholar]
- 4.Perham RN. Biochemistry. 1991;30:8501–8512. doi: 10.1021/bi00099a001. [DOI] [PubMed] [Google Scholar]
- 5.Perham RN. Annu Rev Biochem. 2000;69:961–1004. doi: 10.1146/annurev.biochem.69.1.961. [DOI] [PubMed] [Google Scholar]
- 6.Arjunan P, Nemeria N, Brunskill A, Chandrasekhar K, Sax M, Yan Y, Jordan F, Guest JR, Furey W. Biochemistry. 2002;41:5213–5221. doi: 10.1021/bi0118557. [DOI] [PubMed] [Google Scholar]
- 7.Frank RA, Titman CM, Pratap JV, Luisi BF, Perham RN. Science. 2004;306:872–876. doi: 10.1126/science.1101030. [DOI] [PubMed] [Google Scholar]
- 8.Stoops JK, Cheng RH, Yazdi MA, Maaeng CY, Schroeter JP, Klueppelberg U, Kolodziej SJ, Baker TS, Reed LJ. J Biol Chem. 1997;272:5757–5764. doi: 10.1074/jbc.272.9.5757. [DOI] [PMC free article] [PubMed] [Google Scholar]
- 9.Wagenknecht T, Grassucci R, Radke GA, Roche TE. J Biol Chem. 1991;266:24650–24656. [PubMed] [Google Scholar]
- 10.Zhou ZH, McCarthy DB, O’Conner CM, Reed LJ, Stoops JK. Proc Natl Acad Sci U S A. 2001;98:14802–14807. doi: 10.1073/pnas.011597698. [DOI] [PMC free article] [PubMed] [Google Scholar]
- 11.Gu Y, Zhou ZH, McCarthy DB, Reed LJ, Stoops JK. Proc Natl Acad Sci U S A. 2003;100:7015–7020. doi: 10.1073/pnas.0732060100. [DOI] [PMC free article] [PubMed] [Google Scholar]
- 12.Wagenknecht T, Grassucci R, Schaak D. J Biol Chem. 1990;265:22402–22408. [PubMed] [Google Scholar]
- 13.Wagenknecht T, Grassucci R, Berkowitz J, Forneris C. J Struct Biol. 1992;109:70–77. doi: 10.1016/1047-8477(92)90069-m. [DOI] [PubMed] [Google Scholar]
- 14.Milne JLS, Shi D, Rosenthal PB, Sunshine JS, Domingo GJ, Wu X, Brooks BR, Perham RN, Henderson R, Subramaniam S. EMBO J. 2002;21:5587–5598. doi: 10.1093/emboj/cdf574. [DOI] [PMC free article] [PubMed] [Google Scholar]
- 15.Dardel F, Davis AL, Laue ED, Perham RN. J Mol Biol. 1993;229:1037–1048. doi: 10.1006/jmbi.1993.1103. [DOI] [PubMed] [Google Scholar]
- 16.Kalia YN, Brocklehurst SM, Hipps DS, Appella E, Sakaguchi K, Perham RN. J Mol Biol. 1993;230:323–341. doi: 10.1006/jmbi.1993.1145. [DOI] [PubMed] [Google Scholar]
- 17.Izard T, Ævarsson A, Allen MD, Westphal AH, Perham RN, de Kok A, Hol WGJ. Proc Natl Acad Sci U S A. 1999;96:1240–1245. doi: 10.1073/pnas.96.4.1240. [DOI] [PMC free article] [PubMed] [Google Scholar]
- 18.Allen MD, Broadhurst RW, Solomon RG, Perham RN. FEBS J. 2005;272:259–268. doi: 10.1111/j.1432-1033.2004.04405.x. [DOI] [PubMed] [Google Scholar]
- 19.Domingo GJ, Chauhan HJ, Lessard IAD, Fuller C, Perham RN. Eur J Biochem. 1999;266:1136–1146. doi: 10.1046/j.1432-1327.1999.00966.x. [DOI] [PubMed] [Google Scholar]
- 20.Lessard IAD, Perham RN. Biochem J. 1995;306:727–733. doi: 10.1042/bj3060727. [DOI] [PMC free article] [PubMed] [Google Scholar]
- 21.Mande SS, Sarfaty S, Allen MD, Perham RN, Hol WGJ. Structure. 1996;4:277–286. doi: 10.1016/s0969-2126(96)00032-9. [DOI] [PubMed] [Google Scholar]
- 22.Jung HI, Perham RN. FEBS Lett. 2003;555:405–410. doi: 10.1016/s0014-5793(03)01245-6. [DOI] [PubMed] [Google Scholar]
- 23.Jung HI, Cooper A, Perham RN. Eur J Biochem. 2003;270:4488–4496. doi: 10.1046/j.1432-1033.2003.03842.x. [DOI] [PubMed] [Google Scholar]
- 24.Frank RAW, Pratap JV, Pei XY, Perham RN, Luisi BF. Structure. 2005;13:1119–1130. doi: 10.1016/j.str.2005.04.021. [DOI] [PubMed] [Google Scholar]
- 25.Ævarsson A, Seger K, Turley S, Sokatch JR, Hol WGJ. Nat Struct Biol. 1999;6:785–792. doi: 10.1038/11563. [DOI] [PubMed] [Google Scholar]
- 26.Lessard IAD, Domingo GJ, Borges A, Perham RN. Eur J Biochem. 1998;258:491–501. doi: 10.1046/j.1432-1327.1998.2580491.x. [DOI] [PubMed] [Google Scholar]
- 27.Crowther RA, Henderson R, Smith JM. J Struct Biol. 1996;116:9–16. doi: 10.1006/jsbi.1996.0003. [DOI] [PubMed] [Google Scholar]
- 28.Smith JM. J Struct Biol. 1999;125:223–228. doi: 10.1006/jsbi.1998.4073. [DOI] [PubMed] [Google Scholar]
- 29.van Heel M, Harauz G, Orlova EV, Schmidt R, Schatz M. J Struct Biol. 1996;116:17–24. doi: 10.1006/jsbi.1996.0004. [DOI] [PubMed] [Google Scholar]
- 30.Grigorieff N. J Mol Biol. 1998;277:1033–1046. doi: 10.1006/jmbi.1998.1668. [DOI] [PubMed] [Google Scholar]
- 31.Wu X, Milne JLS, Borgnia MJ, Rostapshov AV, Subramaniam S, Brooks BR. J Struct Biol. 2003;141:63–76. doi: 10.1016/s1047-8477(02)00570-1. [DOI] [PMC free article] [PubMed] [Google Scholar]
- 32.Brooks BR, Bruccoleri RE, Olafson BD, States DJ, Swaminathan S, Jaun B, Karplus M. J Comput Chem. 1983;4:187–217. [Google Scholar]
- 33.Jones TA, Zou JY, Cowan SW, Kjeldgaard M. Acta Crystallog Sect A. 1991;47:110–119. doi: 10.1107/s0108767390010224. [DOI] [PubMed] [Google Scholar]
- 34.Harris M, Jones TA. Acta Crystallogr D Biol Crystallogr. 2001;57:1201–1203. doi: 10.1107/s0907444901007697. [DOI] [PubMed] [Google Scholar]
- 35.Humphrey W, Dalke A, Schulten K. J Mol Graph. 1996;14:33–38. doi: 10.1016/0263-7855(96)00018-5. [DOI] [PubMed] [Google Scholar]
- 36.van Heel M. Ultramicroscopy. 1987;21:95–100. doi: 10.1016/0304-3991(87)90078-7. [DOI] [PubMed] [Google Scholar]
- 37.Lessard IAD, Fuller C, Perham RN. Biochemistry. 1996;35:16863–16870. doi: 10.1021/bi961683r. [DOI] [PubMed] [Google Scholar]
- 38.Rost B. Methods Enzymol. 1996;266:525–539. doi: 10.1016/s0076-6879(96)66033-9. [DOI] [PubMed] [Google Scholar]
- 39.Radford SE, Laue ED, Perham RN, Martin SR, Appella E. J Biol Chem. 1989;264:767–775. [PubMed] [Google Scholar]
- 40.Hiromasa Y, Fujisawa T, Aso Y, Roche TE. J Biol Chem. 2004;279:6921–6933. doi: 10.1074/jbc.M308172200. [DOI] [PubMed] [Google Scholar]
- 41.Chauhan HJ, Domingo GJ, Jung HI, Perham RN. Eur J Biochem. 2000;267:7158–7169. doi: 10.1046/j.1432-1327.2000.01820.x. [DOI] [PubMed] [Google Scholar]
- 42.Fries M, Chauhan HJ, Domingo GJ, Jung HI, Perham RN. Eur J Biochem. 2003;270:861–870. doi: 10.1046/j.1432-1033.2003.03444.x. [DOI] [PubMed] [Google Scholar]
- 43.Pettersen EF, Goddard TD, Huang CC, Couch GS, Greenblatt DM, Meng EC, Ferrin TE. J Comput Chem. 2004;25:1605–1612. doi: 10.1002/jcc.20084. [DOI] [PubMed] [Google Scholar]
- 44.Borgnia MJ, Shi D, Zhang P, Milne JLS. J Struct Biol. 2004;147:136–145. doi: 10.1016/j.jsb.2004.02.007. [DOI] [PubMed] [Google Scholar]