Abstract
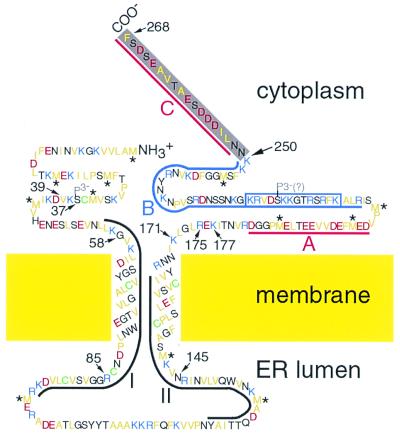
The 30-kDa movement protein (MP) is essential for cell–cell spread of tobacco mosaic virus in planta. To explore the structural properties of MP, the full-length recombinant MP gene was expressed in Escherichia coli, and one-step purification from solubilized inclusion bodies was accomplished by using anion exchange chromatography. Soluble MP was maintained at >4 mg/ml without aggregation and displayed ≈70% α-helical conformation in the presence of urea and SDS. A trypsin-resistant core domain of the MP had tightly folded tertiary structure, whereas 18 aa at the C terminus of the monomer were rapidly removed by trypsin. Two hydrophobic regions within the core were highly resistant to proteolysis. Based on results of CD spectroscopy, trypsin treatment, and MS, we propose a topological model in which MP has two putative α-helical transmembrane domains and a protease-sensitive carboxyl terminus.
The plus-sense, 6.4-kb single-stranded (ss) RNA genome of tobacco mosaic virus (TMV) encodes a 17.5-kDa coat protein, a 30-kDa movement protein (MP), and proteins of 126 kDa and 183 kDa that function in virus replication (1). The MP is essential for cell–cell spread of infection (2, 3).
Many proteins, including several plant virus movement proteins (3), are associated with intracellular and intercellular channels that permit passage of water, ions, metabolites, and signaling molecules into and between cells and cell compartments. Prokaryotic examples include porins (4), potassium channels (5), and aquaporins (6). Eukaryotic examples include aquaporins (7), gap junctions (8), translocation channels of the endoplasmic reticulum (ER; ref. 9), nuclear pore complexes (10), ryanodine receptors (11), and the acetylcholine receptor (12). In higher plants, the channels that mediate intercellular communication are termed plasmodesmata (3). Plasmodesmata allow passive transport of proteins of at least 50 kDa in young tobacco leaf tissues, but the size exclusion limit decreases as these tissues mature (13). TMV infection results in a temporary increase in the size exclusion limit of plasmodesmata from ≈0.4 kDa to ≈20 kDa in mature leaf epidermis and mesophyll tissues (14). Although the MP is required for this dramatic and transient increase in intercellular permeability, the mechanisms responsible are unclear (3).
Many viruses replicate in association with ER membranes, and some viruses associate with the cytoskeleton of the host (15–22). MP behaves as an intrinsic membrane protein, promotes the formation of ER aggregates, and probably facilitates establishment of TMV replication complexes that contain viral RNA, replicase, and MP (16, 20, 22–24). Many recombinant viral MPs expressed in Escherchia coli bind ss nucleic acids in vitro without nucleotide sequence specificity (25–29). Thus, it was proposed that the MP functions as an intracellular and intercellular carrier of TMV RNA, at least in part by association with the cytoskeleton and ER membranes (15–17, 22).
Recombinant viral MPs typically form insoluble inclusion bodies (25, 27–31). To facilitate biochemical and biophysical characterization of the TMV MP, we developed an improved protocol that resulted in high yields of isolated inclusion bodies. A one-step chromatographic procedure provided pure, soluble protein. Based on results of CD spectroscopy, trypsin treatment, and MS, we propose that the MP is a polytopic, α-helical membrane protein.
Materials and Methods
Isolation of MP Inclusion Bodies.
A cDNA encoding the MP was cloned into the NdeI and BamHI sites of plasmid pET3a, which was transformed into E. coli BL21(DE3)pLysE (E. coli pET3MP). The cDNA sequence agreed with nucleotides 4903–5868 of the TMV U1 strain (32). MP was expressed in E. coli pET3MP as described (25); 25 μg/ml chloramphenicol also was included in the culture medium. After expression, cultures were chilled on water-slush (0°C) and centrifuged at 8,000 g for 10 min at 2°C.
In some experiments, MP inclusion bodies were isolated as described (25). In most experiments, pelleted materials from 100-ml cultures were resuspended at 0°C in 5 ml of 50 mM Tris (pH 8.0), 5 mM EDTA, 10 mM NaCl, with protease inhibitors (2 mM PMSF, 1.4 μg/ml pepstatin A, 2 μg/ml aprotinin, and 1 μg/ml leupeptin). Bacteria were frozen in liquid nitrogen, stored at −70°C, thawed, sonicated at 0°C, and frozen in liquid nitrogen. Thawing, sonication, and freezing were repeated twice. DNaseI [BRL (750 units; EC 3.1.21.1; ref. 33)], MgCl2 (to 5 mM) and additional protease inhibitors (to double the concentration) were added and the cell lysate was incubated at 0°C for 30 min. Some soluble material was separated from the inclusion bodies by centrifugation at 2°C for 30 min at 13,000 g. The pellet was resuspended by sonication at 0°C in 5 ml of 20 mM Na2HPO4 (pH 7.2), 20 mM NaCl, 5 mM EDTA, 25% (wt/vol) sucrose, 1% (vol/vol) Triton X-100, including protease inhibitors (above). After incubation for 10 min at 0°C, additional soluble contaminants were removed by centrifugation at 2°C for 10 min at 25,000 g. Sonication and centrifugation were repeated twice to further improve the purity of the inclusion bodies. The inclusion body pellet was washed by resuspension via sonication in 2 ml of 10 mM Tris (pH 8.0), 4 M urea and incubation at 70°C for 10 min. After centrifugation at 4°C for 30 min at 15,000 g, the final pellets were solubilized at 22°C by sonication in 1–2 ml of TNEM8MU buffer (10 mM Tris, pH 9.0/500 mM NaCl/5 mM EDTA, 1 mM 2-mercaptoethanol/8 M urea).
Purification, Solubilization, and Concentration of MP.
The solubilized inclusion bodies were dialyzed against chromatography buffer (10 mM Tris, pH 9.0/8 M urea, 5 mM EDTA/150 mM NaCl/1 mM 2-mercaptoethanol), and aggregated material was removed by centrifugation at 22°C for 30 min at 15,000 g. The supernatant was applied to a HQ/M anion exchange column on a BioCAD Perfusion Chromatography Workstation (PerSeptive Biosystems, Framingham, MA). The column was eluted with a linear salt gradient from 0.15 to 1.15 M NaCl by mixing chromatography buffer with 3 M NaCl, and 1-ml fractions were collected. Pooled fractions from P1 and P2 (see Fig. 2A) were dialyzed against buffer L (10 mM Tris, pH 8.0/200 mM NaCl/1 mM EDTA/10% glycerol/1 mM DTT/1 mM PMSF) (25) at 4°C. Precipitated material was collected by centrifugation at 2°C for 30 min at 25,000 g. Pellets were resuspended in TNEM8MU buffer at 22°C. Protein concentrations were estimated by comparison with BSA standards in SDS/PAGE.
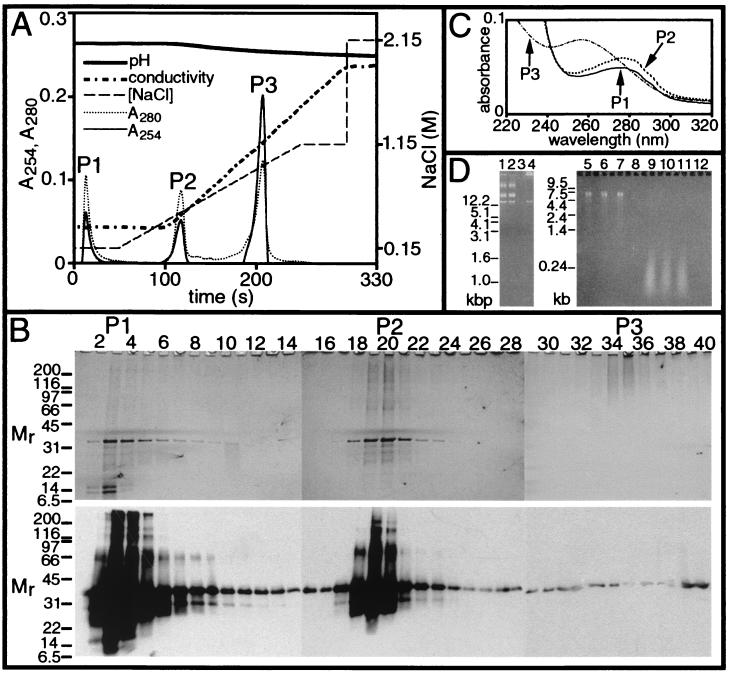
Figure 2.
Purification and characterization of recombinant MP. (A) Anion exchange chromatography. Conductivity, 13.2–71.4 mS; pH, 8.73–9.24. P1, P2, and P3, peaks 1, 2, and 3. (B) Chromatographic fractions 1–40. (Upper) Silver-stained SDS/PAGE gels; (Lower) Western blots detecting MP. Unheated samples were subjected to SDS/PAGE; Mr as in Fig. 1. (C) Absorption spectra of P1, P2, and P3. (D) Nuclease digestion. Ethidium bromide-stained 1% Tris/borate/EDTA (lanes 1–4) and 1.5% formaldehyde-agarose (lanes 5–12) gels. Lanes 1–4: pET3MP DNA; in DNaseI buffer only (lane 1), or RNaseA buffer only (lane 2); in buffer with DNaseI (lane 3), or RNaseA (lane 4). Lanes 5–8: TMV RNA; in DNaseI buffer only (lane 5), or RNaseA buffer only (lane 6); with DNaseI (lane 7), or RNaseA (lane 8). Lanes 9–12: concentrated P3; in DNaseI buffer only (lane 9), or RNaseA buffer only (lane 10); with DNaseI (lane 11), or RNaseA (lane 12). Standards, in kbp (DNA; Left) and kb (RNA; Right).
P1 and P2, in TNEM8MU, were dialyzed against TNETMG buffer [50 mM Tris, pH 9.0/700 mM NaCl/1 mM EDTA/1% (vol/vol) Tween 20/10 mM 2-mercaptoethanol/10% (vol/vol) glycerol] containing 8 M urea at 22°C. The concentration of urea then was halved about every 6 h (at 4°C), by adding an equal volume of cold TNETMG to the dialysis buffer, until the urea concentration was 62 mM. Samples were dialyzed at 4°C against TNETMG to remove urea and subjected to centrifugation at 4°C for 15 min at 15,000 g (low speed), and the supernatant was subjected to centrifugation at 4°C for 1 h at 100,000 g (high speed).
In other experiments, P1 and P2 (see Fig. 2A) were dialyzed at 22°C against buffers listed in Results. TNEM2MU was identical to TNEM8MU, other than containing 2 M urea. MP was concentrated by ultrafiltration using Centricon filters with a molecular mass cutoff of 10 kDa (Amicon).
Nucleic Acid Analysis.
Nucleic acids were concentrated by ethanol precipitation, resuspended in Tris-EDTA buffer (10 mM Tris, pH 8.0/1 mM EDTA, pH 8.0), and quantified by A260 (34). Digestions were for 1 h at 22°C by using either 0.3 μg of DNaseI in DNaseI buffer or 0.3 μg of RNaseA (GIBCO/BRL; EC 3.1.27.5; ref. 33) in 10 mM sodium acetate, pH 5.2. Controls lacking nuclease were in DNaseI buffer or 10 mM sodium acetate, pH 5.2.
Electrophoresis and Western Immunoblotting.
Electrophoresis of DNA and RNA was performed according to standard procedures using agarose gels (34). Polyacrylamide gels were stained with Coomassie brilliant blue R250 (Coomassie; ref. 34) or with silver (Silver-Stain Plus; Bio-Rad). Proteins electrotransferred to nitrocellulose were incubated at 22°C for 0.5 h in Tris-buffered saline–Tween 20 (34), blocked for 1 h in Blotto (10 mM Tris⋅HCl, pH 7.5/150 mM NaCl/0.05% Tween 20/2% nonfat dry milk) (34), and incubated in Blotto for 2–4 h with polyclonal antibodies against MP (24) at 1 μg/ml. Membranes were washed at 22°C in Tris-buffered saline–Tween 20, incubated with goat anti-rabbit IgG-horseradish peroxidase (Bio-Rad) for 1–2 h, washed again, and visualized by chemiluminescence (ECL, Amersham Pharmacia).
UV Absorption and CD Spectroscopy.
Samples were dialyzed against 0.1% SDS for absorption spectroscopy. CD spectra were recorded from samples maintained at 25°C in a 1-mm path length quartz cell (Helma Kuvetten, Nulheim, Germany) by using an Aviv 202 SF spectropolarimeter (Aviv Associates, Lakewood, NJ). CD spectra of five scans, in increments of 0.5 nm, were collected from 185–250 nm (samples in SDS), 195–250 nm (samples in TNETMG), and 205–250 nm (samples in TNEM2MU + 0.1% SDS). Absorption by urea, SDS, and NaCl precluded measurements below these wavelengths. Averaged spectra of buffers were subtracted from averaged spectra of samples, and data were converted to mean residue ellipticity. Estimates of secondary structure content were performed by a linear least-squares fit to basis spectra (35).
Trypsin Digestion and MS.
A 40-μl aliquot of MP in TNETMG, at 0.5 mg/ml (17 μM), was digested with 20 ng of modified trypsin (Promega) at 22°C. Samples (4 μl) were collected between 5 min and 480 min. Reactions were stopped by adding 1 μl of 100 mM PMSF, 3 μl of 3× SDS/PAGE sample buffer (34), and 24 μl of 1× SDS/PAGE sample buffer. Similar reactions were carried out on nondigested samples after 480 min. Samples were subjected to SDS/PAGE on duplicate gels. One gel was silver-stained and the other was used for Western blot analysis.
For MS, MP in TNETMG (20 μl at 0.5 mg/ml) was incubated with modified trypsin (1 μl at 0.1 mg/ml) for 10 min at 22°C. A 10-μl aliquot of 3× SDS/PAGE sample buffer was added, and samples were immediately boiled, subjected to SDS/PAGE, and stained with Coomassie. Gel slices containing protein were subjected to in-gel digestion as described (http://masspec.scripps.edu/proteo2.html). Matrix-assisted laser desorption/ionization-time of flight MS was performed by using an α-cyano matrix, on a Voyager-DE STR Biospectrometry Workshop (PerSeptive Biosystems). Peptides were mapped to the MP sequence by using the paws program (http://www.proteometrics.com/). The predicted molecular mass and isoelectric point of proteins were calculated by using the expasy tool (http://www.expasy.ch/tools/pi_tool.html).
Results
An Improved Protocol Yields Large Amounts of MP from E. coli.
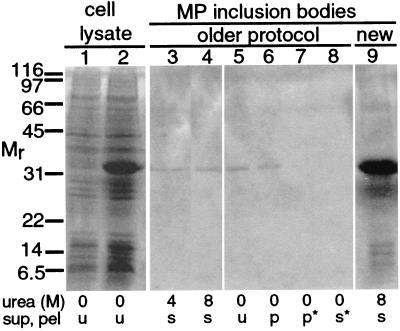
To obtain MP for biochemical and biophysical analysis, the recombinant MP gene was expressed in E. coli. After MP gene induction, cell extracts displayed a prominent band with an apparent molecular mass (Mr) of 32 kDa (Fig. 1, lane 2). Inclusion bodies isolated by using a previous protocol (25) also displayed a band of 32 kDa (Fig. 1, lanes 3 and 5). Some protein was soluble in buffer containing 4 M urea, and additional protein was solubilized in 8 M urea (Fig. 1, lanes 3 and 4). In contrast to a previous report (25), we found that protein from inclusion bodies was not soluble in their buffer L (Fig. 1, lanes 5–8).
Figure 1.
SDS/PAGE of inclusion bodies from E. coli pET3MP. Labeling below the gels indicates the concentration of urea and the sample identity as unfractionated (u), supernatant (sup; s), or pellet (pel; p). * indicate a high-speed pellet or high-speed supernatant. Lanes 1 and 2 contain whole-cell lysates before and after MP gene induction in E. coli pET3MP, respectively. Lanes 3–8, inclusion bodies isolated by using a previous protocol (ref. 25; labeled older). Lane 3, soluble in buffer L with 4 M urea (25). Lane 4, insoluble in buffer L with 4 M urea but soluble in buffer L with 8 M urea. Lane 5, material from lane 3 in buffer L without urea (25). Lanes 6–8, sample from lane 5 fractionated via centrifugation; lane 6, low-speed (15,000 g) pellet; lane 7, high-speed (100,000 g) pellet; lane 8, high-speed supernatant. Lane 9, inclusion bodies isolated by using the protocol described in this paper (labeled new). SDS/PAGE gels were stained with Coomassie. Molecular mass standards (Mr) in kDa. Lanes 1 and 2 were from one gel, and lanes 3–9 were from another gel. The order of lanes 3 and 4 was changed for clarity.
The isolation procedure was modified as described in Materials and Methods, yielding 2–4 mg of inclusion bodies per 100 ml of culture (Fig. 1, lane 9), which was 5- to 10-fold greater than the previous protocol (25). The most prominent band on SDS/PAGE gels had an Mr of 32 kDa. Proteins displaying slower and more rapid mobility also were detected. Proteins with a similar range of mobilities were detected in concentrated samples of inclusion bodies isolated by the previous protocol (25).
Inclusion Bodies Contain MP and ssRNA.
High pressure (≈1,200 psi) anion exchange chromatography of solubilized inclusion bodies in buffer containing 8 M urea provided a one-step purification procedure. Elution profiles displayed three peaks, labeled P1, P2, and P3 (Fig. 2A). P1 contained flow-through material, whereas P2 and P3 eluted with increasing NaCl concentration. The elution profile of inclusion bodies isolated by the previous protocol (25) was similar to that in Fig. 2A (not shown).
Silver-stained gels and Western blots showed that P1 (fractions 2–8) and P2 (fractions 18–23) contained highly purified MP that migrated as oligomers, full-length monomers, and smaller fragments (Fig. 2B). In contrast, P3 (fractions 33–37) contained small amounts of MP and additional material that exhibited lower mobility. Because proteins and nucleic acids are stained by reactions with silver, SDS/PAGE gels were stained with ethidium bromide to detect nucleic acids; only P3 contained detectable nucleic acid (not shown).
Absorption spectroscopy was used to further characterize the contents of P1, P2, and P3. Absorption spectra of P1 and P2 displayed maxima at 272–278 nm and minima at 250–256 nm (Fig. 2C). These spectra were similar to the spectrum of purified BSA (not shown), suggesting that P1 and P2 contained highly purified protein. The spectrum of P3 was intermediate between spectra of RNA and protein, being more similar to RNA, with a maximum at 254–258 nm and a minimum at 240–244 nm (Fig. 2C). Absorption spectra of P1, P2, and P3 from inclusion bodies isolated according to the previous protocol (25) were similar to those in Fig. 2C, indicating that these inclusion bodies also contained MP and nucleic acids (not shown).
To identify the nucleic acids in P3, samples were treated with DNaseI or RNaseA. As controls, pET3MP DNA and TMV RNA were specifically degraded by DNaseI and RNaseA, respectively (Fig. 2D, lanes 1–8). Nucleic acid in P3 was degraded by RNaseA (Fig. 2D, lane 12), whereas DNaseI had no effect (Fig. 2D, lane 11). Nuclease digestion of P3 from inclusion bodies isolated by the previous protocol (25) yielded similar results (not shown). The ssRNA was <0.24 kb to ≈0.9 kb (Fig. 2D, lanes 9–11). The mean wt/wt ratio of MP/RNA in inclusion bodies was 12.5:1, with a SD of 0.95.
Soluble MP Has Primarily α-Helical Structure in Low Concentrations of Urea and SDS.
Because purified MP precipitated in buffer L, it was collected by centrifugation, resuspended in TNEM8MU buffer, and gradually dialyzed into TNETMG buffer. The concentration of soluble MP in the 100,000 g supernatant was ≈1 mg/ml for P1 and ≈0.5 mg/ml for P2. SDS/PAGE gels containing soluble MP in TNETMG displayed oligomeric and monomeric protein bands (not shown).
When MP was concentrated by ultrafiltration, it precipitated in TNETMG at concentrations exceeding ≈1 mg/ml. In 0.1% SDS, chromatography buffer, and TNEM8MU, the protein remained soluble, but displayed some aggregation. Soluble MP was essentially monodisperse at >4 mg/ml in buffer containing 8, 4, or 2 M urea plus 0.1% SDS and remained soluble in these buffers at concentrations exceeding 20 mg/ml (not shown).
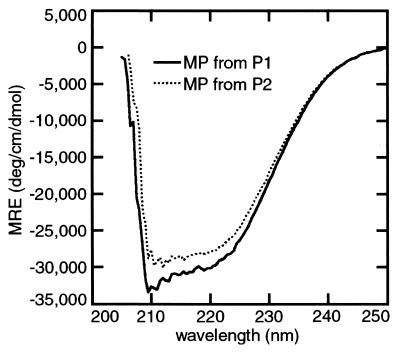
Having found conditions to maintain MP solubility, we used CD spectroscopy to estimate secondary structure (35). The CD spectrum of soluble MP in TNETMG had a minimum at 208 nm and a shoulder at 222 nm, suggesting α-helical structure. In 0.1% and 5.0% SDS, CD spectra were similar to those in TNETMG. However, there were more distinct minima at 208 nm and 222 nm in SDS than in TNETMG (not shown). In TNEM2MU plus 0.1% SDS, CD spectra of MP from P1 predicted ≈66% α-helix, ≈18% β-turn, and ≈16% β-sheet structure (Fig. 3). MP from P2 was estimated to contain ≈77% α-helix and ≈21% β-turn structure.
Figure 3.
CD spectroscopy of solubilized MP in the presence of urea and SDS indicated high α-helical content. The MP concentration was 17 μM, in TNEM2MU + 0.1% SDS. MRE, mean residue ellipticity.
MP Has a Trypsin-Resistant Core that Contains Two Putative Transmembrane Domains.
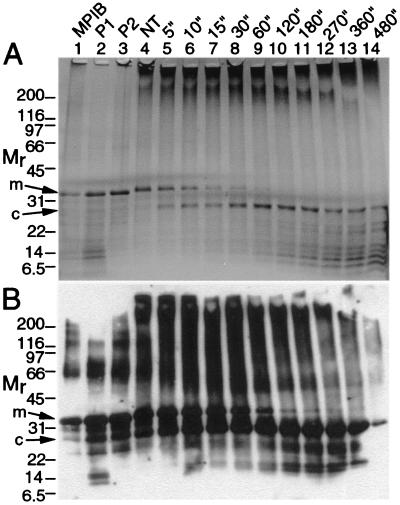
The high α-helical content of MP suggested that the solubilized protein possessed ordered tertiary structure. We elected to subject MP to proteolysis to qualitatively assess tertiary structure, as sites in unstructured regions are susceptible to cleavage, whereas sites in folded domains are relatively resistant to cleavage (6). MP was treated with trypsin, because MP is rich in lysine (K) and arginine (R) residues, which are trypsin-cleavage sites. MP was rapidly degraded to a polypeptide, with an Mr of ≈25 kDa, that we term a core (c) domain (Fig. 4). Western blots using antibodies against amino acid residues 209–222 showed that MP oligomers, full-length monomers (m), the core, and smaller fragments of MP were reactive. Although the peptide that was used to produce the antibodies (amino acid residues 209–222) contains seven R and K residues, the reactive peptide was degraded only after extended digestion (Fig. 4B).
Figure 4.
SDS/PAGE (A) and Western blots (B) of MP incubated with trypsin showed that a core domain resists cleavage. Lanes 1, MP inclusion bodies (MPIB) in TNEM8MU buffer. Lanes 2, P1, and lanes 3, P2 (see Fig. 2A). Lanes 4–14, MP from P2 in TNETMG buffer. Lanes 4, control incubation, no trypsin (NT). Lanes 5–14 were incubated with trypsin for the indicated times, in min. Mr as in Fig. 1; m, monomer; c, core. Ponceau-S staining showed even transfer of proteins to membranes. Trypsin (<2 ng per lane) was not detected in the gels.
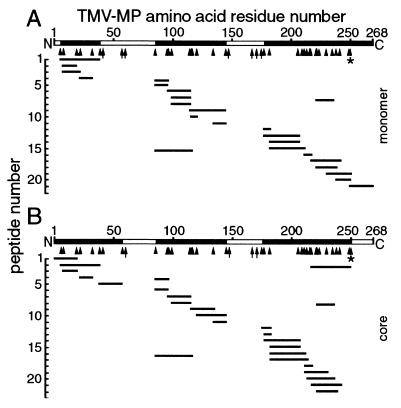
The monomer and trypsin-resistant core of the MP (Fig. 4) were excised from gels and subjected to overnight trypsin digestion, and MS was used to identify the resulting peptides. The molecular masses of peptides were within ±6.1 Da of the masses predicted by the MP sequence. Peptides from the MP monomer and core spanned most of the MP sequence, but not all potential trypsin sites were digested (Fig. 5). Two hydrophobic regions that are predicted to contain transmembrane domains (24) were rarely detected. We propose that these hydrophobic, putative transmembrane domains were buried within SDS micelles, which likely impeded digestion by trypsin and detection by MS (J. Wu, personal communication).
Figure 5.
MS of the full-length MP monomer (A) and core domain (B; Fig. 4). Molecular masses of peptides (short lines) generated by extensive trypsin digestion matched the predicted masses deduced from the MP sequence. Two hydrophobic peptides containing putative transmembrane domains (residues 39 or 58–85, and 145–175; open bars) were rarely detected. The core (B) was generated by release of residues 250–268 from the C terminus (open bar) by cleavage at highly sensitive K residues (*). Other K and R residues were more resistant to cleavage (arrowheads) and some were not cleaved (arrows). In some experiments, residues 1–6 of the monomer (A) were detected. The profiles are representative of MP from P1 and were similar for P2.
The C terminus of the MP, i.e., amino acid residues 250–268, was absent from the core (Fig. 5), suggesting that K 249 and K 250 were highly sensitive to trypsin (Figs. 4–6). The trypsin-resistant core contained 250 aa with a predicted molecular mass of 28,080 Da and a predicted isoelectric point of 9.42. These results suggest that the C-terminal 18 amino acid residues of the MP are highly accessible to the solvent, whereas the trypsin-resistant core has a tightly folded, well-ordered, three-dimensional structure.
Figure 6.
Topological model of the TMV MP. The amino acid sequence was deduced from the ORF encoding the MP (32). Hydrophobic amino acid residues are yellow, basic residues are blue, acidic residues are red, and Cys residues are green. The trypsin-resistant core domain contains the first 249 or 250 residues, including the peptide (boxed) that was used to produce MP antibodies used in Figs. 2B and 5B. The C terminus (gray) was rapidly removed by trypsin. As previously defined (36), domains I (residues 56–96) and II (residues 125–164) are regions that are conserved among tobamovirus MPs and are outlined in black; domains A (residues 183–200) and C (residues 252–268) are acidic and are outlined in red; and domain B (residues 206–250) is basic and is outlined in blue. Cytoplasmic, transmembrane, ER luminal, and core domains were inferred from Western blots of proteinase K-treated microsomes, hydropathy analysis, fluorescence microscopy (16, 20, 22, 24), trypsin susceptibility, and MS. Transmembrane domains are presumed to be α-helical. Hydrophobic peptides (39–85 vs. 58–85) differed in length between the monomer and the core (Fig. 5), suggesting that the C terminus of the monomer may interact with its N terminus. Serine-37 is phosphorylated (P3-; ref. 37), and S 218 may be phosphorylated (P3-?) based on Prosite prediction and sequence conservation among tobamovirus MPs (not shown). Met residues (*) have been reported to generally be involved in protein–protein interactions (38).
Discussion
When produced in E. coli, TMV MP accumulates in inclusion bodies (25). Our studies showed that the inclusion bodies contain ssRNA. The inclusion bodies are solubilized in buffers containing urea, but when the urea is removed, aggregation recurs to create precipitates that contain protein/RNA complexes (Figs. 1 and 2). Proteins from the inclusion bodies, following removal of urea, have been used for microinjection into plant cells (40), and for nucleotide and nucleic acid binding studies (25, 26, 39). We suggest that experiments using aggregated MP and ssRNA from inclusion bodies for microinjection studies and nucleotide binding assays (39, 40) should be cautiously interpreted. In nucleic acid binding studies, aggregates of protein and labeled probe did not enter the gels, suggesting that association of nucleic acids with TMV MP involved nonspecific interactions (25, 26, 39).
Anion exchange chromatography of solubilized MP inclusion bodies yielded highly purified MP that eluted in peaks P1 and P2. Because the buffer conductivity was different for these peaks, MP in P1 and P2 may have slightly different conformations.
The MP contains two highly hydrophobic regions (Figs. 5 and 6) that are predicted to span membranes (24). Trypsin digestion followed by MS revealed that these two regions were rarely detected and were not cleaved internally by trypsin (Fig. 5). These results support the hypothesis that lipid-like detergent micelles contained putative transmembrane regions of the MP, thereby shielding these regions from trypsin and hindering their detection by MS. These putative membrane-spanning regions are likely responsible for the behavior of the MP as an integral membrane protein (20, 23), including its association with cortical, cytoplasmic, and perinuclear ER (16, 22). MP causes transient aggregation of host ER (20, 22, 24, 41), which apparently plays a role in formation of cytoplasmic bodies where TMV replicates (16, 22).
Domain B of the MP (residues 206–250, Fig. 6) is rich in K and R residues, which may facilitate RNA binding (25, 26). However, C-terminal residues 214–268 are dispensable for function of the MP, whereas residues 1 to ≈214 are required (42, 43). Similarly, phosphorylation of Ser-238 of the MP of the closely related tomato mosaic tobamovirus is dispensable, whereas phosphorylation of Ser-37 is required for function of this protein, as well as for function of the TMV MP (37). Greater sequence conservation among tobamovirus MPs is observed for N-terminal residues 1 to ≈216 than for C-terminal portions (not shown). Trypsin rapidly removes MP residues 250–268 (Figs. 5 and 6), whereas the trypsin-resistant core contains the conserved N-terminal residues that are essential for cell–cell spread of TMV (24, 42, 43).
CD spectra recorded from 205 to 250 nm suggested that MP structure is predominantly α-helical in buffer containing 0.1% SDS and 2 M urea (the buffer did not display significant ellipticity; data not shown). Similarly, other membrane proteins retain secondary structure in SDS, including the aquaporin AqpZ from E. coli (6), the Streptomyces lividans potassium channel homolog (5), glycophorin A from human erythrocytes (44), and phospholamban from human heart muscle (45). Because the MP has ordered secondary structure and a trypsin-resistant core, we suggest that the protein has stable tertiary structure that is not disrupted by low concentrations of urea and SDS (Figs. 4–6). This domain may participate in the establishment of membrane-associated TMV replication complexes, intracellular distribution of TMV, and manipulation of plasmodesmal pores to allow cell–cell spread of infection.
Acknowledgments
We thank Mike Petrassi and Drs. Tianwei Lin, Jane Wu, Mohammed Bendahmane, Szecsi Judit, Brian Adair, and Jeffery Kelly for experimental assistance. Support was provided by National Institutes of Health–National Research Service Award postdoctoral fellowships (L.M.B., T.W.K.), National Science Foundation Grant MCB 9631124 (R.N.B.), and the Scripps Family Chair (R.N.B.). During this work M.Y. was an Established Investigator of the American Heart Association and Bristol-Myers Squibb and is now a recipient of a Clinical Scientist Award in Translational Research from the Burroughs Wellcome Fund.
Abbreviations
- TMV
tobacco mosaic virus
- MP
movement protein
- TNETMG buffer
50 mM Tris, pH 9.0/700 mM NaCl/1 mM EDTA/1% (vol/vol) Tween 20/10 mM 2-mercaptoethanol/10% glycerol
- TNEM8MU buffer
10 mM Tris, pH 9.0/500 mM NaCl/5 mM EDTA/1 mM 2-mercaptoethanol/8 M urea
- TNEM2MU buffer
identical to TNEM8MU buffer except contains 2 M urea
- ss
single-stranded
- ER
endoplasmic reticulum
- K
lysine
- R
arginine
Footnotes
Article published online before print: Proc. Natl. Acad. Sci. USA, 10.1073/pnas.130187897.
Article and publication date are at www.pnas.org/cgi/doi/10.1073/pnas.130187897
References
- 1.Matthews R E F. Plant Virology. 2nd Ed. New York: Academic; 1991. [Google Scholar]
- 2.Deom C M, Oliver M J, Beachy R N. Science. 1987;237:389–394. doi: 10.1126/science.237.4813.389. [DOI] [PubMed] [Google Scholar]
- 3.Pickard B G, Beachy R N. Cell. 1999;98:5–8. doi: 10.1016/S0092-8674(00)80600-5. [DOI] [PubMed] [Google Scholar]
- 4.Niederweis M, Ehrt S, Heinz C, Klocker U, Karosi S, Swiderek K M, Riley L W, Benz R. Mol Microbiol. 1999;33:933–945. doi: 10.1046/j.1365-2958.1999.01472.x. [DOI] [PubMed] [Google Scholar]
- 5.Cortes D M, Perozo E. Biochemistry. 1997;36:10343–10352. doi: 10.1021/bi971018y. [DOI] [PubMed] [Google Scholar]
- 6.Borgnia M J, Kozono D, Calamita G, Maloney P C, Agre P. J Mol Biol. 1999;291:1169–1179. doi: 10.1006/jmbi.1999.3032. [DOI] [PubMed] [Google Scholar]
- 7.Cheng A, Van Hoek A N, Yeager M Y, Verkman A S, Mitra A K. Nature (London) 1997;387:627–630. doi: 10.1038/42517. [DOI] [PubMed] [Google Scholar]
- 8.Unger V M, Kumar N M, Gilula N B, Yeager M. Science. 1999;283:1176–1180. doi: 10.1126/science.283.5405.1176. [DOI] [PubMed] [Google Scholar]
- 9.Matlack K E S, Mothes W, Rapoport T A. Cell. 1998;92:381–390. doi: 10.1016/s0092-8674(00)80930-7. [DOI] [PubMed] [Google Scholar]
- 10.Strambio-de-Castillia C, Blobel G, Rout M P. J Cell Biol. 1999;144:839–855. doi: 10.1083/jcb.144.5.839. [DOI] [PMC free article] [PubMed] [Google Scholar]
- 11.Wagenknecht T, Radermacher M. Curr Opin Struct Biol. 1997;7:258–265. doi: 10.1016/s0959-440x(97)80034-6. [DOI] [PubMed] [Google Scholar]
- 12.Unwin N. Nature (London) 1995;373:37–43. doi: 10.1038/373037a0. [DOI] [PubMed] [Google Scholar]
- 13.Oparka K J, Roberts A G, Boevink P, Santa Cruz S, Roberts L, Pradel K S, Imlau A, Kotlizky G, Sauer N, Epel B. Cell. 1999;97:743–754. doi: 10.1016/s0092-8674(00)80786-2. [DOI] [PubMed] [Google Scholar]
- 14.Oparka K J, Prior D A, Santa Cruz S, Padgett H S, Beachy R N. Plant J. 1997;12:781–789. doi: 10.1046/j.1365-313x.1997.12040781.x. [DOI] [PubMed] [Google Scholar]
- 15.Heinlein M, Epel B L, Padgett H S, Beachy R N. Science. 1995;270:1983–1985. doi: 10.1126/science.270.5244.1983. [DOI] [PubMed] [Google Scholar]
- 16.Heinlein M, Padgett H S, Gens J S, Pickard B G, Casper S J, Epel B L, Beachy R N. Plant Cell. 1998;10:1107–1120. doi: 10.1105/tpc.10.7.1107. [DOI] [PMC free article] [PubMed] [Google Scholar]
- 17.McLean B G, Zupan J, Zambryski P C. Plant Cell. 1995;7:2101–2114. doi: 10.1105/tpc.7.12.2101. [DOI] [PMC free article] [PubMed] [Google Scholar]
- 18.Schaad M C, Jensen P E, Carrington J C. EMBO J. 1997;16:4049–4059. doi: 10.1093/emboj/16.13.4049. [DOI] [PMC free article] [PubMed] [Google Scholar]
- 19.Ward B M, Medville R, Lazarowitz S G, Turgeon R. J Virol. 1997;71:3726–3733. doi: 10.1128/jvi.71.5.3726-3733.1997. [DOI] [PMC free article] [PubMed] [Google Scholar]
- 20.Reichel C, Beachy R N. Proc Natl Acad Sci USA. 1998;95:11169–11174. doi: 10.1073/pnas.95.19.11169. [DOI] [PMC free article] [PubMed] [Google Scholar]
- 21.Huang M, Zhang L. Mol Plant Microbe Interact. 1999;12:680–690. [Google Scholar]
- 22.Mas P, Beachy R N. J Cell Biol. 1999;147:945–958. doi: 10.1083/jcb.147.5.945. [DOI] [PMC free article] [PubMed] [Google Scholar]
- 23.Moore P J, Fenczik C A, Deom C M, Beachy R N. Protoplasma. 1992;170:115–127. [Google Scholar]
- 24.Kahn T W, Lapidot M, Heinlein M, Reichel C, Cooper B, Gafny R, Beachy R N. Plant J. 1998;15:15–25. doi: 10.1046/j.1365-313x.1998.00172.x. [DOI] [PubMed] [Google Scholar]
- 25.Citovsky V, Knorr D, Schuster G, Zambryski P. Cell. 1990;60:637–647. doi: 10.1016/0092-8674(90)90667-4. [DOI] [PubMed] [Google Scholar]
- 26.Citovsky V, Wong M L, Shaw A L, Venkataram Prasad B V, Zambryski P. Plant Cell. 1992;4:397–411. doi: 10.1105/tpc.4.4.397. [DOI] [PMC free article] [PubMed] [Google Scholar]
- 27.Giesman-Cookmeyer D, Lommel S A. Plant Cell. 1993;5:973–982. doi: 10.1105/tpc.5.8.973. [DOI] [PMC free article] [PubMed] [Google Scholar]
- 28.Thomas C L, Maule A J. Virology. 1995;206:1145–1149. doi: 10.1006/viro.1995.1040. [DOI] [PubMed] [Google Scholar]
- 29.Rojas M R, Noueiry A O, Lucas W J, Gilbertson R L. Cell. 1998;95:105–113. doi: 10.1016/s0092-8674(00)81786-9. [DOI] [PubMed] [Google Scholar]
- 30.Rouleau M, Smith R J, Bancroft J B, Mackie G A. Virology. 1994;204:254–265. doi: 10.1006/viro.1994.1530. [DOI] [PubMed] [Google Scholar]
- 31.Marcos J F, Vilar M, Perez-Paya E, Pallas V. Virology. 1999;255:354–365. doi: 10.1006/viro.1998.9596. [DOI] [PubMed] [Google Scholar]
- 32.Goelet P, Lomonossoff G P, Butler P J G, Akam M E, Gait G J, Karn J. Proc Natl Acad Sci USA. 1982;79:5818–5822. doi: 10.1073/pnas.79.19.5818. [DOI] [PMC free article] [PubMed] [Google Scholar]
- 33.Webb E C. Enzyme Nomenclature Recommendations. San Diego: Academic; 1992. [Google Scholar]
- 34.Sambrook J, Fritsch E F, Maniatis T. Molecular Cloning: A Laboratory Manual. 2nd Ed. Plainview, NY: Cold Spring Harbor Lab. Press; 1989. [Google Scholar]
- 35.Chang C T, Wu C-S C, Yang J T. Anal Biochem. 1978;91:13–31. doi: 10.1016/0003-2697(78)90812-6. [DOI] [PubMed] [Google Scholar]
- 36.Saito T, Imai Y, Meshi T, Okada Y. Virology. 1988;167:653–656. [PubMed] [Google Scholar]
- 37.Kawakami S, Padgett H S, Hosokawa K, Okada Y, Beachy R N, Watanabe Y. J Virol. 1999;73:6831–6840. doi: 10.1128/jvi.73.8.6831-6840.1999. [DOI] [PMC free article] [PubMed] [Google Scholar]
- 38.Jones S, Thornton J M. Proc Natl Acad Sci USA. 1996;93:13–20. doi: 10.1073/pnas.93.1.13. [DOI] [PMC free article] [PubMed] [Google Scholar]
- 39.Li Q, Palukaitis P. Virology. 1996;216:71–79. doi: 10.1006/viro.1996.0035. [DOI] [PubMed] [Google Scholar]
- 40.Waigmann E, Lucas W J, Citovsky V, Zambryski P. Proc Natl Acad Sci USA. 1994;91:1433–1437. doi: 10.1073/pnas.91.4.1433. [DOI] [PMC free article] [PubMed] [Google Scholar]
- 41.Reichel C, Beachy R N. J Virol. 2000;74:3330–3337. doi: 10.1128/jvi.74.7.3330-3337.2000. [DOI] [PMC free article] [PubMed] [Google Scholar]
- 42.Berna A, Gafny R, Wolf S, Lucas W J, Holt C A, Beachy R N. Virology. 1991;182:682–689. doi: 10.1016/0042-6822(91)90609-f. [DOI] [PubMed] [Google Scholar]
- 43.Gafny R, Lapidot M, Berna A, Holt C A, Deom C M, Beachy R N. Virology. 1992;187:499–507. doi: 10.1016/0042-6822(92)90452-u. [DOI] [PubMed] [Google Scholar]
- 44.Furthmayr H, Marchesi V T. Biochemistry. 1976;15:1137–1144. doi: 10.1021/bi00650a028. [DOI] [PubMed] [Google Scholar]
- 45.Imagawa T, Watanabe T, Nakamura T. J Biochem. 1986;99:41–53. doi: 10.1093/oxfordjournals.jbchem.a135478. [DOI] [PubMed] [Google Scholar]


