Abstract
Microelectrophoresis is a common technique for probing the surface chemistry of the Cryptosporidium parvum oocyst. Results of previous studies of the electrophoretic mobility of C. parvum oocysts in which microelectrophoresis was used are incongruent. In this work we demonstrated that capillary electrophoresis may also be used to probe the surface characteristics of C. parvum oocysts, and we related the surface chemistry of C. parvum oocysts to their stability in water. Capillary electrophoresis results indicated that oocysts which were washed in a phosphate buffer solution had neutrally charged surfaces. Inactivation of oocysts with formalin did not influence their electrophoretic mobility, while oocyst populations that were washed in distilled water consisted of cells with both neutral and negative surface charges. These results indicate that washing oocysts in low-ionic-strength distilled water can impart a negative charge to a fraction of the oocysts in the sample. Rapid coagulation experiments indicated that oocysts did not aggregate in a 0.5 M NaCl solution; oocyst stability in the salt solution may have been the result of Lewis acid-base forces, steric stabilization, or some other factor. The presence of sucrose and Percoll could not be readily identified on the surface of C. parvum oocysts by attenuated total reflectance-Fourier transform infrared spectroscopy, suggesting that these purification reagents may not be responsible for the stability of the uncharged oocysts. These findings imply that precipitate enmeshment may be the optimal mechanism of coagulation for removal of oocysts in water treatment systems. The results of this work may help elucidate the causes of variation in oocyst surface characteristics, may ultimately lead to improved removal efficiencies in full-scale water treatment systems, and may improve fate and transport predictions for oocysts in natural systems.
Cryptosporidium parvum is a parasitic protozoan that causes the diarrheal disease cryptosporidiosis. It has been associated with many outbreaks of disease in recent years (7, 12, 16). There was an outbreak in Milwaukee, Wis., in which C. parvum was linked to over 400,000 illnesses and 104 deaths (27). When outside the host, C. parvum exists as an oocyst, which is highly resistant to a myriad of environmental conditions (12).
Efficient removal of C. parvum oocysts from drinking water supplies by conventional treatment processes has been reported previously (31). However, C. parvum oocysts continue to break through water treatment plants and enter drinking water distribution systems (7, 19, 25, 32, 35). Repeated breakthroughs of C. parvum oocysts may be the result of an incomplete understanding of how oocysts interact chemically and physically under conditions encountered in water treatment systems (5, 7). Knowledge of the oocyst's surface chemistry and subsequent surface interactions during the water treatment process may be used to prevent such breakthroughs.
In order to study the surface chemistry of C. parvum oocysts, oocysts must be purified from infected animals since there is currently no cost-effective method to grow oocysts in vitro. There are a number of methods for isolating oocysts from animal feces (37). In addition, oocysts are typically washed and stored in a variety of solvents, such as distilled water, prior to use. Knowledge of the influence of purification methods on oocyst surface chemistry is limited (2), yet oocysts are still studied without taking into account this potentially crucial factor. Current guidelines for carrying out studies with oocysts do not take into account the potential effects of altered surface charges due to storage media (11). Use of oocysts with disparate surface characteristics in laboratory and pilot plant studies can lead to results which may not be extrapolated to full-scale operations. Indeed, changes in particle surface chemistry can have a significant influence on particle aggregation and adhesion (1, 4, 15, 24, 26). An improved understanding of the influence of oocyst purification and handling methods on oocyst surface chemistry and subsequent stability (vide infra) in water may lead to more effective oocyst removal in engineered processes.
Microelectrophoresis has commonly been used to quantify the electrophoretic mobility of oocysts (electrophoretic mobility provides an estimate of surface charge). Unfortunately, the results reported previously for electrophoretic mobility have been incongruent. For example, some studies have shown that C. parvum oocysts have an isoelectric point near pH 2.5 (10, 20, 22, 23, 29, 33), while other reports (2) have demonstrated that the oocyst surface remains neutral at pH values between 2 and 10. Thomas and coworkers (36) recently reported that oocysts suspended in CaCl2 solutions had near-zero electrophoretic mobility. Brush et al. (2) have reported that variations in observed electrophoretic mobilities were caused by dissimilarities in purification techniques.
Capillary electrophoresis has been used to quantify the electrophoretic mobilities of biological samples whose sizes are on the order of 0.5 μm (13). Glynn et al. (13) reported that if similar numbers of replicate measurements were used, the standard deviations of electrophoretic mobility measurements obtained by capillary electrophoresis were typically lower than the standard deviations of measurements obtained by microelectrophoresis. They attributed the lower standard deviations to the larger sample size and longer time required for separation with the capillary electrophoresis technique. These investigators further reported variations in charge within monoclonal populations for several different bacterial strains, a significant advantage of capillary electrophoresis over the traditional microelectrophoresis technique. This is possible because the results of capillary electrophoresis are reported on an electropherogram on which retention time is a function of electrophoretic mobility. On the other hand, the results of microelectrophoresis are commonly reported as a single value. Capillary electrophoresis was used in this study to evaluate the influence of selected solvents that are often used to wash or store oocysts on the electrophoretic mobility of oocysts. In capillary electrophoresis, particles and molecules in an electrolyte solution are separated based on charge in a long capillary tube, which has an electric potential applied across its length. The electric potential induces an electroosmotic flow due to a double layer that is formed at the capillary-solvent interface, which causes the bulk electrolyte solution to move from the positive electrode, located at the column influent, to the negative electrode, located at the column effluent. The far end of the column contains a detector (typically a UV detector for biological applications) that measures the presence of molecules and particles at that point in the column. Neutrally charged particles and molecules move through the column with the bulk solvent via electroosmotic flow. A neutrally charged dopant, such as mesityl oxide, is used to measure the bulk solvent flow. Negatively charged molecules and particles move through the column at a rate that is less than that of the dopant. The electrophoretic mobility of a particle can be quantified by the following relationship (13, 21, 34):
 |
where μ is the electrophoretic mobility (in meters squared per volt·second), Lt is the total length of the capillary (in meters), Ld is the length of the capillary from the sample inlet to the detector (in meters), V is the voltage applied across the length of the capillary (in volts), tr is the retention time of the neutrally charged dopant (in seconds), and tp is the retention time of the particle (in seconds) (see references 13, 21, and 34 for a more detailed explanation of capillary electrophoresis theory).
The term stability is used to describe the tendency of particles to resist aggregation. The stability of particles is a function of repulsive and attractive forces between the particles (9, 41). Factors that affect particle stability in water include pH, ionic strength, surface functional groups, and adsorption of inorganic and organic matter from solution. During the production of drinking water, colloidal particles in raw surface water are typically destabilized, a process which promotes the formation of larger aggregates that can be removed by subsequent physicochemical processes, such as sedimentation, filtration, or flotation. Particle destabilization is achieved by adjusting solution chemistry such that the net force between particles is attractive. Mechanisms of particle destabilization and aggregation include compression of the double layer, charge neutralization, precipitate enmeshment, and interparticle bridging (1). In this study we examined the effects of the double-layer-compression mechanism of coagulation on the stability of C. parvum oocysts. In double-layer compression, electrostatic repulsive forces, caused by charged moieties on particle surfaces, are screened out by increasing the ionic strength with an indifferent electrolyte, such as NaCl. If the electrostatic force is the only repulsive interaction between two particles, then the particles should aggregate via the attractive van der Waals force. However, if other repulsive forces (e.g., Lewis acid-base forces or hydration forces) are present in a system or if the particles are sterically stabilized, then they may not aggregate when the electrostatic force is screened via double-layer compression (14).
The objective of this project was to determine if the stability of C. parvum oocysts, used as received from commercial sources, was due to their surface charge. In this study we examined the electrophoretic mobility and surface characteristics of C. parvum oocysts as affected by typical isolation and handling procedures. Capillary electrophoresis has not been used previously to determine the electrophoretic mobility of this organism. Knowledge of the electrophoretic mobility and surface chemistry of oocysts may elucidate causes of variation in oocyst surface characteristics reported previously, may ultimately lead to improved removal efficiencies in full-scale water treatment systems, and may improve fate and transport predictions for oocysts in natural systems.
MATERIALS AND METHODS
C. parvum oocysts.
C. parvum oocysts were obtained from Waterborne, Inc. (New Orleans, La.) and Pleasant Hill Farm (Troy, Idaho). Oocysts were isolated from feces from experimental infected calves by sucrose and Percoll density gradient centrifugation after initial extraction of the feces with diethyl ether. The oocysts were stored at 4°C in phosphate buffer amended with 1,000 U of penicillin per ml and 125 μg of streptomycin sulfate per ml to prevent bacterial growth. Prior to use, the C. parvum oocysts were examined microscopically for purity, and samples that had bacterial contamination were not used. The oocysts were collected by centrifugation (16,060 × g for 5 min) and suspended in distilled water or a phosphate buffer solution (20 mM, pH 7). Oocysts used in diffuse reflectance infrared spectroscopy were obtained from the Department of Microbiology and Immunology, Cornell University (Ithaca, N.Y). The purification and storage procedures used for these oocysts were the procedures described by Brush et al. (2). These oocysts were washed as described above. Unless otherwise stated, all oocysts were used within 2 months of the time that they were received. The actual age of the stocks may have been slightly greater because the time between purification and delivery was not known.
Microspheres.
Use of capillary electrophoresis to quantify the electrophoretic mobility of particles whose size was comparable to that of C. parvum oocysts (3 to 5 μm) was validated with latex microspheres that were approximately the same size. Surfactant-free, 5-μm, carboxylate-modified polystyrene latex spheres (CML) were obtained from Interfacial Dynamics Corp. (Portland, Oreg.). Stock suspensions of microspheres were washed in deionized water until monodisperse (nonaggregated) suspensions were produced, and the microspheres were suspended in a 1 mM NaHCO3 electrolyte solution. Monodisperse suspensions were verified by light microscopy and particle-counting techniques.
Capillary electrophoresis.
Capillary electrophoresis experiments were performed by using a Dionex capillary electrophoresis system (Dionex, Sunnyvale, Calif.). The fused silica capillary, supplied by Phenomenex (Torrance, Calif.), was approximately 57 cm long and 75 μm in diameter. As presented by Dionex, a window for the detector was placed (the polyamide was burned off) 52 cm from the sample injection reservoir. Because more than one capillary was used during this study, the times required for the sample to reach the detector window varied slightly. To ensure consistency, detection times were quantified for all experiments with a neutral dopant. A 1 mM NaHCO3 electrolyte solution (pH 8.4) was used for all experiments. Sodium bicarbonate was selected because it buffers the pH in natural systems in which C. parvum oocysts may be encountered. Samples were injected by gravity and were eluted through the column at 30 kV. The detector wavelength was set at 210 nm by using the method of Glynn et al. (13). Mesityl oxide was used as a neutral dopant to quantify the bulk fluid movement through the column. Experiments were conducted both in the presence and in the absence of the dopant to determine the influence of the dopant on oocyst mobility. The capillary was cleaned between samples by injection of 0.1 M H3PO4, followed by 0.5 M NaOH. The capillary was then rinsed with the 1 mM NaHCO3 electrolyte solution until a stable baseline was obtained. All experiments were performed in triplicate. Proper operation of the instrument was verified by sampling the neutral dopant and examining the migrating medium. For example, the presence of oocysts corresponding to a particular peak was confirmed by (i) repeating the experiment, (ii) stopping the flow of electrolyte just prior to the retention time observed for oocysts in the previous experiment by removing the applied voltage, (iii) immediately removing the capillary from the instrument and separating it just upstream of the window, (iv) placing the migrating medium on a microscope slide, and (v) verifying the presence of C. parvum oocysts with a light microscope at a magnification of ×1,000.
Microscopy.
A light microscope and a Petroff-Hauser counting chamber were used to evaluate the tendency of C. parvum oocysts and CML microspheres to aggregate in distilled water and 0.5 M NaCl. The percentage of aggregates was estimated by dividing the total number of aggregates by the total number of particles counted in the chamber for each treatment. For purposes of comparison, the concentrations of oocysts and CML microspheres were maintained at the same order of magnitude for all experiments.
Infrared spectroscopy.
Attenuated total reflectance (ATR)-Fourier transform infrared (FTIR) spectra were obtained by placing a suspension of oocysts on a ZnSe ATR crystal. Oocysts were allowed to settle for 20 min to obtain the best spectra. The sample chamber was flushed with N2(g) to minimize the effects of gaseous CO2 and H2O. The spectra were then corrected for peaks resulting from residual CO2 and H2O. Diffuse reflectance spectra were obtained by using freeze-dried oocysts, which were mixed with dry KBr. Spectra were corrected for small impurities (absorbed H2O) in the KBr.
RESULTS
Electrophoresis.
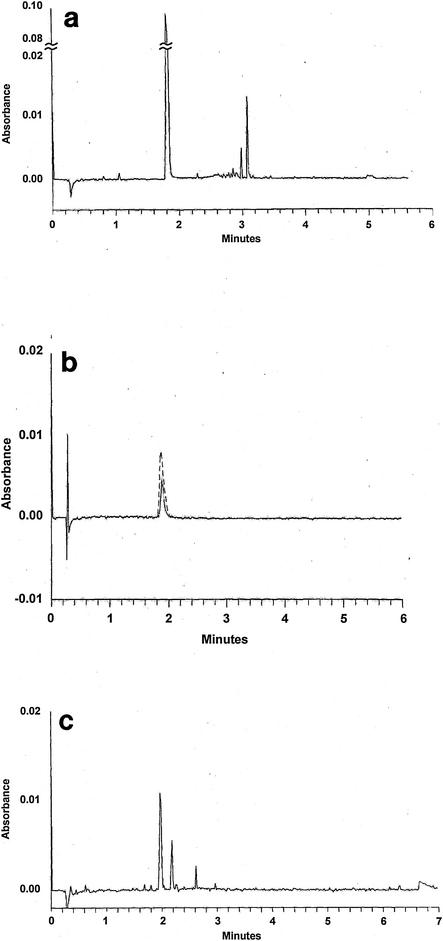
Initially, the capillary electrophoresis technique was validated with CML microspheres that were approximately the same diameter as C. parvum oocysts. Microspheres with carboxyl surface functional groups were used because C. parvum oocysts have been reported to have similar surface functional groups (22). Figure 1a shows a typical electropherogram of CML microspheres and a mesityl oxide dopant. Peaks from 0 to ca. 30 s were the result of noise caused by application of the 30-kV energy potential following sample injection. This noise did not influence the parameters required to calculate the electrophoretic mobility (see equation above). The peak on the electropherogram at 1.8 min corresponds to the dopant, and the peaks at ca. 3 min correspond to the CML microspheres. The electropherogram in Fig. 1a shows that there was a distribution of CML microspheres with various surface charges. Similar findings have been reported for latex spheres (13) and single-strain microbial populations (38). Figure 1a shows that the electrophoretic mobility of the CML microspheres was ca. −3.6E-08 m2/V·min. This value is comparable to the value expected by the manufacturer (James Goodwyn, Interfacial Dynamics Corp., personal communication).
FIG. 1.
(a) Representative electropherogram of CML microspheres and mesityl oxide dopant. Peaks at the start of the electropherogram (from 0 s to ca. 30 s) result from noise caused by application of the 30-kV energy potential following sample injection. (b) Representative electropherogram of C. parvum oocysts, which were analyzed as received. The single peak at 1.9 min corresponds to the oocysts. The peak indicated by the dashed line represents the retention time for both the mesityl oxide dopant and C. parvum oocysts, showing that the two have the same value. (c) Representative electropherogram for oocysts washed in distilled water. The peak at ca. 2 min represents both oocysts and the mesityl oxide dopant.
Figure 1b is a typical electropherogram of C. parvum oocysts supplied by Waterborne Inc., and the sample was analyzed as received. The single peak at 1.9 min corresponds to the oocysts. The presence of C. parvum oocysts corresponding to the peak in Fig. 1b was verified by microscopic examination of the migrating medium. The retention time for the dopant was also 1.9 min. The results indicate that the oocysts migrated through the column via electroosmosis with the carrier electrolyte, which implies that they were not charged. Similar results were obtained with additional batches of C. parvum oocysts that were supplied by Waterborne Inc. and Pleasant Hill Farm.
Figure 1c shows a typical electropherogram for oocysts (from the first batch of Waterborne Inc. oocysts) that were washed in distilled water. The peak at ca. 2 min represents oocysts and the dopant. Additional peaks represent charged oocysts. Similar results were obtained with additional batches of C. parvum oocysts that were supplied by Waterborne Inc. and washed in distilled water. These results indicate that a fraction of the oocysts became negatively charged after they were washed with low-ionic-strength distilled water. Washing oocysts in the phosphate buffer solution did not impart a negative charge to the oocysts (the electropherograms for these oocysts were comparable to those shown in Fig. 1b). A third batch of oocysts, which were washed in distilled water by Waterborne Inc., contained both neutral and negatively charged oocysts.
Microscopy.
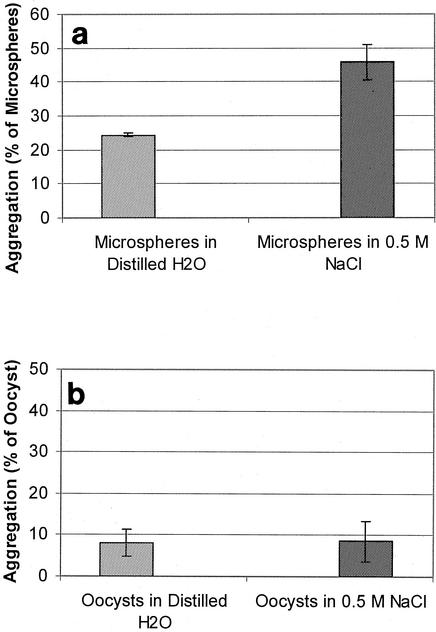
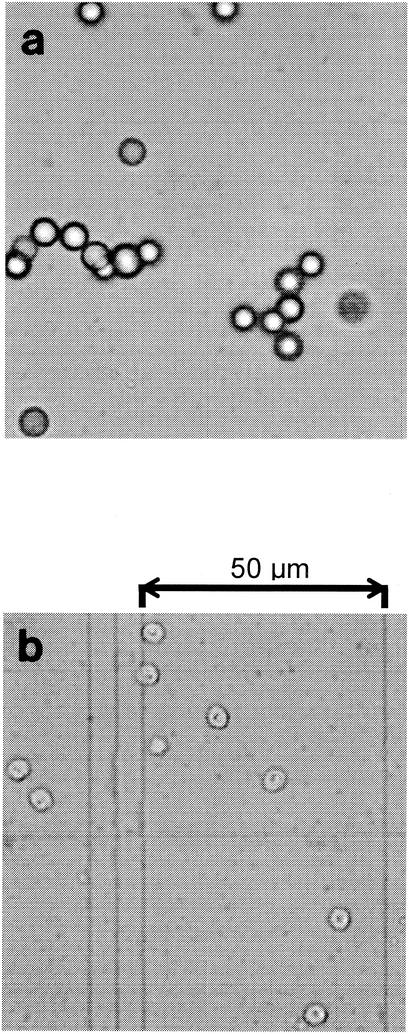
A Petroff-Hauser counting chamber was used to determine if the effects of double-layer compression could be observed with C. parvum oocysts. As when capillary electrophoresis was used, the experimental approach was validated with CML microspheres. The aggregation of CML microspheres suspended in either distilled water or 0.5 M NaCl is shown in Fig. 2a. The results of a similar experiment performed with C. parvum oocysts are shown in Fig. 2b. Unlike the CML microspheres, the oocysts did not aggregate in the 0.5 M NaCl solution. Figure 3 shows a photomicrograph of oocysts and CML microspheres in the Petroff-Hauser counting chamber suspended in the 0.5 M NaCl solution. Aggregates of CML microspheres are plainly visible.
FIG. 2.
(a) Aggregation of CML microspheres suspended in distilled water and 0.5 M NaCl. (b) Aggregation of C. parvum oocysts suspended in distilled water and 0.5 M NaCl. Error bars represent 1 standard deviation.
FIG. 3.
Photomicrographs of CML microspheres (a) and oocysts (b) in a Petroff-Hauser counting chamber. The microspheres and oocysts were suspended in a 0.5 M NaCl solution.
Infrared spectroscopy.
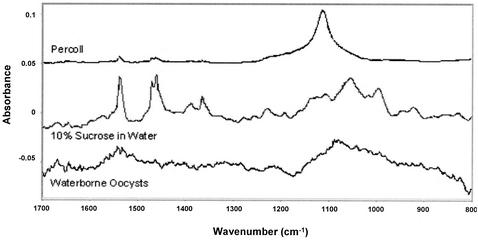
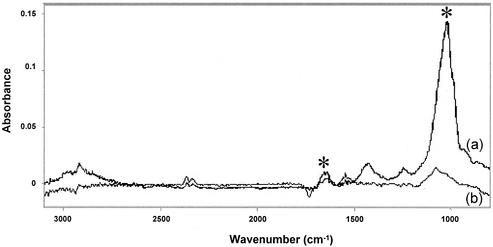
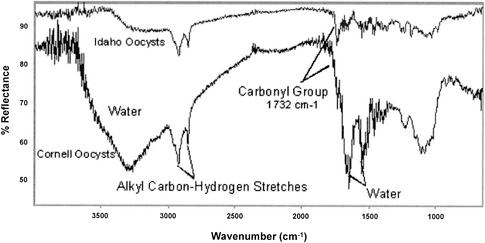
We hypothesized that sucrose, which was used in the primary purification of C. parvum oocysts from feces, may have coated the oocyst surface, possibly resulting in polar characteristics due to hydrogen bonding, without adding a surface charge. ATR-FTIR spectroscopy was used to determine if selected reagents used in the purification process could be found on the oocyst surface. ATR spectra for Waterborne Inc. oocysts, sucrose, and Percoll are shown in Fig. 4. The presence of sucrose and Percoll could not be identified in the spectrum for the C. parvum oocysts. Figure 5 shows a spectrum for C. parvum oocysts that were treated with formalin and washed. This spectrum shows that formalin was present on the surface of the oocysts, although formalin did not impart a surface charge. Diffuse reflectance spectra were obtained with freeze-dried oocysts mixed with KBr. The resulting spectra indicated that there were two identifiable functional groups: alkyl C-H stretches and carbonyl groups (Fig. 6). Based on oocyst composition, Karaman et al. (22) also reported the presence of carbonyl groups on the oocyst surface. The results indicate that the oocyst surfaces observed in this study were capable of forming hydrogen bonds, which allowed an oocyst with a neutral surface to interact with water and/or polar domains via Lewis acid-base forces (14). The spectra also show that there were similarities between oocysts obtained from two different sources. It has been observed that freeze-drying may alter the composition of the cell surface (30).
FIG. 4.
ATR spectra of C. parvum oocysts and chemicals commonly used in the oocyst purification process.
FIG. 5.
ATR spectra of formalin-treated oocysts (spectrum a) and oocysts not exposed to formalin (spectrum b). Note the absorption bands identified in spectrum a by asterisks that correspond to formaldehyde. These bands may arise from either formaldehyde adsorbed onto the surface of the oocyst or formaldehyde absorbed into the oocyst. Also note the absence of these bands in spectrum b.
FIG. 6.
Diffuse reflectance FTIR spectra of C. parvum oocysts from Cornell and Idaho.
DISCUSSION
The findings shown in Fig. 1b and c may help explain previous conflicting reports concerning surface charge (3, 10, 20, 23, 22, 29, 33, 36). For example, using microelectrophoresis, Brush et al. (2) reported finding neutrally charged C. parvum oocysts. In contrast, other workers have reported that the surface of the C. parvum oocyst is exclusively negatively charged at circumneutral pH values (10, 20, 23, 22, 29, 33). It should be noted that washing procedures were not clearly outlined in some of these studies. It is possible that ionized functional groups on the oocyst are coated with up to 20 to 30 nm of a carbohydrate-rich glycocalyx (3, 28). Washing oocysts in low-ionic-strength solvents may result in removal of a glycocalyx and a concomitant increase in the electrophoretic mobility. The observed increase in C. parvum oocyst electrophoretic mobility as a result of washing in low-ionic-strength solvents is consistent with results reported by Pembrey et al. (30) for other microorganisms. Formalin, which is used to inactivate C. parvum oocysts, has also been reported to increase the electrophoretic mobility of C. parvum oocysts (2). Our results suggest that formalin did not impart a significant charge to the oocysts surface. (The electropherograms for formalin-treated oocysts were comparable to those shown in Fig. 1b.)
The lack of surface charge indicated by the capillary electrophoresis data was supported by stability (aggregation) experiments. Compared to the data obtained with distilled water, the larger percentage of aggregates in the electrolyte suspension suggests that double-layer compression may have resulted in a reduction in electrostatic repulsion between the CML microspheres. Unlike the microspheres, the oocysts did not aggregate in the 0.5 M NaCl solution. This observation was consistent for oocysts received from several suppliers. These results support the electrophoresis data presented above and suggest that C. parvum oocysts may not have a significant surface charge. The stability of oocysts in the salt solution may have been the result of Lewis acid-base forces, steric stabilization, or other factors (14). The polar nature of the oocyst surface (i.e., the ability to hydrogen bond) was observed in the ATR spectra, which may implicate Lewis acid-base interactions (14). A rationale for oocyst stability has been described previously. For example, Walker and Montemagno (42) reported that sorption of oocysts to Al2O3 was observed only for oocysts that had their walls disrupted by some environmental stress, such as freeze-thaw cycles. Using laterally resolved force microscopy, Considine et al. (6) found that proteinaceous materials on the oocyst surface may be responsible for steric interactions. Furthermore, Harter et al. (18) reported reversible adhesion of oocysts to sandy soils and aquifer sediments and reported only a very weak electrostatic energy of interaction. Recently, Dai and Boll (8) reported that oocysts entrained in overland flow travel freely in the water column and do not attach to particulate matter in the sediment load as a result of electrostatic interactions. Although the reason for the stability of oocysts remains unclear, our aggregation results are consistent with the capillary electrophoresis data shown in Fig. 1b. The upshot is that the capillary electrophoresis data, aggregation data, and ATR spectra obtained in this work indicate that oocysts remain stable in a water column without a significant net surface charge.
Although ATR spectroscopy can penetrate up to several microns beyond the surface of a sample (17), it has been shown that infrared spectroscopy is useful for probing the molecular properties of other microorganisms (39, 40), and it was therefore considered a relevant technique for this work. The purpose of using this technique was to determine the presence of residual solvents used in the purification processes, whether on the surface of the oocysts or inside the oocysts. Because sucrose and Percoll could not be identified in the spectra for the C. parvum oocysts that were examined, we presumed that these compounds did not bind to the oocyst surface during the purification procedure and consequently did not influence the stability of the oocysts. The spectra for formalin-treated oocysts shown in Fig. 5 did indicate the presence of formalin residue in the oocysts studied. It is conceivable that formalin penetrated into the cell wall following this treatment step, but it is clear that the formalin could not be removed after several water washes. Penetration of formalin into the interior of the cell was expected since formalin is used to inactivate oocysts. This may explain why formalin-treated oocysts did not have a significant surface charge as a result of formalin.
The results reported here indicate that C. parvum oocysts do not always have a surface charge and that the surface charge may be altered by washing oocysts in distilled water. This finding is noteworthy because it suggests that the stability of C. parvum oocysts in the water column is related to properties other than surface charge, such as hydrogen bonding or steric stabilization. The observed stability without a surface charge may hinder removal of C. parvum oocysts by typical water treatment techniques because the charge neutralization mechanism of coagulation is not effective for particles with this surface characteristic. This may help explain why other workers (3, 31) have reported that optimal removal of C. parvum oocysts requires the precipitate enmeshment mechanism of coagulation. Additional research is required to identify whether naturally occurring oocysts are charged and to evaluate the influence of natural waters on oocyst surface chemistry. Such information might improve the detection of oocysts in environmental systems and improve the efficacy of treatment processes designed to remove oocysts from water streams. The capillary electrophoresis technique might be useful in this regard.
Finally, the results suggest that storage and preparation of oocysts may affect the outcomes of bench-scale treatment studies. Current guidelines related to oocyst stocks are very specific about many aspects of oocyst suspensions used for such experiments, but the results of this work suggest that storage and preparation aspects should be considered carefully as well.
Acknowledgments
We thank Dwight Bowman, Department of Microbiology and Immunology, Cornell University, for supplying oocyst samples. We gratefully acknowledge the guidance of J. C. Baygents, Department of Chemical and Environmental Engineering, The University of Arizona, concerning the use of capillary electrophoresis for biological samples. We also acknowledge the technical assistance of Michael Kelley, Department of Geography and Environmental Engineering, United States Military Academy, and Russell Forney, David Loehle, and Dawn Riegner, Department of Chemistry and Life Sciences, United States Military Academy.
This project was supported by grants from the Army Research Laboratory and the Army Research Office.
REFERENCES
- 1.Amirtharajah, A., and C. R. O'Melia. 1990. Coagulation processes: destabilization, mixing, and flocculation, p. 269-361. In F. W. Pontius (ed.), Water quality and treatment. AWWA, McGraw-Hill, Inc., New York, N.Y.
- 2.Brush, C. F., M. F. Walter, L. J. Anguish, and W. C. Ghiorse. 1998. Influence of pretreatment and experimental conditions on electrophoretic mobility and hydrophobicity of Cryptosporidium parvum oocysts. Appl. Environ. Microbiol. 64:4439-4445. [DOI] [PMC free article] [PubMed] [Google Scholar]
- 3.Bustamante, H. A., S. R. Shanker, R. M. Pashley, and M. E. Karaman. 2001. Interaction between Cryptosporidium oocysts and water treatment coagulants. Water Res. 35:3179-3189. [DOI] [PubMed] [Google Scholar]
- 4.Butkus, M. A., and D. Grasso. 1999. The impact of phosphate sorption on water treatment residual surface characteristics: prelude to reuse. Environ. Eng. Sci. 16:117-129. [Google Scholar]
- 5.Clancy, J. L., and C. Fricker. 1998. Control of cryptosporidium—how effective is drinking water treatment? Water Qual. Int. 7/8:37-41.
- 6.Considine, R. F., D. R. Dixon, and C. J. Drummond. 2000. Laterally-resolved force microscopy of biological microspheres—oocyts of Cryptosporidium parvum. Langmuir 16:1323-1330. [Google Scholar]
- 7.Craun, G. F., S. A. Hubbs, F. Frost, R. L. Calderon, and S. H. Via. 1998. Waterborne outbreaks of cryptosporidiosis. J. Am. Water Works Assoc. 90:81-91. [Google Scholar]
- 8.Dai, X., and J. Boll. 2003. Evaluation of attachment of Cryptosporidium parvum and Giardia lamblia to soil particles. J. Environ. Qual. 32:296-304. [DOI] [PubMed] [Google Scholar]
- 9.Derjaguin, B. V., and L. D. Landau. 1941. Theory and stability of strongly charged lyophobic sols and of the adhesion of strongly charged particles in solutions of electrolytes. Acta Physicochim. USSR 14:633. [Google Scholar]
- 10.Drozd, C., and J. Schwartzbrod. 1996. Hydrophobic and electrostatic cell surface properties of Cryptosporidium parvum. Appl. Environ. Microbiol. 62:1227-1232. [DOI] [PMC free article] [PubMed] [Google Scholar]
- 11.Dufour, A. P., M. Feige, H. D. A. Lindquist, M. Messner, S. Regli, L. Edgers, F. W. Schaefer III, S. Schaub, J. Sinclair, and L. I. Wymer. 1999. Criteria for evaluation of proposed protozoan detection methods. U.S. Environmental Protection Agency, Washington, D.C.
- 12.Fayer, R., C. A. Speer, and J. P. Dubey. 1997. The general biology of Cryptosporidium, p. 2-27. In R. Fayer (ed.), Cryptosporidium and Cryptosporidiosis. CRC Press, Boca Raton, Fla.
- 13.Glynn, J. R., B. M. Belongia, R. G. Arnold, K. L. Ogden, and J. C. Baygents. 1998. Capillary electrophoresis measurements of electrophoretic mobility of colloidal particles of biological interest. Appl. Environ. Microbiol. 64:2572-2577. [DOI] [PMC free article] [PubMed] [Google Scholar]
- 14.Grasso, D., K. Subramaniam, M. A. Butkus, J. Bergendahl, and K. Strevett. 2002. A review of non-DLVO interactions in environmental colloidal systems. Rev. Environ. Sci. Bio/Technol. 1:17-38. [Google Scholar]
- 15.Gregory, J. 1993. The role of colloid interactions in solid-liquid separation. Water Sci. Technol. 27:1-17. [Google Scholar]
- 16.Haas, C. N., and J. B. Rose. 1995. Developing an action level for Cryptosporidium. J. Am. Water Works Assoc. 87:81-84.11540484 [Google Scholar]
- 17.Harrick, N. J. 1967. Internal reflection spectroscopy. Interscience Publishers, John Wiley and Sons Inc., New York, N.Y.
- 18.Harter, T., S. Wagner, and E. R. Atwill. 2000. Colloid transport and filtration of Cryptosporidium parvum in sandy soils and aquifer sediments. Environ. Sci. Technol. 34:62-70. [Google Scholar]
- 19.Hashimoto, A., T. Hirata, and S. Kunikane. 2001. Occurrence of Cryptosporidium oocysts and Giardia cysts in a conventional water purification plant. Water Sci. Technol. 43:89-92. [PubMed] [Google Scholar]
- 20.Hsu, B.-M., and C. Huang. 2002. Filtration behaviors of Giardia and Cryptosporidium—ionic strength and pH effects. Colloids Surf. A Physicochem. Eng. Aspects 201:201-206. [DOI] [PubMed] [Google Scholar]
- 21.Hunter, R. J. 1981. Zeta potential in colloid science. Academic Press, San Francisco, Calif.
- 22.Karaman, M. E., R. M. Pashley, H. Bustamante, and S. R. Shanker. 1999. Microelectrophoresis of Cryptosporidium parvum oocysts in aqueous solutions of inorganic and surfactant cations. Colloids Surf. A Physicochem. Eng. Aspects. 146:217-225. [Google Scholar]
- 23.Kelley, M. B. 1996. The removal of Cryptosporidium by selected drinking water treatment processes. Ph.D. dissertation. Rensselaer Polytechnic Institute, Troy, N.Y.
- 24.Labare, M. P., K. Guthrie, and R. M. Weiner. 1989. Polysaccharide exopolymer adhesives from periphytic marine bacteria. J. Adhesion Sci. Technol. 3:213-223. [Google Scholar]
- 25.LeChevallier, M. W., W. D. Norton, and R. G. Lee. 1991. Occurrence of Giardia and Cryptosporidium spp. in surface water supplies. Appl. Environ. Microbiol. 57:2610-2616. [DOI] [PMC free article] [PubMed] [Google Scholar]
- 26.Lyklema, J. 1978. Surface chemistry of colloids in connection with stability, p. 36. In K. J. Ives (ed.), The scientific basis of flocculation. Sijhoff and Noordhoff, Alphen aan den Rijn, The Netherlands.
- 27.MacKenzie, W. R., N. J. Hoxie, M. E. Proctor, M. S. Gradus, K. A. Blair, D. E. Peterson, J. J. Kazmierczak, D. G. Addiss, K. R. Fox, J. B. Rose, and J. P. Davis. 1994. A massive outbreak in Milwaukee of Cryptosporidium infection transmitted through the public water supply. N. Engl. J. Med. 331:161-167. [DOI] [PubMed] [Google Scholar]
- 28.Nanduri, J., S. Williams, A. Toshiki, and T. P. Flanigan. 1999. Characterization of an immunogenic glycocalyx on the surfaces of Cryptosporidium parvum oocysts and sporozoites. Infect. Immun. 67:2022-2024. [DOI] [PMC free article] [PubMed] [Google Scholar]
- 29.Ongerth, J. E., and J. P. Proctor Pecoraro. 1996. Electrophoretic mobility of Cryptosporidium oocysts and Giardia cysts. J. Environ. Eng. 122:228-231. [Google Scholar]
- 30.Pembrey, R. S., K. C. Marshall, and R. P. Schneider. 1999. Cell surface analysis techniques: what do cell preparation protocols do to cell surface properties? Appl. Environ. Microbiol. 65:2877-2894. [DOI] [PMC free article] [PubMed] [Google Scholar]
- 31.Plummer, J. D., J. K. Edzwald, and M. B. Kelley. 1995. Removing Cryptosporidium by dissolved-air flotation. J. Am. Water Works Assoc. 87:85-95. [Google Scholar]
- 32.Rose, J. B., C. P. Gerba, and W. Jakubowski. 1991. Survey of potable water supplies for Cryptosporidium and Giardia. Environ. Sci. Technol. 25:1393-1400. [Google Scholar]
- 33.Shaw, K., S. Walker, and B. Koopman. 2000. Improving filtration of Cryptosporidium. J. Am. Water Works Assoc. 92:103-111. [Google Scholar]
- 34.Skoog, D. A., and J. J. Leary. 1992. Principles of instrumental analysis. Saunders College Publishing, Orlando, Fla.
- 35.States, S., K. Stadterman, L. Ammon, P. Vogel, J. Baldizar, D. Wright, L. Conley, and J. Sykora. 1997. Protozoa in river water: sources, occurrence, and treatment. J. Am. Water Works Assoc. 89:74-83. [Google Scholar]
- 36.Thomas, R., E. Bard, M. C. Rouillier, B. Prélot, and L. Mathieu. 2001. Filtration-elution of Cryptosporidium oocysts assisted by electrostatic interactions. Colloids Surf. A Physicochem. Eng. Aspects 195:135-142. [Google Scholar]
- 37.Upton, S. J. 1997. In vitro cultivation, p. 181-200. In R. Fayer (ed.), Cryptosporidium and cryptosporidiosis. CRC Press, Boca Raton, Fla.
- 38.van der Mei, H. C., and H. J. Busscher. 2001. Electrophoretic mobility distributions of single-strain microbial populations. Appl. Environ. Microbiol. 67:491-494. [DOI] [PMC free article] [PubMed] [Google Scholar]
- 39.van der Mei, H. C., J. Noordmans, and H. J. Busscher. 1989. Molecular surface characterization of oral streptococci by Fourier transform infrared spectroscopy. Biochim. Biophys. Acta 991:395-398. [DOI] [PubMed] [Google Scholar]
- 40.van der Mei, H. C., J. Noordmans, and H. J. Busscher. 1990. The influence of a salivary coating on the molecular surface composition of oral streptococci as determined by Fourier transform infrared spectroscopy. Infrared Phys. 30:143-148. [Google Scholar]
- 41.Verwey, E. J. W., and J. T. G. Overbeek. 1948. Theory of the stability of lyophobic colloids. Elsevier, Amsterdam, The Netherlands.
- 42.Walker, M. J., and C. D. Montemagno. 1999. Sorption of Cryptosporidium parvum oocysts in aqueous solution to metal oxide and hydrophobic substrates. Environ. Sci. Technol. 33:3134-3139. [Google Scholar]


