Abstract
Real-time single-molecule fluorescence detection using confocal and near-field scanning optical microscopy has been applied to elucidate the nature of the “on–off” blinking observed in the Ser-65 → Thr (S65T) mutant of the green fluorescent protein (GFP). Fluorescence time traces as a function of the excitation intensity, with a time resolution of 100 μs and observation times up to 65 s, reveal the existence of a nonemissive state responsible for the long dark intervals in the GFP. We find that excitation intensity has a dramatic effect on the blinking. Whereas the time during which the fluorescence is on becomes shorter as the intensity is increased, the off-times are independent of excitation intensity. Statistical analysis of the on- and off-times renders a characteristic off-time of 1.6 ± 0.2 s and allows us to calculate a transition yield of ≈0.5 × 10⁻⁵ from the emissive to the nonemissive state. The saturation excitation intensity at which on- and off-times are equal is ≈1.5 kW/cm2. On the basis of the single-molecule data we calculate an absorption cross section of 6.5 × 10⁻¹⁷ cm2 for the S65T mutant. These results have important implications for the use of the GFP to follow dynamic processes in time at the single-molecular level.
Since the cloning and subsequent expression of the green fluorescent protein (GFP) from the jellyfish Aequorea victoria (1, 2) the research interest for this protein has increased dramatically. The protein has been used successfully in a large and ever-growing number of applications, including gene expression and cell dynamics (3, 4). It is the only cloned protein that exhibits strong intrinsic fluorescence without the need of external chromophores. In the native protein [wild-type (wt)-GFP] the chromophore is formed in an autocatalytic, posttranslational cyclization and oxidation of the tripeptide unit at residues 65–67 (2, 5, 6). The wt-GFP absorbs blue light at ≈395 nm, with a weak peak at ≈475 nm, and emits green light at ≈508 nm (7). Substitution of one or more amino acids at or in close proximity to the chromophore results in mutants with different absorption and emission properties, and in some cases, improved emission and photostability (5, 8, 9). A widely used mutant is the S65T, in which Ser-65 is replaced by Thr (10). The mutant shows only an absorption peak at ≈475 nm, has larger absorption cross section than wt-GFP, and shows no photo-isomerization (8, 9).
Because of the rapidly increasing number of applications, great attention has been focused on the photophysical properties of the wt-GFP and a number of its mutants. Investigation of the photophysical properties has been carried out in ensemble measurements, at room and low temperatures (7, 11–14), and at the single-molecular level (15–19). When molecules are observed individually, the fluorescence emission of GFP shows intensity fluctuations, on–off blinking, and fluorescence switching, a behavior that is hidden in ensemble experiments. These intriguing phenomena also manifest in many other light-emitting systems (20–23) and seem to be a general characteristic of individual emitters. Their discovery, however, has been possible only with the advent of single-molecule experiments at room temperature (20–24). From the fundamental point of view, it remains a challenge to determine the origin of the dark states that lead to molecular blinking and switching. At an applied level, the understanding should help in the design of GFP mutants to either suppress or use the dark states as desired. Additionally, understanding would allow biologists to take maximum profit of the protein's autofluorescence in their specific applications.
Attempts to clarify the origin of the intensity fluctuations in the GFP have been reported by a few authors (16–19, 25, 26). For example, fast excitation-driven fluctuations in the fluorescence emission of yellow-shifted GFP mutants in the submillisecond time range have been discovered by using fluorescence correlation spectroscopy (25). In the earlier work of Dickson et al. (16), autocorrelation analysis from fluorescence trajectories at low intensities indicated that the averaged on–off correlation time (in the order of a few seconds) shortened with increased intensity. In contrast, recently single-molecule studies on the enhanced GFP mutant were reported with dark periods of ≈50 s, independent of excitation intensity, and on-times strongly dependent on the excitation (19).
We have applied real-time single-molecule fluorescence detection to study the light-driven dynamics of the S65T fluorescence emission. We have combined confocal microscopy and near-field scanning optical microscopy (NSOM) to obtain information on the photodynamics of GFP. Both techniques allow recording of real-time fluorescence trajectories of individual molecules at different excitation conditions over a wide dynamic range with microsecond time resolution (27, 28). In addition, NSOM provides higher spatial resolution and correlated topographic information (18, 29). Our experiments show conclusively that excitation intensity has a dramatic effect on GFP blinking, with a reduction of the fraction of molecules being in the “on” state when the excitation intensity is increased. Correspondingly, we find that the on-times become shorter at high intensity. We accurately fit our results by assuming a three-level system, where the molecule transforms between an emissive and a nonemissive state. From the statistical analysis we determine an optimum excitation condition at which the GFP will be preferentially in an “on” state while simultaneously delivering enough fluorescent signal for individual detection. This result has implications for the use of GFP as a marker in the study of dynamic biological processes at the single-molecular level. Provided that an efficient detection scheme is used, excitation of the GFP at low intensities (<1.5 kW/cm2) results in a molecule with high probability of being in an emissive state.
Materials and Methods
Samples were prepared by immobilizing the proteins in water-filled pores of poly(acrylamide) gels. A polymerization mixture of acrylamide/bisacrylamide (Boehringer Mannheim) was prepared in phosphate-buffered saline (PBS), pH 7.5. S65T-GFP (kind gift of V. Subramaniam and also purchased from CLONTECH) was included in the mixture to a final concentration of 10−7 M for NSOM, or 5 × 10⁻¹⁰ M for confocal observation. The gels were 15% acrylamide by weight with 5% cross-linker, yielding average pore diameters of ≈3 nm, sufficient to keep the proteins stationary in the gel. A 2-μl drop of the GFP/poly(acrylamide) mixture was sandwiched between two silica glass coverslips (Menzel, Braunschweig, Germany) and the film was allowed to polymerize for a few minutes. The thickness of the resultant gel film was ≈3 μm.
Confocal and NSOM microscopy were combined to obtain real-time and spatial records of the GFP fluorescence. The 488-nm line of an Ar+–Kr+ ion laser was used to excite the sample. Excitation was performed either confocally or by the small light source emanating from the NSOM probe. In the confocal configuration, incoming circularly polarized light was reflected by a dichroic mirror and focused by a Zeiss 1.3 numerical aperture/63× oil-immersion objective onto the sample. The beam size at the back of the aperture was ≈5 mm. In the NSOM configuration, incoming circularly polarized light was coupled to the back side of the NSOM probe (single mode fiber, λ = 630 nm; Cunz, Frankfurt). Focused ion beam fabricated NSOM probes with apertures of ≈70 nm and delivering power densities up to 15 kW/cm2 were used (30). The fluorescence emission of the individual proteins was collected by the objective and passed through a narrow rejection band filter to block the excitation light and a long-pass filter to pass only the emitted fluorescence (RB488 and OG515 respectively, Omega Optical, Brattleboro, VT). The signal was separated into two perpendicular polarization components by using a broadband beam splitter (400–700 nm from Newport, Fountain Valley, CA) and focused onto two avalanche photodiodes (APDs, SPCM-100, EG & G, Quebec). Typical integration time for imaging was 1 ms per pixel. Fluorescence time trajectories were obtained by positioning the molecules in the center of the excitation profile and recording the fluorescence emission with dwell times of 100 μs in both configurations. Fluorescence trajectories were recorded continuously for ≈65 s.
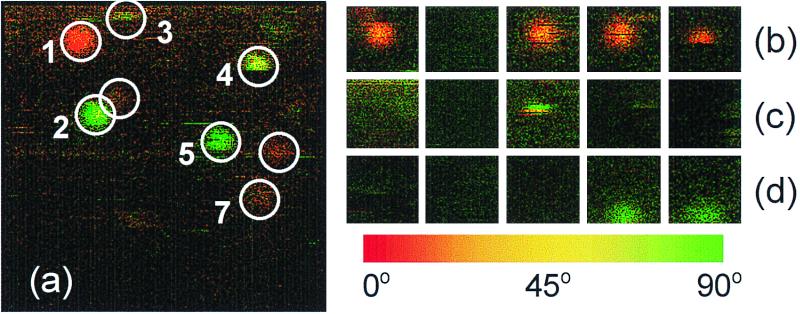
Fluorescent images were generated by using a pseudo-color-coding, red for the 0° APD detector (x direction) and green for the 90° detector (y direction). The color of every fluorescent spot reflects the relative contribution of each polarization component and thus the in-plane orientation of the chromophore emission dipole, whereas the brightness is a measure for the total fluorescence intensity.
Results and Discussion
Imaging Individual Proteins.
Fig. 1a shows a near-field fluorescence image of individual S65T-GFP molecules embedded in the gel. Spatially distributed S65T-GFP molecules with fluorescent spot size of 70 nm full width at half maximum are observed in the image. Interesting features in the image are the sudden cease of emission of some of the molecules during imaging, and the defined in-plane orientation of all of the molecules, evidenced by the constant color per individual spot. We conclude that the proteins are spatially confined in the gel and rotational diffusion is negligible on a time scale up to minutes. The image also confirms that the chromophore sits rigidly inside the barrel structure and rotational movement within the cavity is negligible (10). In Fig. 1a, one can clearly observe that, whereas some molecules emit nearly continuously when excited (molecules 1 and 2), others (molecules 3–5) emit their fluorescence intermittently (blinking).
Figure 1.
Near-field fluorescence images of individual S65T-GFP molecules embedded in a poly(acrylamide) gel. Color in the images indicates the orientation of the chromophore emission dipole moment. Imaging proceeds from top to bottom, left to right. (a) The scan area is 1.8 × 1.8 μm2. The image is 300 × 300 pixels. Molecules are spatially confined in the gel, as seen from the uniform color of the fluorescence spot obtained during imaging. (b–d) Examples of three different molecules as imaged sequentially in time. Five sequential frames are shown, with interframe time of 80 s. On–off blinking is clearly observed when tracing the molecules from frame to frame.
In agreement with earlier observations (16), we find that the on–off behavior prevails at long time scales. Sequential imaging of the same sample area at similar excitation conditions has assessed this. Fig. 1 b–d shows three different molecules that undergo spontaneous jumps between emissive and nonemissive states in an arbitrary manner. It is difficult to identify photobleaching by using the conventional definition of termination of fluorescence. In our experiments we have seen molecules reappearing spontaneously after 130 min of illumination.
Fluorescence Time Trajectories.
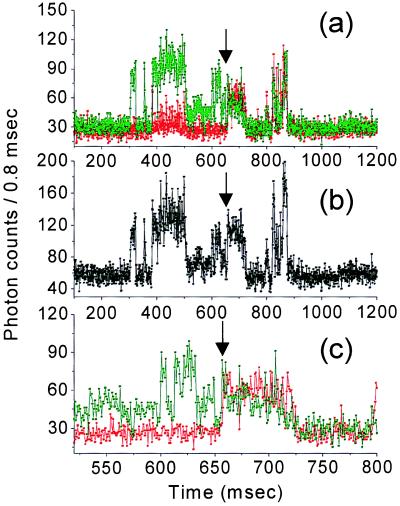
The observed photodynamics of GFP prompted us to record the real-time fluorescence emission of individual protein molecules with high temporal resolution and for long observation times. Figs. 2 and 3 show typical real-time fluorescence trajectories of different individual proteins. We used circularly polarized light to excite all of the molecules equally and to avoid fluorescence fluctuations caused by in-plane rotations. Furthermore, the fluorescence is detected in two perpendicularly polarized channels, so that we are sensitive for changes in the in-plane orientation of the molecule (31). For the majority of the GFPs, the temporal signal fluctuation is correlated in both channels, which excludes fluctuation caused by in-plane re-orientation (seen also in Fig. 1). Yet occasionally a molecular re-orientation is observed. For example, Fig. 2 shows a time trajectory of single-molecule fluorescence in both polarization channels. Initially the signal occurs mainly in the 90° channel, indicating an emission dipole moment along the y direction. After 660 ms a sudden signal contribution is also observed in the 0° channel, while the total intensity remains essentially the same (Fig. 2b). The latter indicates that an in-plane re-orientation of the molecular dipole moment from 90° to approximately 45° has occurred. Fluctuations of fluorescence can also be caused by out-of-plane rotation. However, as shown in Fig. 1, our experiments display hardly any rotational mobility, and even if it occurs, it would be unlikely that after an out-of-plane rotation, the molecule would return to its initial in-plane orientation showing equal fluorescence intensity. We therefore exclude in- and out-of-plane rotational jumps as the cause for the interruptions of fluorescence.
Figure 2.
Extract of a 1.2-s real-time fluorescence trajectory of a single S65T protein, exhibiting blinking, intensity fluctuations, and in-plane rotation. Acquisition time was 100 μs per point, although signal was binned to 800 μs per point to reduce noise. (a) Time trajectory shown in both polarization channels, where signal contribution in the x direction is colored in red and the contribution in the y direction is colored in green. (b) Total emitted signal obtained by adding the counts of both x and y detectors. (c) An in-plane rotation occurs after 660 ms of illumination. The protein changes its orientation from 90° to approximately 45°.
Figure 3.
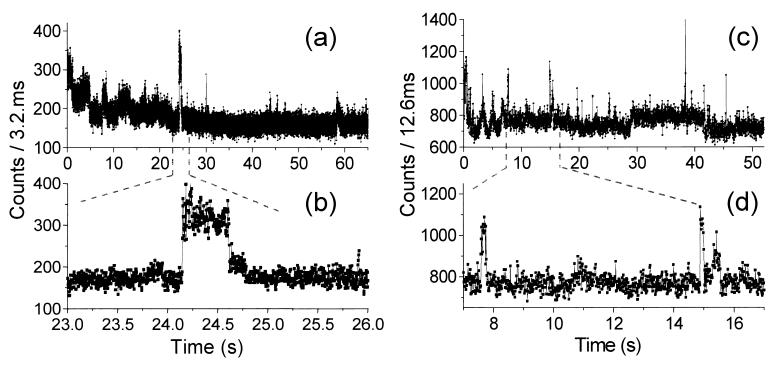
Real-time fluorescence trajectories of two different S65T molecules. (a and c) Total fluorescence time trace, showing mainly background signal with occasional GFP fluorescence bursts. (b and d) Magnification of the fluorescence bursts, with ≈2 × 10⁴ counts in a 0.5-s burst (b), and ≈5 × 10³ counts in a 0.2-s burst (d).
Fig. 3 shows the total fluorescence emitted in time by two other molecules. Both time traces were recorded during ≈60 s with continuous excitation at ≈14 kW/cm2. With dwell times of 100 μs, our dynamic range is more than five orders of magnitude. These examples illustrate that photon emission does not occur in a constant fashion but as bursts of fluorescence rising in between long dark intervals (photon bunching). Also, in many cases, the count rate detected within a photon bunch did not stay constant but showed fluctuations up to 50%.
On–off Statistics.
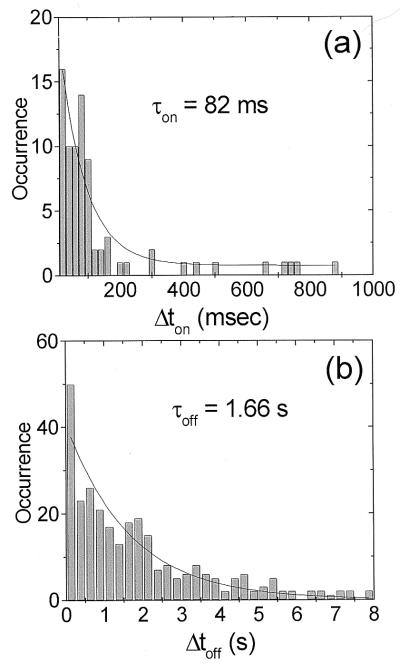
The fluorescence time trajectories contain real-time information on the duration of the photon bunches and the dark intervals. We have analyzed fluorescence trajectories of 64 individual S65T molecules with an excitation intensity of ≈14 kW/cm2. For each trace a set of values Δton for the bright intervals and Δtoff for the dark intervals was collected. In our analysis Δton is the time width of a photon burst, and Δtoff is defined as the time between two consecutive photon bursts, including those dark times present between the start of the experiment and the first fluorescent burst. Fig. 4 shows the Δton (a) and Δtoff (b) distributions. Each histogram is fitted with a single-exponential decay with a characteristic decay time τ. The analysis renders τon = 80 ± 18 ms and τoff = 1.6 ± 0.2 s, corresponding to a relative “on” fraction τon/(τon + τoff) as small as 5% for this excitation intensity. Additionally, the average number of counts obtained during each bright interval has been extracted from the data. With a collection efficiency of 7% in our set-up we extract Non ≈ 6 × 10⁴ photons per photon burst. It is important to mention that of 86 molecules investigated at this intensity, only 64 returned from a dark state within the observation time making statistical analysis of Δton and Δtoff possible. The remaining 26% of the molecules either photodissociated or remained dark for a period longer than 65 s.
Figure 4.
(a) Histogram of the length of the bright on periods obtained for 64 protein molecules observed continuously during ≈60 s excited at ≈14 kW/cm2. The mono-exponential decay renders τon = 82 ± 18 ms at this excitation intensity. (b) Histogram of the length of the dark off periods obtained for the same set of molecules as in a. The mono-exponential decay of the dark period distribution corresponds to τoff = 1.6 ± 0.2 s.
The τoff value found by us is in agreement with the value reported earlier by Dickson et al. (16), yet is in contradiction with recent findings by Peterman et al. (19). In the latter report, because of a long integration time of 0.1 s, comparable to the τon values (19), the authors might have missed many intermediate fluorescent bursts in their time trajectories, resulting in seemingly long dark intervals.
Light Intervals as a Function of Excitation Intensity.
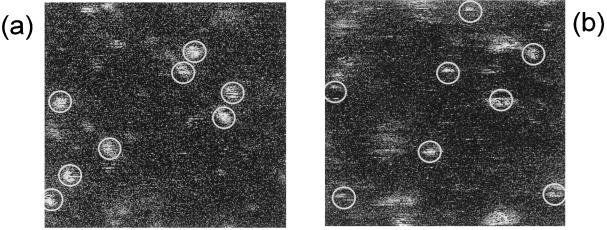
To investigate the photoinduced fluorescence dynamics of the S65T-GFP , we imaged many molecules at different excitation intensities. Fig. 5 shows two images obtained by using confocal excitation with an intensity of 1.2 kW/cm2 in Fig. 5a and 7 kW/cm2 in Fig. 5b. Increased blinking and reduced on times of most molecules are apparent in Fig. 5b as compared with Fig. 5a. Clearly a photoinduced effect occurs, driving the molecules into a nonemissive state.
Figure 5.
Single-molecule imaging of S65T-GFP molecules by using confocal excitation. Images are 10 × 10 μm2, 300 × 300 pixels per image, and acquisition time of 1.6 ms per pixel. Spot size is ≈300 nm. (a) Excitation intensity is 1.2 kW/cm2. Most molecules emit in a rather stable fashion, with little blinking during the scanning. (b) Excitation intensity is 7 kW/cm2. Molecular emission displays increased blinking. The majority of the molecules stop emission after a few lines of scanning.
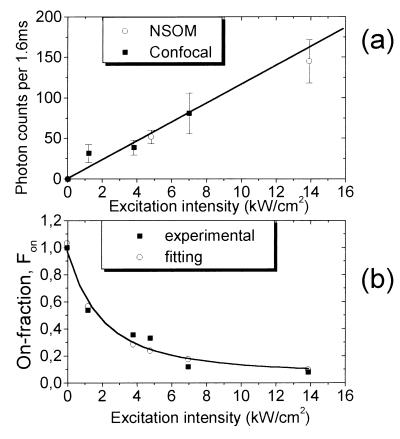
Statistical analysis over a large number of individual molecules at different excitation intensities was performed to gain quantitative understanding of the light-driven behavior of the S65T-GFP. The data were analyzed by determining the fluorescence level of bursts for each emitting molecule. An average signal level for each subset of molecules at a given excitation intensity was obtained. Fig. 6a shows the fluorescence emission of the bright interval as a function of the excitation intensity obtained for 140 molecules. The intensity values plotted in Fig. 6a have been extracted solely from the bright intervals of the molecule (the off blinking would result in lower averaged intensity than plotted in Fig. 6a). The error bars are due to differences in fluorescence emission within each subset of molecules. A clear linear dependence of the count rate as a function of excitation intensity is obtained. This linear relation is understood in terms of a two-level system, specifically a singlet ground state and a singlet excited state. Within each emissive interval the molecule is cycling between the first excited singlet state and the singlet ground state, emitting photons at a rate proportional to the illumination intensity. The linear relation indicates that the molecule is below saturation of the singlet state transition. The slope of the curve is a direct measure for the quantum yield ϕq and the absorption cross section σ. The count rate Con during a bright interval is given by
 |
1 |
where ηc is the optical collection efficiency of the set-up, I is the excitation intensity, and hν is the photon's energy. We obtain [ϕq ⋅ σ] ≈4.2 × 10⁻¹⁷ cm2. Taking ϕq = 0.64 (11), we calculate an absorption cross section σ = 6.5 × 10⁻¹⁷ cm2 (±10%). In comparison with ensemble measurements in solution (11), the value of σ in single S65T molecules is 1/3. A possible explanation is the fact that the GFP ensemble experiences a different environment compared with our single-molecule experiments (free in solution and immobilized in gel, respectively). Spectral shifts in the absorption spectrum, as well as variations of the fluorescent quantum yield are known to occur for many organic dyes, depending on their surroundings (32). In the case of S65T, a shift of the absorption spectrum of ≈20 nm reduces the absorption cross section at 488 nm by a factor of 2.
Figure 6.
(a) Fluorescence emission during the bright interval versus excitation intensity as obtained for 140 molecules. Excitation has been confocal (■) or in the near-field (○). Excitation and emission follow a linear dependence, indicating that when the molecule is in an emissive state, its emission rate is proportional to the excitation intensity. (b) Relative residence of the molecule in the emissive on state as a function of the excitation intensity. The fraction of time the molecule is in the emissive state decreases dramatically with increasing excitation. Fitting of the data has been done by using Fon = Is/(Is + I) with Is = 1.5 kW/cm2 (see text).
For an excitation intensity of 2 kW/cm2, we obtain average peak count rates of ≈104 counts/s. This value is comparable to rhodamine dyes under similar excitation conditions (27, 29) and indicates that GFP behaves similarly to an organic dye when in an emissive condition.
On–off Ratio as a Function of Excitation Intensity.
As demonstrated in Figs. 1–5, the fluorescence emission is not continuous but interrupted by long dark intervals. The presence of dark intervals points to the existence of an additional nonemissive state in the GFP-i.e., a three-level electronic system. In fact, most organic dyes are generally modeled by a three-level system, composed of the singlet ground and excited states and a triplet state. The singlet transitions give rise to fluorescence. Intersystem crossing from the singlet excited state to the triplet state is responsible for the quantum jumps from the emissive to the nonemissive condition. The lifetime of the triplet state determines the duration of the dark intervals, which for organic dyes varies from a few microseconds to tens of milliseconds (27, 28, 33). In the case of the GFP, the situation is different. Fluorescence correlation spectroscopy has recently shown that typical triplet-state lifetimes of the GFP are 5–25 μs (34, 35). The length of the dark periods observed by us and others (15–19) is on the order of seconds and indicates that the nonemissive state is different from the triplet state. Nevertheless, our observations at different excitation conditions prove that blinking is photoinduced, with dynamics that resemble that of the singlet-triplet system.
To understand the role of the GFP nonemissive state in the observed photodynamics, we analyzed the relative residence of the molecule in the emissive and nonemissive states at different excitation intensities. The data were analyzed as follows: for the same set of 140 molecules, the bright and dark intervals, Δton and Δtoff, were measured and the values were averaged for each subset of molecules with the same excitation conditions. The fractional on time, defined as Fon = 〈Δton〉/(〈Δton〉 + 〈Δtoff〉), was plotted against excitation intensity. 〈 〉 denotes the averaged value. The result is plotted in Fig. 6b, showing that Fon decreases dramatically with increasing excitation intensity.
Combining all data, we observe a burst count rate linearly increasing with excitation intensity (Fig. 6a) while the fractional on time decreases with excitation intensity (Fig. 6b). As a result the time-averaged fluorescence count rate does not increase with excitation intensity but rather saturates to a dark state limited value. At very high excitation intensity short bursts of Non photons are separated by long dark intervals of characteristic τoff, and the time-averaged fluorescence count rate saturates at Non/τoff photons/s.
The transition between the low excitation intensity linear response and the high excitation intensity saturated response occurs at a saturation excitation intensity Is, for which τon = τoff and
 |
2 |
Comparison with the burst count rate:
 |
3 |
gives
 |
4 |
and
 |
5 |
A fit of the data in Fig. 6b to Eq. 5 yields Is = 1.5 kW/cm2. The theoretical Fon(I) is also plotted in Fig. 6b. Excellent agreement between experiment and theory is obtained, validating the three-level model with a long-lived dark state. We note that in our analysis one has to assume 〈Δton〉 = τon, and 〈Δtoff〉 = τoff, which is indeed the case for the mono-exponential decays shown in Fig. 4. Furthermore, the transition efficiency from the emissive or bright (b) to the nonemissive, or dark (d) state Yb→d defined as the inverse of the average number of emitted photons during an on state, i.e., Yb→d = 1/Non, is calculated by using Eq. 2 with τoff = 1.6 s as extracted from the off-times histogram. The results render Yb→d ≈ 0.5 × 10⁻⁵. This transition yield is lower than intersystem crossing transitions to the triplet state of many organic molecules (27, 28). However, despite the low occurrence probability, the extremely long residence of the molecule in the dark state reduces the “effective” brightness of the chromophore.
General Model to Account for the on–off Blinking in GFP.
The observed single-molecule photodynamics of the S65T mutant revealed the existence of a long-lived dark state. In general, one can model the behavior of the GFP as a three-level system, where transitions from the singlet excited and ground states result in the emission of photons. For low excitation conditions, the number of emitted photons is proportional to the excitation intensity. There is, however, a small probability that while being in the excited state, the molecule makes a transition to the long-lived dark state D. During the time interval the molecule is in D there is no emission of fluorescence and the resultant signal appears as off-blinking. Only when the molecule returns to the singlet ground state and absorbs a new photon will fluorescence resume. The number of transitions to the dark state per second increases with increasing excitation intensity. The transition probability from a bright to a dark state is given by the inverse of the average number of emitted photons during the on state, whereas the residence time in D will be the off-blinking time.
The exact nature of the D state is, however, not known. Recent quantum chemical calculations by Weber et al. (26) support the concept that an additional zwitterionic Z form of the chromophore exists in the wt-GFP and a number of its mutants. The Z form would be responsible for the interruption of fluorescence observed in single-molecule experiments. This work, however, does not provide the time scale of the predicted dark intervals, and thus comparison with our experimental findings is not possible. Recent experimental data from Creemers et al. (14, 36) revealed the existence of at least three photointerconvertible forms of the wt-GFP, also present in red-shifted mutants, including S65T. Photointerconversions between different forms would correspond to the on–off blinking and switching observed at room temperature. More experiments at the single-molecular level and at low and room temperatures are needed to correlate the experimental data of Völker's group (36) with our findings. In particular, the off times, which we found to be intensity independent, should show a clear dependence on temperature if the height of the energy barriers between the ground states of the different forms is responsible for the lifetime of the long-lived dark state.
Conclusions.
We have combined NSOM and confocal microscopy to study the blinking behavior of the S65T mutant of the GFP. We performed single-molecule experiments at different excitation conditions and recorded real-time fluorescence trajectories over a large number of individual molecules. Time resolution in our experiments has been 100 μs, and continuous time trajectories have been recorded during 65 s, resulting in a dynamic range of more than 5 orders of magnitude. Our experiments show that on–off blinking in the GFP is photoinduced. We find experimental proof of the existence of a nonemissive state in the GFP that accounts for the long dark intervals in the fluorescence emission of the S65T mutant. We find a lifetime of the dark state of 1.6 ± 0.2 s, in agreement with the values found in other red-shifted mutants (16). Additionally, we calculate the transition yield from the emissive to the nonemissive state to be ≈0.5 × 10⁻⁵. Whether the long-lived dark state is due to photointerconversion between the three different forms existent in the GFP, or due to an additional nonfluorescent form, is still to be determined experimentally. From our experimental data we extract a saturation intensity of ≈1.5 kW/cm2. This value gives an indication for the best conditions on the efficient use of the protein in biological applications. In addition, our single-molecule data give an absorption cross section of 6.5 × 10⁻¹⁷ cm2 for the S65T mutant. Provided that the chromophore is in an emissive state, its emission rate is similar to that of most efficient fluorescent organic molecules, indeed making the GFP a useful marker in biology, provided it is exploited in its optimum way.
Acknowledgments
We are grateful to V. Subramaniam and T. M. Jovin in the Max Plank Institute for Biophysical Chemistry, Göttingen, for purified S65T-GFPs. We also thank S. Völker for fruitful discussions. We thank J. Korterik, K. O. van der Werf, F. B. Segerink, S. J. T. van Noort, W. H. J. Rensen, C. Otto, and L. Kuipers for assistance and helpful suggestions. The research of M.F.G.-P. has been made possible by a fellowship of the Royal Netherlands Academy of Arts and Sciences. J.-A.V. is supported by The Netherlands Foundation for Fundamental Research of Matter.
Abbreviations
- GFP
green fluorescent protein
- wt-GFP
wild-type GFP
- NSOM
near-field scanning optical microscopy
Footnotes
This paper was submitted directly (Track II) to the PNAS office.
References
- 1.Prasher D C, Eckenrode V K, Ward W W, Prendergast F G, Cormier M J. Gene. 1992;111:229–233. doi: 10.1016/0378-1119(92)90691-h. [DOI] [PubMed] [Google Scholar]
- 2.Chalfie M, Tu Y, Euskirchen G, Ward W W, Prasher D C. Science. 1994;263:802–805. doi: 10.1126/science.8303295. [DOI] [PubMed] [Google Scholar]
- 3.Chalfie M, Kain S, editors. Green Fluorescent Protein, Properties, Applications and Protocols. New York: Wiley–Liss; 1998. [Google Scholar]
- 4.Tsien R Y. Annu Rev Biochem. 1998;67:509–544. doi: 10.1146/annurev.biochem.67.1.509. [DOI] [PubMed] [Google Scholar]
- 5.Heim R, Prasher D C, Tsien R Y. Proc Natl Acad Sci USA. 1994;91:12501–12504. doi: 10.1073/pnas.91.26.12501. [DOI] [PMC free article] [PubMed] [Google Scholar]
- 6.Reid B G, Flynn G C. Biochemistry. 1997;36:6786–6791. doi: 10.1021/bi970281w. [DOI] [PubMed] [Google Scholar]
- 7.Chattoraj M, King B A, Bublitz G U, Boxer S G. Proc Natl Acad Sci USA. 1996;93:8362–8367. doi: 10.1073/pnas.93.16.8362. [DOI] [PMC free article] [PubMed] [Google Scholar]
- 8.Cubitt A B, Heim R, Adams S R, Boyd A E, Gross L A, Tsien R Y. Trends Biochem Sci. 1995;20:448–455. doi: 10.1016/s0968-0004(00)89099-4. [DOI] [PubMed] [Google Scholar]
- 9.Heim R, Cubitt A B, Tsien R Y. Science. 1995;373:663–664. doi: 10.1038/373663b0. [DOI] [PubMed] [Google Scholar]
- 10.Brejc K, Sixma T K, Kitts P A, Kain S R, Tsien R Y, Ormö M, Remington S J. Proc Natl Acad Sci USA. 1997;94:2306–2311. doi: 10.1073/pnas.94.6.2306. [DOI] [PMC free article] [PubMed] [Google Scholar]
- 11.Patterson G H, Knobel S M, Sharif W D, Kain S R, Piston D W. Biophys J. 1997;73:2782–2790. doi: 10.1016/S0006-3495(97)78307-3. [DOI] [PMC free article] [PubMed] [Google Scholar]
- 12.Lossau H, Kummer A, Heinecke R, Pöllinger-Dammer F, Kompa C, Jonsson T, Silva C M, Yang M M, Youvan D C, Michel-Beyerle ME, et al. Chem Phys. 1996;213:1–16. [Google Scholar]
- 13.Kummer A, Kompa C, Lossau H, Pöllinger-Dammer F, Michel-Beyerle M E, Silva C M, Bylina E J, Coleman W J, Yang M M, Youvan D C. Chem Phys. 1998;237:183–193. [Google Scholar]
- 14.Creemers T M H, Lock A J, Subramaniam V, Jovin T M, Völker S. Nat Struct Biol. 1999;6:557–560. doi: 10.1038/9335. [DOI] [PubMed] [Google Scholar]
- 15.Pierce D W, Hom-Booher N, Vale R D. Nature (London) 1997;388:338. doi: 10.1038/41009. [DOI] [PubMed] [Google Scholar]
- 16.Dickson R M, Cubitt A B, Tsien R Y, Moerner W E. Nature (London) 1997;388:355–358. doi: 10.1038/41048. [DOI] [PubMed] [Google Scholar]
- 17.Moerner W E, Peterman E J G, Brasselet S, Kummer S, Dickson R M. Cytometry. 1999;36:232–238. doi: 10.1002/(sici)1097-0320(19990701)36:3<232::aid-cyto13>3.0.co;2-l. [DOI] [PubMed] [Google Scholar]
- 18.Garcia-Parajo M F, Veerman J A, Segers-Nolten G M J, de Grooth B G, Greve J, van Hulst N F. Cytometry. 1999;36:239–246. doi: 10.1002/(sici)1097-0320(19990701)36:3<239::aid-cyto14>3.3.co;2-p. [DOI] [PubMed] [Google Scholar]
- 19.Peterman E J G, Brasselet S, Moerner W E. J Phys Chem A. 1999;103:10553–10560. [Google Scholar]
- 20.Moerner W E. Science. 1997;277:1059–1060. [Google Scholar]
- 21.Vanden Bout D A, Yip W-T, Hu D, Fu D-K, Swager T M, Barbara P F. Science. 1997;277:1074–1077. [Google Scholar]
- 22.Bopp M A, Jia Y, Li L, Cogdell R J, Hochstrasser R M. Proc Natl Acad Sci USA. 1997;94:10630–10635. doi: 10.1073/pnas.94.20.10630. [DOI] [PMC free article] [PubMed] [Google Scholar]
- 23.Nirmal M, Dabbousi B O, Bawendi M G, Macklin J J, Trautman J K, Harris T D, Brus L E. Nature (London) 1996;283:802–804. [Google Scholar]
- 24.Weiss S. Science. 1999;283:1670–1683. doi: 10.1126/science.283.5408.1670. [DOI] [PubMed] [Google Scholar]
- 25.Schwille P, Kummer S, Heikal A A, Moerner W E, Webb W W. Proc Natl Acad Sci USA. 2000;97:151–156. doi: 10.1073/pnas.97.1.151. [DOI] [PMC free article] [PubMed] [Google Scholar]
- 26.Weber W, Helms V, McCammon J A, Langhoff P W. Proc Natl Acad Sci USA. 1999;96:6177–6182. doi: 10.1073/pnas.96.11.6177. [DOI] [PMC free article] [PubMed] [Google Scholar]
- 27.Ha T, Enderle T, Chemla D S, Selvin P R, Weiss S. Chem Phys Lett. 1997;271:1–5. [Google Scholar]
- 28.Veerman J A, Garcia-Parajo M F, Kuipers L, van Hulst N F. Phys Rev Lett. 1999;83:2155–2158. doi: 10.1103/PhysRevLett.85.5312. [DOI] [PubMed] [Google Scholar]
- 29.Garcia-Parajo M F, Veerman J-A, van Noort S J T, de Grooth B G, Greve J, van Hulst N F. Bioimaging. 1998;6:43–53. [Google Scholar]
- 30.Veerman J A, Otter A M, Kuipers L, van Hulst N F. Appl Phys Lett. 1998;72:3115–3117. [Google Scholar]
- 31.Ruiter A G T, Veerman J A, Garcia-Parajo M F, van Hulst N F. J Phys Chem A. 1997;101:7318–7321. [Google Scholar]
- 32.Xie X S, Trautman J K. Annu Rev Phys Chem. 1998;49:441–480. doi: 10.1146/annurev.physchem.49.1.441. [DOI] [PubMed] [Google Scholar]
- 33.Weston K D, Carson P J, DeAro J A, Buratto S K. Chem Phys Lett. 1999;308:58–64. [Google Scholar]
- 34.Visser A J W G, Hink M A. J Fluoresc. 1999;9:81–84. [Google Scholar]
- 35.Widengren J, Mets U, Rigler R. Chem Phys. 1999;250:171–186. [Google Scholar]
- 36.Creemers T M H, Lock A J, Subramaniam V, Jovin T M, Völker S. Proc Natl Acad Sci USA. 2000;97:2974–2978. doi: 10.1073/pnas.050365997. [DOI] [PMC free article] [PubMed] [Google Scholar]


