

Abstract
MADS-box transcription factors are key regulators of several plant development processes. Analysis of the complete Arabidopsis genome sequence revealed 107 genes encoding MADS-box proteins, of which 84% are of unknown function. Here, we provide a complete overview of this family, describing the gene structure, gene expression, genome localization, protein motif organization, and phylogenetic relationship of each member. We have divided this transcription factor family into five groups (named MIKC, Mα, Mβ, Mγ, and Mδ) based on the phylogenetic relationships of the conserved MADS-box domain. This study provides a solid base for functional genomics studies into this important family of plant regulatory genes, including the poorly characterized group of M-type MADS-box proteins. MADS-box genes also constitute an excellent system with which to study the evolution of complex gene families in higher plants.
INTRODUCTION
The completion of the Arabidopsis genome sequence (Arabidopsis Genome Initiative, 2000) and the identification of its complement of 26,000 genes has focused our attention on functional analysis. Historically, Arabidopsis gene function has been deduced from forward genetic experiments, in which mutants with interesting phenotypes were studied to reveal the genetic defects involved. Because we now have a plethora of genes, it has become increasingly attractive to make use of the many available reverse genetic screens (Galbiati et al., 2000; Marsch-Martinez et al., 2002; Samson et al., 2002) to isolate a mutant. Many criteria are used to prioritize genes for reverse genetic analysis, including the discovery of informative phenotypes in mutants of related genes.
Transcription factors are important regulators of cellular processes, and the complexity of living organisms necessitates a large number of transcription factors. Several large families of transcription factors exist in plants, each with 100 or more members (Riechmann and Ratcliffe, 2000). Members of the MADS-box family are known to be involved predominantly in developmental processes. Seventeen Arabidopsis loss-of-function mutants have been described and studied in detail; these affect flowering time (SUPPRESSOR OF OVEREXPRESSION OF CONSTANS1 [SOC1; Samach et al., 2000], FLOW–ERING LOCUS C [FLC1; Michaels and Amasino, 1999], AGAMOUS-LIKE24 [AGL24; Michaels et al., 2003], MADS AFFECTING FLOWERING1/FLOWERING LOCUS M [MAF1/FLM; Ratcliffe et al., 2001; Scortecci et al., 2001], and SHORT VEGETATIVE PHASE [SVP; Hartmann et al., 2000]), the determination of floral meristem identity (APETALA1 [AP1; Mandel et al., 1992], FRUITFULL [FUL; Gu et al., 1998], and CAULIFLOWER [CAL; Bowman et al., 1993]), floral organogenesis (AP1, SEPALLATA [SEP1 to SEP3; Pelaz et al., 2000], APETALA3 [AP3; Jack et al., 1992], PISTILLATA [PI; Goto and Meyerowitz, 1994], and AGAMOUS [AG; Yanofsky et al., 1990]), fruit formation (SHATTERPROOF [SHP1 and SHP2; Liljegren et al., 2000] and FUL), and seed pigmentation and endothelium development (TRANSPARENT TESTA16; Nesi et al., 2002).
The best studied plant MADS-box transcription factors are those involved in floral organ identity determination. Analysis of homeotic floral mutants resulted in the formulation of a genetic model, named the ABC model, that explains how the combined functions of three classes of genes (A, B, and C) determine the identity of the four flower organs (reviewed by Coen and Meyerowitz, 1991). Arabidopsis has two A-class genes (AP1 and AP2 [Bowman et al., 1989]), two B-class genes (PI and AP3), and a single C-class gene (AG), of which only AP2 is not a MADS-box gene. Recently, it was shown that the Arabidopsis B- and C-function genes, which control petal, stamen, and carpel development, are functionally dependent on three highly similar MADS-box genes, SEP1, SEP2, and SEP3 (Pelaz et al., 2000). Interestingly, only when mutant knockout alleles of the three SEP genes were combined in a triple sep1 sep2 sep3 mutant was loss of petal, stamen, and carpel identity observed, resulting in a flower composed of only sepals. This example shows that redundancy occurs in the MADS-box gene family, which complicates reverse genetic strategies for gene function analysis. The SHP genes provide another example of MADS-box gene redundancy. shp1 and shp2 single mutants do not exhibit any phenotypic effect, whereas in the double mutant, development of the dehiscence zone is disturbed in the fruit, resulting in a failure to release seeds (Liljegren et al., 2000).
Judging from the broad variety of MADS-box factor functions in Arabidopsis and in many other plant species (Colombo et al., 1997; Kater et al., 2001; Fornara et al., 2003) and from the phylogenetic analyses of MIKC-type MADS-box genes (Purugganan et al., 1995; Theißen et al., 1996; Münster et al., 1997), it is very likely that this family played a significant role in the evolution of plants.
To date, detailed analysis of MADS-box proteins has been restricted to the MIKC type, which have a characteristic modular structure. From the N to the C terminus of the protein, four characteristic domains can be identified: the MADS-box (M), intervening (I), keratin-like (K), and C-terminal (C) domains. The MADS-box is a DNA binding domain of ∼58 amino acids that binds DNA at consensus recognition sequences known as CArG boxes [CC(A/T)6GG] (Hayes et al., 1988; Riechmann et al., 1996b). The interaction with DNA has been studied in detail for the human and yeast MADS-box proteins thanks to the resolved crystal structures (Pellegrini et al., 1995; Santelli and Richmond, 2000). The I domain is less conserved and contributes to the specification of dimerization. The K domain is characterized by a coiled-coil structure, which facilitates the dimerization of MADS-box proteins (Davies et al., 1996; Fan et al., 1997). The C domain is the least conserved domain; in some cases, it has been shown to contain a transactivation domain or to contribute to the formation of multimeric MADS-box protein complexes (Egea-Cortines et al., 1999; Honma and Goto, 2001).
Recently, a phylogenetic analysis was performed by Alvarez-Buylla et al. (2000) that included 44 Arabidopsis MADS-domain sequences and several MYOCYTE ENHANCER FACTOR2-like (MEF2) and SERUM RESPONSE FACTOR-like (SRF) MADS-box domains from fungi and animals. Their analysis suggests that a gene duplication occurred before the divergence of plants and animals, giving rise to two main lineages of MADS-box genes: type I and type II. The MIKC-type MADS-box proteins, together with MEF2-like proteins, form the type-II lineage. Type-I MADS-box transcription factors group together with SRF-like domain proteins; interestingly, these Arabidopsis MADS-box factors do not have the typical K domain found in the plant MIKC-type proteins.
Using a MADS-box domain consensus sequence for a Basic Local Alignment Search Tool (BLAST) search against the entire Arabidopsis genome, we revealed the presence of 107 MADS-box genes. We have analyzed the full extent of the MADS-box gene family in Arabidopsis, resequenced and named the new putative members according to the standard AGL nomenclature, and completed a preliminary expression analysis for the entire family. We have subdivided the new MADS-box proteins together with those characterized previously into five groups based on their phylogenetic relationships in the conserved MADS-box domain. Strikingly, all of the known mutant phenotypes, which account for 16% of the total, cluster in a single group. These findings are discussed with respect to the evolution and function of plant MADS-box genes, redundancy within the family, and their implications for the choice of gene targets for reverse genetic analysis.
RESULTS
Gene Identification and Isolation of Coding Sequences
To isolate the full complement of MADS-box genes in Arabidopsis, we exploited a hidden Markov model (Eddy, 1998) that produces a profile out of a multiple sequence alignment of the conserved regions by creating a position-specific scoring matrix, which then can be used to find remote homologs in sequence databases. It has been noted previously that profile methods are able to retrieve remote homologs and that they are approximately three times more efficient than pair-wise comparisons (Park et al., 1998). Using the HMMER 2.1.1 software package, a profile for MADS-box proteins was built (see Methods). This pattern then was used to find new members of the family in the Arabidopsis genome. Only hits with E values of <1 were considered to be members of the family. This screen resulted in the identification of 107 MADS-box sequences comprising 17 previously functionally characterized genes (see above) and another 27 genes reported elsewhere (for review of the genes, see Alvarez-Buylla et al., 2000). The protein sequences of the new putative MADS-box proteins were aligned and checked manually for false positives. We used the AGL acronym to name the new members (see supplemental data online).
To isolate the coding sequences of all of the new MADS-box genes, a pair of gene-specific primers was designed (see supplemental data online) for each MADS-box gene and used in PCRs with cDNAs synthesized using RNA extracted from various tissues (see Methods). AGL61, AGL69, AGL77, AGL94, AGL95, and AGL103 coding sequences could not be amplified under the experimental conditions tested. Several clones obtained from PCR amplification were analyzed to reveal all of the coding sequences in cases of high sequence identity among closely related genes, which prohibited the use of gene-specific primer pairs. The PCR fragments were sequenced and compared with the predicted coding sequences in the GenBank database. Where a discrepancy was found with the Arabidopsis Genome Initiative (2000) annotations, such as different 5′ and 3′ intron splicing sites, number of introns, or open reading frame predictions, a new accession number was acquired for the coding sequences. Where splicing variants were found, a new accession number also was given. In total, 21 differences (19.6% of the genes) between the Arabidopsis Genome Initiative (2000) predictions of open reading frames and the amplified coding sequences were identified, and splicing variants were detected for six genes (5.6%) (see supplemental data online).
Phylogenetic Analysis of the Arabidopsis MADS-Box Gene Family
An alignment of full-length predicted MADS-box proteins was constructed using CLUSTAL W (Thompson et al., 1994) and refined manually. However, for the initial analyses, only the highly conserved MADS-box domain was considered, because it is the only region that could be aligned unambiguously between all MADS-box proteins. Phylogenetic analysis within the Baysian framework (see Methods) indicated that the MADS-box family of genes from Arabidopsis consists of five subfamilies of more closely related sequences, named here Mα (25 genes), Mβ (20 genes), Mγ (16 genes), Mδ (6 genes), and MIKC (39 genes). Only one gene, AGL33, could not be assigned to any of the five groups formed. Distance bootstrap analyses (see Methods) also were performed on the MADS-box domains of a restricted data set of 39 sequences drawn from each of the five groups of sequences recovered by the initial Baysian analysis, and this data set included AGL33. These results are shown schematically in Figure 1. Baysian and distance bootstrap analyses were performed on the maximum number of alignable amino acids within each of these subfamilies. The results of these analyses are shown in Figures 2 to 6, in which subtrees are rooted on the basal branches recovered by the analysis of the 107-taxa, 58–amino acid data set. In each case, the tree shown is the Bayesian tree, with distance bootstrap proportions shown at appropriate nodes.
Figure 1.

Phylogenetic Analysis of MADS-Box–Containing Proteins of Arabidopsis.
Scheme depicting the relationships of major clades of MADS domain–containing proteins in Arabidopsis. The topology was estimated by analysis of the MADS-box (58 unambiguously aligned residues) using the program MrBayes (Huelsenbeck, 2000). Bootstrap proportions were derived from quartet-puzzling bootstrap analysis of 39 representative sequences drawn from across the clades recovered by the initial Bayesian analysis (see Methods).
Figure 2.

An Analytical View of the Mα Group of the Arabidopsis MADS-Box Gene Family.
The following parts are shown from left to right. Protein maximum likelihood tree: The tree was constructed in the Bayesian framework using MrBayes software (Huelsenbeck, 2000) under the jtt substitution model with a γ distribution to accommodate differences of substitution rates between sites. Bootstrap proportions were calculated using programs within the PHYLIP package (Felsenstein, 1989). Expression pattern: The gene expression has been determined by RT-PCR using pairs of gene-specific primers. A positive signal is indicated by a colored box for the following tissues: brown for roots (R), green for rosette leaves (L), yellow for inflorescences (I), and red for siliques (S). The white box indicates that no expression could be detected. Gene structure: The gene structure is presented by blue exon(s) and spaces between the blue boxes correspond to introns. The sizes of exons and introns can be estimated using the vertical lines. Protein structure: The search for the common motifs shared among the MADS-box proteins of each group was done with MEME (see Methods). The output of the analysis is schematically represented here. Each colored box represents a new motif. A white box present in an otherwise continuing sequence of colored boxes means a deletion of an amino acid sequence at the specific position. Black bars represent an amino acid sequence not showing any significant homology to other amino acid sequences within the group of proteins. The length of the motif can be estimated using the scale at top. aa, amino acids.
Figure 6.

An Analytical View of the MIKC Group of the Arabidopsis MADS-Box Gene Family.
The following parts are shown from left to right. Protein maximum likelihood tree: The tree was constructed as described in Figure 2. Expression pattern: The gene expression has been determined by RT-PCR using pairs of gene-specific primers. A positive signal is indicated by a colored box for the following tissues: brown for roots (R), green for rosette leaves (L), yellow for inflorescences (I), and red for siliques (S). The white box indicates that no expression could be detected. The detection method for the expression of genes published previously (#) is marked as follows: §, in situ hybridization; ϕ, RNA gel blot analysis; ξ, RT-PCR (see supplemental data online). Gene structure: The gene structure is presented by blue exon(s) and spaces between the blue boxes correspond to introns. The sizes of exons and introns can be estimated using the vertical lines. Protein structure: Each colored box represents a new motif. A white box present in an otherwise continuing sequence of colored boxes means a deletion of an amino acid sequence at the specific position. Black bars represent an amino acid sequence not showing any significant homology to other amino acid sequences within the group of proteins. The length of the motif can be estimated using the scale at top. aa, amino acids.
To confirm the coherence of the new clades suggested here, we performed Bayesian phylogenetic analysis on a selection of MADS-box domains from Arabidopsis and rice. These analyses suggest that the gene duplications that gave rise to the Mα, Mβ Mγ, Mδ, and MIKC clades occurred before the divergence of monocots and dicots (Figure 7).
Figure 7.

Relationships between Arabidopsis and Rice MADS-Box Proteins.
Phylogenetic analysis of 58 conserved amino acid residues from the MADS-box domain in representative sequences from Arabidopsis and rice. The tree was constructed using the program MrBayes (Huelsenbeck, 2000), and the support values shown are Bayesian posterior probabilities. Branches with <50% support have been collapsed to give polytomies. Rice proteins are indicated in blue. Detailed information about the rice sequences used in this analysis is given in the supplemental data online.
The phylogenetic distribution of rice sequences supported the existence of the five groups of angiosperm MADS-box genes suggested here. In fact, for the Mα, Mγ, Mδ, and MIKC clades, rice proteins could be identified that are monophyletic with the Arabidopsis sequences (Figure 7). Although we have not identified Mβ sequences in the rice genome, the tree indicates that the gene duplication that gave rise to the Mβ and Mγ clades occurred before the divergence of monocots and dicots. More extensive analyses will have to be performed to confirm whether the Mβ group has been lost from the rice genome or indeed from all monocot genomes.
One striking pattern that emerged from our analyses was that many gene duplications within the MIKC group could be demonstrated to have occurred in a common ancestor of rice and Arabidopsis. Thus, it may be possible to identify orthologous MIKC genes in these species. However, our phylogenetic reconstructions suggest that within the Mα, Mγ, and probably Mδ groups, expansion of the gene families may be lineage specific.
MADS-Box Gene Expression Analysis
Expression of a selection of 24 new MADS-box genes belonging to the Mα (AGL23, AGL28, AGL40, AGL60, AGL61, and AGL62), Mβ (AGL43, AGL47, AGL51, AGL54, AGL76, AGL78, AGL81, and AGL89), Mγ (AGL34, AGL37, and AGL80), Mδ (AGL66 and AGL104), and MIKC (TT16, AGL42, AGL72, AGL63, and AGL79) groups was examined by RNA gel blot analysis using RNA or mRNA samples or by in situ hybridization.
Surprisingly, in RNA gel blot analysis, a clear signal was detected for only two genes, AGL30 and AGL80 (Figures 8A and 8B). Gene expression also was difficult to detect using in situ hybridization, which was performed for AGL34, AGL37, AGL63, AGL66, and AGL104, coding sequences of which had been amplified previously by reverse transcriptase–mediated (RT) PCR in the inflorescence or silique. AGL80, which had given a specific signal in RNA gel blot analysis, was included as a positive control. Detectable expression was observed only in the case of AGL104 and the positive control, AGL80 (Figures 9A to 9C). Expression of all of the other genes was too low to be detected by in situ hybridization.
Figure 8.

RNA Gel Blot Analysis of New MADS-Box Gene Expression.
Gene expression was analyzed using 5 μg of total RNA isolated from wild-type Arabidopsis plants grown under long-day conditions. Expression was detected for two genes: AGL30 (A) and AGL80 (B). As a loading control, the blots were reprobed with ACTINE fragments from Arabidopsis (bottom gels) (see Methods). Arrows indicate the sizes of the bands of the hybridizing ladder. M, 1-kb DNA ladder (Invitrogen); L, rosette leaf; I, inflorescence; S, silique; 0, silique at 0 days after pollination.
Figure 9.
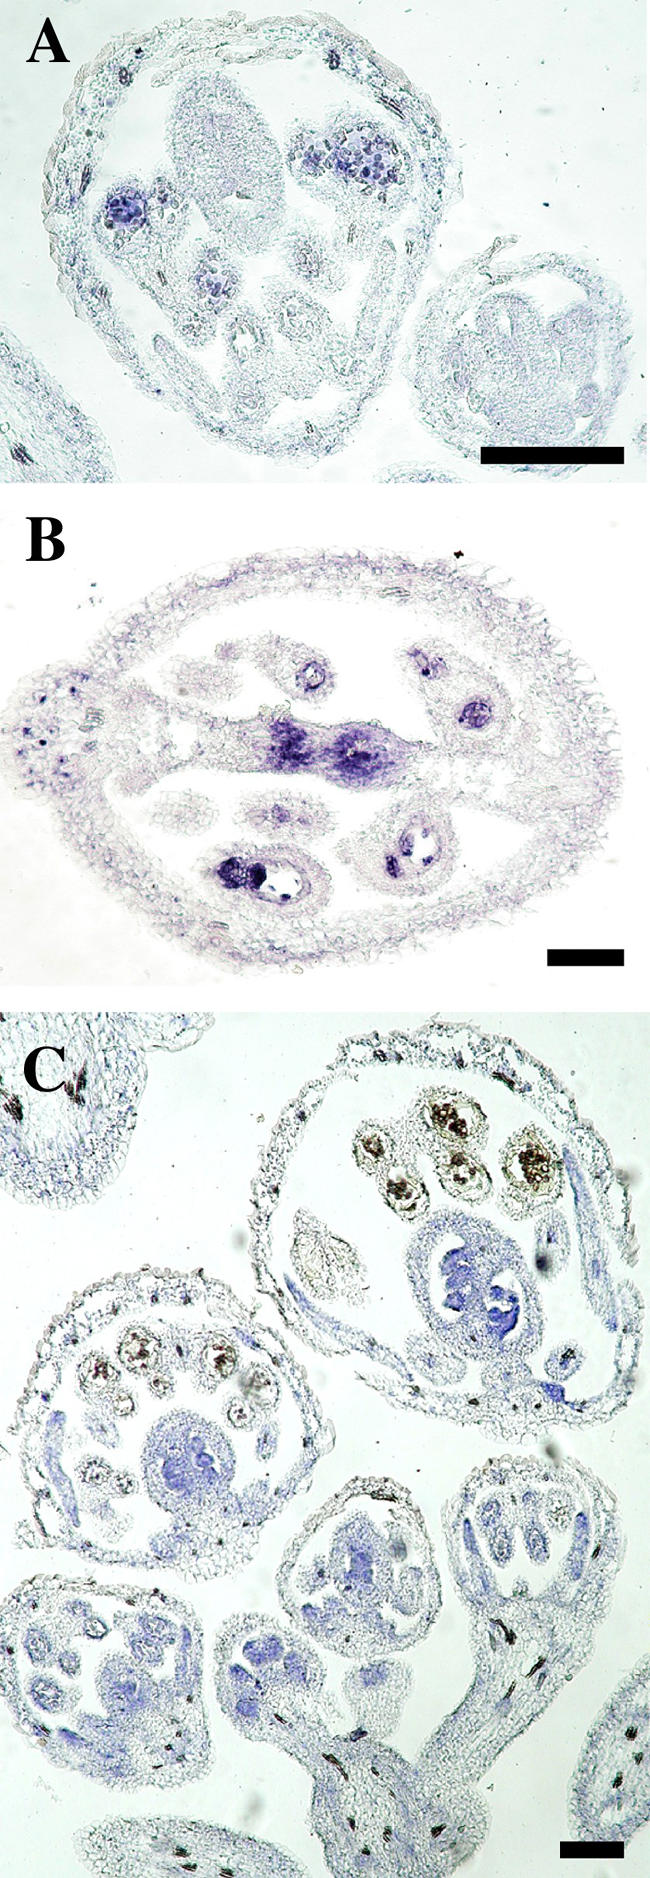
AGL80 and AGL104 Expression Analyzed by in Situ Hybridization.
(A) Arabidopsis stage-9 flower. AGL80 expression is detected in early postmeiotic microspores.
(B) Arabidopsis stage-12 to -13 flower. AGL80 expression is observed in the transmitting tract and the nucellus.
(C) Section hybridized with AGL104 antisense RNA. In an early stage-3 flower, AGL104 expression is detected inside of whorl 1, whereas in older flowers, it is detected in young developing anthers, in petals, and within carpels (septum and developing ovules).
Bars = 50 μm.
Therefore, an RT-PCR approach was chosen to monitor the expression of the newly identified MADS-box genes. This approach also was used to isolate the coding sequences and was completed here using cDNAs from four types of tissue (root, leaf, inflorescence, and silique) and with the primers specific for each gene (see Methods and supplemental data online). The RT-PCR expression data was compiled with data from previously published expression analyses for 30 MADS-box genes, and the results are presented in Figures 2 to 6. Expression was detected for 101 of the 107 MADS-box genes under standard growth conditions in one or more of the four tissues tested (Figures 2 to 6).
Gene Structure and Duplication
The MADS-box family shows a very striking bimodal distribution of introns, with the MIKC and Mδ groups containing multiple introns and the Mα, Mβ, and Mγ groups usually having no introns or a single intron (Figures 2 to 6). Candidate MADS-box genes identified from the rice genome sequence also showed this bimodal distribution of introns, with Mδ and MIKC genes having many introns and Mα and Mγ genes having no introns. This distribution could be explained by a differential tendency to lose or acquire introns or by a reverse-transcribed origin for the ancestors of the Mα, Mβ, and Mγ groups. The different groups also show a differential distribution in the Arabidopsis genome. The MIKC genes are distributed evenly across all five chromosomes, whereas genes from the other groups are located mainly on chromosomes I and V (Figure 10). These two chromosomes account for ∼48% of the genome (Arabidopsis Genome Initiative, 2000) and carry 49% of the MIKC genes, whereas they contain 71 to 83% of the genes from groups Mα, Mβ, Mγ, and Mδ. In eukaryotic transcription factor families, duplications occurred predominantly between different chromosomes (Riechmann et al., 2000). In this respect, the MIKC and Mα, Mβ, Mγ, and Mδ groups also differ. Analysis of closely related genes indicates that 53% of the MIKC group probably originated from duplications between two different chromosomes, whereas 82% of the others can be traced back to internal chromosome duplications. This difference suggests that diversity originated more recently in the Mα, Mβ, Mγ, and Mδ groups than in the MIKC group because, in other eukaryotes, recent duplication occurred more frequently within chromosomes (Lynch and Conery, 2000). In the case of the Mδ group, the significance of these data must be balanced against its very small size.
Figure 10.

Distribution of the Members of the MADS-Box Gene Family in the Arabidopsis Genome.
MADS-box genes are plotted according to their sequence positions along the five chromosomes. Genes located in close proximity to one another cannot be plotted individually and are listed according to their relative positions. Genes from the five groups are represented by different colors (MIKC, blue; M α, pink; M β, green; M γ, red; and M δ, orange). Genes present in chromosome segments affected by large duplications are boxed together. Each box corresponds to a single chromosome fragment. Asterisks indicate that there is a related gene in the duplicated segment. Tandem repeated genes (closely related genes that flank each other directly) are joined by thick black lines. Closely related genes separated by a maximum of three unrelated genes are joined by thick blue lines.
Duplications of parts of chromosomes have been reported in the Arabidopsis genome (Arabidopsis Genome Initiative, 2000; Vision et al., 2000; Simillion et al., 2002), and 81 MADS-box genes lie within these regions. Only 24 of these genes have a clear relative in the duplicated segment (Figure 10). This finding is in agreement with the expected rapid loss of one of the copies (Lynch and Conery, 2000). However, of the 24 retained genes, 17 belong to the MIKC group and 3 belong to the small (6 genes) Mδ group, suggesting that they were retained more frequently than duplicated genes from the other groups. Most of these duplications occurred at least 75 million years ago (Arabidopsis Genome Initiative, 2000; Vision et al., 2000; Simillion et al., 2002), and the maintenance of both gene copies implies a positive selection. Alternatively, this difference could be explained if many duplications at the origin of Mα, Mβ, and Mγ genes occurred after the polyploidization event(s) assumed to be responsible for most chromosome duplication. However, assessing this hypothesis will require further analysis.
Thus, the different groups of MADS-box genes appear to have evolved according to unrelated patterns of duplication that may reflect different evolutionary constraints. Such constraints may be linked to the functions controlled by the different groups (Shimeld, 1999).
Protein Sequence Analysis: Identification of Common Motifs
To discover motifs shared among related proteins within the newly formed Mα, Mβ, Mγ, and Mδ groups, we used MEME (Multiple Expectation Minimization for Motif Elicitation) version 2.2 (Bailey and Elkan, 1994), which performs motif searches in groups of related DNA or protein sequences. The search was performed separately for each of the four groups of proteins (see Methods and supplemental data online). The MIKC group of proteins was used as a control testing set to reliably compare the output of the analysis.
SMART (Simple Motif Architecture Research Tool) version 3.4 (Schultz et al., 1998; Letunic et al., 2002) was used to annotate the motifs found by MEME. This World Wide Web–based resource is able to recognize >500 domains assigned to different types of proteins. The results are presented schematically in Figures 2 to 6.
As expected, the MIKC proteins exhibit common structural features, represented here by four shared boxes: yellow, red, blue, and green (Figure 6). The results of the SMART analysis indicate that the yellow box corresponds to the MADS-box domain and that the entire region from the C terminus of the red box to the C terminus of the green box corresponds to the K domain. Thus, the remaining part of the red box represents the I region and all sequences C terminal to the green box constitute the C-terminal domain, which is not well conserved except between closely related proteins within the group (Figure 6). The only exception to this “MIKC structural conservation” is found in AGL63, the most divergent protein of the MIKC type (Figure 6), in which the presence of the K domain was not confirmed by SMART.
Almost all of the other proteins grouped in Mα, Mβ, Mγ, and Mδ share only the MADS domain with MIKC members. The exceptions are AGL88 and AGL85 (Mα), AGL105 (Mβ), and AGL95 (Mγ), which do not contain the entire MADS-box domain. This domain is ∼58 amino acids long in all groups with the exception of Mβ. In Mβ, the N-terminal part of the MADS-box domain is not conserved, and it contains a sequence unrelated to the highly conserved MADS-box consensus sequence (see supplemental data online) (Shore and Sharrocks, 1995). Although in the case of the MIKC and Mδ proteins, the MADS box (58 amino acids) is defined by a single motif (the yellow box), in the other groups, this conserved region spans two motifs, the yellow box and the N-terminal part of subsequent motif (Figures 2 to 6). This finding shows that the C-terminal part of the MADS-box domain in the Mα, Mβ and Mγ groups is more divergent. C terminal to the MADS-box domain, each of the groups shows a different motif profile, and none of these motifs can be annotated using SMART. However, in some of the proteins, a coiled-coil structure was detected by SMART (see supplemental data online).
The schemes of the protein motifs of the individual members of the MADS-box family clearly demonstrate structural similarities among the proteins within one group and show characteristic but different patterns for each of the five groups defined. Although the Mα proteins show two common motifs, the MADS box and the pink motif (Figure 2), they are otherwise highly divergent. The majority of the Mγ proteins are similar in the N-terminal 150–amino acid region (Figure 4), and the Mβ proteins demonstrate almost identical motif composition for the members of the individual subclades (Figure 3). As demonstrated experimentally for the MIKC group members (Davies et al., 1996; Krizek and Meyerowitz, 1996; Riechmann et al., 1996a, 1996b), the commonly shared motifs tend to be of functional and structural importance. It will be interesting to characterize the functions of the common motifs within the newly designated groups in relation to the functions of these genes.
Figure 4.

An Analytical View of the Mγ Group of the Arabidopsis MADS-Box Gene Family.
The following parts are shown from left to right. Protein maximum likelihood tree: The tree was constructed as described in Figure 2. Expression pattern: The gene expression has been determined by RT-PCR using pairs of gene-specific primers. A positive signal is indicated by a colored box for the following tissues: brown for roots (R), green for rosette leaves (L), yellow for inflorescences (I), and red for siliques (S). The white box indicates that no expression could be detected. Gene structure: The gene structure is presented by blue exon(s) and spaces between the blue boxes correspond to introns. The sizes of exons and introns can be estimated using the vertical lines. Protein structure: Each colored box represents a new motif. A white box present in an otherwise continuing sequence of colored boxes means a deletion of an amino acid sequence at the specific position. Black bars represent an amino acid sequence not showing any significant homology to other amino acid sequences within the group of proteins. The length of the motif can be estimated using the scale at top. aa, amino acids.
Figure 3.

An Analytical View of the Mβ Group of the Arabidopsis MADS-Box Gene Family.
The following parts are shown from left to right. Protein maximum likelihood tree: The tree was constructed as described in Figure 2. Expression pattern: The gene expression has been determined by RT-PCR using pairs of gene-specific primers. A positive signal is indicated by a colored box for the following tissues: brown for roots (R), green for rosette leaves (L), yellow for inflorescences (I), and red for siliques (S). The white box indicates that no expression could be detected. Gene structure: The gene structure is presented by blue exon(s) and spaces between the blue boxes correspond to introns. The sizes of exons and introns can be estimated using the vertical lines. Protein structure: Each colored box represents a new motif. A white box present in an otherwise continuing sequence of colored boxes means a deletion of an amino acid sequence at the specific position. Black bars represent an amino acid sequence not showing any significant homology to other amino acid sequences within the group of proteins. The length of the motif can be estimated using the scale at top. aa, amino acids.
DISCUSSION
Annotation of the Arabidopsis MADS-Box Family
Although the annotation of genes has progressed rapidly since the publication of the Arabidopsis genome sequence at the end of 2000, a large percentage of genes still remain unclassified. Here, we demonstrate the advantage of using a hidden Markov model profile search to reveal remote homologs of a gene of interest and to assign such sequences to a specific protein class. In total, 107 Arabidopsis MADS-box genes were isolated using this approach, allowing us to increase the predicted size of this gene family (Riechmann et al., 2000) by 30%.
Amplification of these coding sequences by RT-PCR and sequencing of these products turned out to be an important step, because 19.6% of the predicted open reading frames in the database were incorrect (here, we refer to the predictions by the Arabidopsis Genome Initiative [2000] group, because they can differ based on the database of reference [i.e., they are different in some cases in the MIPS database]). It became evident that for most of the newly identified MADS-box genes, no ESTs were present in the database, probably as a result of their low expression levels, as shown here.
Although the gene expression analysis showed that 94% of the MADS-box genes are transcribed, it is possible that not all of the new MADS-box genes are functional. As seen in Figures 2 to 5, several of the new MADS-box proteins are missing part of the MADS-box domain or terminate a short distance after it. It is possible that these genes are pseudogenes whose transcriptional activity is maintained. However, we cannot exclude the possibility that these expressed, truncated transcription factors play a role, positive or negative, in gene regulation.
Figure 5.

An Analytical View of the Mδ Group of the Arabidopsis MADS-Box Gene Family.
The following parts are shown from left to right. Protein maximum likelihood tree: The tree was constructed as described in Figure 2. Expression pattern: The gene expression has been determined by RT-PCR using pairs of gene-specific primers. A positive signal is indicated by a colored box for the following tissues: brown for roots (R), green for rosette leaves (L), yellow for inflorescences (I), and red for siliques (S). The white box indicates that no expression could be detected. Gene structure: The gene structure is presented by blue exon(s) and spaces between the blue boxes correspond to introns. The sizes of exons and introns can be estimated using the vertical lines. Protein structure: Each colored box represents a new motif. A white box present in an otherwise continuing sequence of colored boxes means a deletion of an amino acid sequence at the specific position. Black bars represent an amino acid sequence not showing any significant homology to other amino acid sequences within the group of proteins. The length of the motif can be estimated using the scale at top. The AGL33 gene and protein structure is depicted together with this group because it shows the highest amino acid sequence similarity of the MADS-box with the Mδ group. aa, amino acids.
The number of potential MADS-box proteins can be increased by splicing variants of single gene transcripts, as demonstrated here for several members of the family. This phenomenon is well known for the human MEF2 genes: particular MEF2 isoforms are detected predominantly in muscle cells (Shore and Sharrocks, 1995). It will be interesting to determine if a cell- or tissue-specific accumulation of one type of MADS-box gene splice variant also occurs in plants.
Origin of the Arabidopsis MADS-Box Family
It has been suggested previously that the Arabidopsis MADS-box genes can be divided into two groups, type I (SRF-like) and type II (MEF2-like) (Alvarez-Buylla et al., 2000), based on their sequence similarity in the MADS-box domain with animal and fungal MADS-box proteins. It was proposed that both types of genes already existed before the divergence of plants and animals/fungi. Our data are consistent with this ancestral division of the MADS-box gene family into two distinct types. However, contrary to the suggestion of Alvarez-Buylla et al. (2000), our analyses suggested a specific relationship between the Mδ sequences and the MIKC genes. On the basis of these analyses and the shared gene structure, we tentatively assign the Mδ genes to the type-II group.
On the basis of gene duplications, we suggest a further division of angiosperm type-I and type-II MADS-box genes into five distinct groups. Within the type-I family, at least two gene duplications appear to have occurred. We have designated the resulting clades Mα, Mβ, and Mγ. Our phylogenetic reconstructions using rice sequences indicate that additional gene duplications within the Mα and Mγ clades may have occurred predominantly after the divergence of monocots and dicots, because rice and Arabidopsis Mα and Mγ groups emerged as sisters in the tree. Given the paucity of functional information regarding genes within these clades, either from rice or Arabidopsis, it is difficult to speculate on evolutionary conservation of function within these groups. Our analyses also suggest that Mβ genes may not have been retained in the rice genome. Therefore, this group might be specific to the dicot lineage, although more extensive analysis of the rice genome sequence is needed to confirm this idea.
Confirmation of the relative timing of MADS-box family expansion within plants must await comparative analysis of MADS-box genes from more primitive plants. However, the results of such analyses are unlikely to alter our conclusions at least with regard to MADS-box diversity in angiosperms.
With respect to our analysis of Arabidopsis MADS-box sequences, bootstrap support for the coherence of and relationships between the diverse clades of MADS box–containing proteins (including the well-established MIKC group) was moderate. The low support for the coherence of the MIKC clade resulted from a tendency of some Mδ sequences to be recovered within the MIKC clade in some bootstrap replicates. The overall tendency for bootstrap values for the coherence of clades to be low in the global MADS-box analysis is not entirely unexpected, given the high degree of conservation and the short length of the domain.
Within several of the clades of sequences defined here, notably MIKC and Mβ, bootstrap partitions for some relationships are rather low. In Mβ, this lack of resolution is attributable to the high degree of conservation of many sequences. This similarity is supported by the large number of conserved sequence motifs recovered by MEME. In the MIKC group of proteins, the situation is more complicated. It is notable that low bootstrap support values tend to be associated with branches leading to divergent sequences (those with long terminal branch lengths). This phenomenon is associated with the different properties of the Bayesian method used to estimate the tree and the distance method used to calculate bootstrap partitions. The Bayesian method, like related likelihood methods, is less affected by the artifact of “long branch attraction,” whereby divergent sequences tend to cluster together basally of their true positions in phylogenetic reconstructions. The distance reconstruction used for bootstrap analysis is rather sensitive to this problem and tends to recover topologies in which divergent sequences cluster together at the base of the tree (Felsenstein, 1978; Huelsenbeck, 1997). The relative lack of corroborating conserved domains associated with the sequences in question both supports their divergence and precludes strong conclusions regarding their correct placement within the clade. However, although the conclusions derived from the Bayesian and distance bootstrap methods used here differ slightly with respect to specific relationships between sequences, the coherence of major clades was preserved by both tree reconstruction methods considered.
The MIKC, Mα, Mβ, Mγ, and Mδ Groups
There are a number of differences that clearly separate the origin of the MIKC and the Mα, Mβ, and Mγ groups. First, the genome distribution of the MIKC genes linked to the genome history suggests that these genes already existed at the time of the polyploidization of the Arabidopsis genome (75 million years ago) and that they probably played an important role in plant development, because 17 of the copied genes were maintained during this evolution. Furthermore, MIKC gene structures clearly differ from those of Mα, Mβ, and Mγ genes: they are much longer and contain five to eight exons. It seems that the MIKC gene structure is ancestral to the entire MIKC clade. However, the high level of conservation of the M and K domains suggests that they evolved continually under stronger structural/functional constraints than did the more divergent I and C domains. The origin of the Mδ group is curious in this respect. This group is small and contains genes that have the structural complexity of the MIKC genes (5 to 10 exons) and that exhibit the highest MADS-box sequence similarity with the MIKC genes. However, they do not contain the K domain, and the function of none of them is known.
Why Has No Mutant Phenotype Been Ascribed to the New Type of MADS-Box Genes?
Amazingly, all of the known phenotypic mutants belong to the MIKC group, despite the fact that there are more non-MIKC MADS-box genes. How can this be explained? It is possible that because the MIKC genes have been known for a longer time than the non-MIKC genes, they have been subjected to more investigation, including reverse genetic analysis, which has resulted in more mutants being found. However, it is statistically unlikely that this is the sole reason for the unequal distribution of mutants. Another possible explanation for the lack of known mutants among non-MIKC genes is that they are not functional genes. The evidence we present here contradicts this possibility, because we show that they are expressed, conserved between species, and, mostly, retain the ability to encode group-specific protein domains. If the non-MIKC genes are functional, it is possible that loss-of-function mutants would be lethal. Our preliminary experiments suggest that this is not the case, because we have identified several insertion mutants in these genes, all of which are viable (our unpublished results). Of course, this finding does not exclude the possibility that some of the non-MIKC genes are essential.
Redundancy could provide another reason for the lack of obvious phenotypic mutants among these genes. The MIKC group of MADS-box genes already provides several very clear examples of redundancy, such as AP1/CAL/FUL (Ferrándiz et al., 2000), the SEP genes (Pelaz et al., 2000), and the SHP genes (Liljegren et al., 2000). Finally, it is possible that members of the MIKC group control functions with very obvious phenotypic effects, whereas the Mα, Mβ, Mγ, and Mδ groups control much more subtle functions, possibly even unrelated to development. If this is the case, functional characterization of the Mα, Mβ, Mγ, and Mδ groups will require much more stringent phenotypic examination, which might have to include the construction of multiple mutant combinations, transcript profiling, and proteomic and metabolic analyses. Our expression analysis provides an important step in this search, by establishing the tissues in which these genes are expressed. Further reverse genetic screens will allow us to distinguish between these possibilities.
In conclusion, the results presented here will provide the framework for further studies of the MIKC and the new classes of MADS-box genes and also will motivate evolutionary biologists who study this important transcription factor family in plants and other organisms.
METHODS
Identification of New MADS-Box Genes in Arabidopsis
The hidden Markov model (Eddy, 1998) was exploited for the identification of new MADS-box genes in Arabidopsis thaliana that produced a MADS-box profile out of a multiple alignment of the MADS-box conserved regions. To build this profile, a search was performed in the SWISSPROT database to find amino acid sequences from different plant species that are described as members of the MADS-box domain family. Subsequently, these sequences were used in a Basic Local Alignment Search Tool (BLAST; Altschul et al., 1997) search against a nonredundant protein sequence database, and all hits below an E value of 10−3 were retrieved for multiple alignment (see supplemental data online). The multiple alignment performed with CLUSTAL W (Thompson et al., 1994) was corrected by hand removing the less conserved regions. Using the HMMER 2.1.1 software package (http://hmmer.wust.edu), a profile for the MADS box was built. This pattern then was used to find new members of the family in the Arabidopsis genome.
For each new gene, a pair of primers was designed (see supplemental data online) to amplify the coding sequences using first-strand cDNAs prepared from various plant tissues. First-strand cDNAs were produced using total RNA (see below) and Superscript II RNase H− Reverse Transcriptase (Invitrogen, Carlsbad, CA), reverse transcriptase from Moloney murine leukemia virus (GIBCO), or Omniscript Reverse Transcriptase (Qiagen, Valencia, CA) according to the manufacturer's instructions. The PCR fragments were cloned into pGEM-T Easy vector (Promega) or pBluescript II KS+ (Stratagene) and sequenced from both ends. The sequencing reactions were performed using the CEQ 2000 Dye Terminator Cycle Sequencing Quick Start Kit (Beckman Coulter) and the CEQ 2000XL DNA Analysis System (Beckman Coulter) or the BigDye Terminator Cycle Sequencing Kit (ABI PRISM, Foster City, CA) and the ABI PRISM 310 Genetic Analyzer.
The supplemental data online list all of the MADS-box genes from Arabidopsis that were analyzed. These data contain the Arabidopsis Genome Initiative (2000) gene identification number and new GenBank accession number(s) when our sequence differed from the Arabidopsis Genome Initiative (2000) predictions and when new splicing variants were identified.
Phylogenetic Reconstructions
The data sets of 107 Arabidopsis sequences and 40 sequences from rice and Arabidopsis were aligned using CLUSTAL W (Thompson et al., 1994), and the alignments were refined manually. For the initial phylogenetic analysis and the analysis of the data set that included rice sequences, we considered only the MADS-box domain because no other region could be aligned unambiguously for all of the sequences available. A mask was applied to remove insertions in the core MADS box, leaving a data set of 58 characters. In a few cases (Mβ group), in which N-terminal regions of the MADS domain were highly divergent, we recoded divergent N-terminal regions as unknown characters; this measure was taken to minimize the effects of long branch attraction artifacts on the construction of phylogenetic trees.
Baysian phylogenetic trees for these data sets were estimated (using the program MrBayes version 2.01 [Huelsenbeck, 2000]) under the JTT-f model of amino acid substitution with site-by-site substitution rate variation modeled with an invariable and 4 γ category model. A total of 200,001 generations were performed, with trees sampled every 50 generations. Amino acid frequencies were estimated from the data sets, and a “burn-in” of 250 trees was used to estimate the consensus topologies. According to the results of these analyses, the full-length sequences were divided into five groups of more closely related genes. These five groups of sequences were realigned, and new masks were applied to allow analysis of the maximum number of unambiguously aligned residues for each group (Mα, 25 sequences, 75 characters; Mβ, 20 sequences, 77 characters; Mγ, 16 sequences, 153 characters; Mδ, 6 sequences, 63 characters; and MIKC, 39 sequences, 132 characters). Phylogenetic analysis of each data set was performed with MrBayes using the model described previously.
Bootstrap partitions for the Arabidopsis data sets were obtained using the program TREE-PUZZLE version 5.0 (Strimmer and Von Haeseler, 1996) automated with the script PUZZLEBOOT (http://www.tree-puzzle.de/#puzzleboot). Briefly, 100 bootstrap distance matrices were generated under the same model used for Baysian analyses. Proportions of invariable sites and the α parameter for the γ distribution were estimated on the topology of the Baysian tree obtained previously for each data set. Trees were obtained from bootstrap distance matrices using the program FITCH (Felsenstein, 1989) with three random additions of distances. Bootstrap partitions were calculated with the program CONSENSE (Felsenstein, 1989).
Additionally, a reduced data set of 39 sequences distributed among all five of the clades generated by the initial analysis of 107 MADS-box domain sequences was used to generate bootstrap partitions for the relationships among the five clades described in that analysis.
For Figures 2 to 6, Baysian trees for each clade are depicted as rooted at the position specified by unconstrained analysis of the 107-sequence MADS-box-only data set, although the trees were generated by unrooted analyses. Bootstrap proportions and Baysian posterior probabilities are displayed at each node with a value of >50%.
Gene Expression Analysis
We used Arabidopsis ecotype Columbia for our experiments. The plants were grown in soil in a temperature-controlled greenhouse under long-day conditions (16-h photoperiod).
RNA Gel Blot Analysis
Total RNA was extracted from various tissues using the TRIzol reagent (Invitrogen) or the LiCl method described by Verwoerd et al. (1989). Poly(A+) mRNA was isolated using the mRNA Purification Kit (Amersham Pharmacia Biotech) according to the manufacturer's instructions. RNA was denatured using the glyoxal method (Sambrook et al., 1989) and separated on a 1.2% agarose gel in 15 mM Na-phosphate buffer, pH 6.5. Five to 15 μg of total RNA or 2.5 μg of mRNA was used in different experiments. After separation, the gel was capillary blotted overnight on Hybond-N or Hybond-N+ membranes (Amersham Pharmacia Biotech) in 25 mM Na-phosphate buffer, pH 6.5. The membrane was fixed after transfer by baking for 2 h at 80°C. The membranes were prehybridized for 1.5 h at 65°C in a hybridization buffer containing 6× SSC (1× SSC is 0.15 M NaCl and 0.015 M sodium citrate), 5× Denhardt's solution (1× Denhardt's solution is 0.02% Ficoll, 0.02% polyvinylpyrrolidone, and 0.02% BSA), 0.01 M EDTA, 0.5% (w/v) SDS (Sambrook et al., 1989), and fragmented salmon sperm DNA at a final concentration of 125 μg/mL.
Hybridization was performed at 42°C overnight in a buffer containing 10% (w/v) dextran sulfate, 6× SSC, 2× Denhardt's solution, 0.1% (w/v) SDS, and 50% (v/v) formamide. Probes were labeled with 32P using the Random Primed DNA Labeling Kit (Roche, Indianapolis, IN). We used the following fragments to detect gene expression: for AGL30 and AGL80, 404- and 878-bp 3′ coding sequence–specific fragments, respectively; for the loading control, a 509-bp fragment of the ACTINE11 gene from Arabidopsis was amplified with the primer pair OL260 (5′-GTGTTGGACTCTGGAGATGGTGTG-3′) and OL261 (5′-GCCAAAGCAGTGATCTCTTTGCTC-3′). The blots were washed at 65°C as follows: 25 min in 2× SSC and 0.1% (w/v) SDS, 25 min in 1× SSC and 0.1% (w/v) SDS, and 15 min in 0.5× SSC and 0.1% (w/v) SDS. The washes were stopped at the latter step when the washing buffers remained clean (nonradioactive). The blots were exposed to film (Kodak) at −80°C for 4 to 7 days.
In Situ Hybridization
Digoxigenin-labeled riboprobes, excluding the conserved MADS-box domain, for AGL34, AGL37, AGL63, AGL66, AGL80, and AGL104, corresponding to 878-, 717-, 489-, 687-, 878-, and 894-bp fragments, respectively, were produced using DIG RNA labeling mix and T3 polymerase (Roche Diagnostics) according to the manufacturer's instructions. Material for in situ hybridization was prepared and hybridized to RNA probes as described previously by Zachgo (2002).
Reverse Transcriptase–Mediated PCR
First-strand cDNA from root, leaf, inflorescence, and silique (for the preparation, see above) was used as a template with specific primers for each gene (see supplemental data online). In general, the PCR cycler was set up as follows: 95°C for 3 min; 30 to 35 cycles of 95°C for 1 min, 55°C for 1 min, and 72°C for 1 to 2 min; with a final extension at 72°C for 5 min. The PCR mix was prepared according to the manufacturer's instructions; we used TaqPlus Precision Polymerase (Stratagene), the Expand High-Fidelity PCR System (Roche), or PLATINUM pfx DNA Polymerase (Invitrogen). Twenty microliters from the 100-μL PCR product was separated on a 1% (w/v) agarose gel in 1× TAE buffer (40 mM Tris-acetate and 1 mM EDTA) and stained with ethidium bromide to visualize the products. For each gene, two or three independent replicates were made.
Gene Structure and Localization on Chromosomes
Gene structures were visualized using Jellyfish software (Riethof and Balakrishnan, 2001). Gene positions on chromosomes were determined using SeqViewer (http://arabidopsis.org/servlets/sv). Gene duplications and their presence on duplicated segments were investigated using the MIPS Redundancy Viewer (http://mips.gsf.de/proj/thal/db/gv/rv/) and the Simillion database (Simillion et al., 2002) (http://www.psb.rug.ac.be/bioinformatics/simillion_pnas02).
Analysis of MADS-Box Protein Sequences
To find shared motifs among the protein sequences belonging to one group, we exploited MEME version 2.2 (Bailey and Elkan, 1994). The full-length protein sequences were grouped based on the results of the phylogenetic analysis (Figures 2 to 6). AGL33 was analyzed together with the Mδ proteins. The parameters of analysis were set up as follows: number of repetitions, any; maximum number of motifs, 20; and optimum width of the motif, ≥6 and ≤200. In the case of the Mβ group, the number of motifs was set to 25. Only motifs with E values of <1.5 (this value was estimated after visual inspection of the alignment) were considered. The MEME search is unable to recognize a motif if a gap is present in the alignment. In cases in which a clear similarity was found among the aligned sequences but not recognized because of program restrictions, we marked the motif in the alignment (see supplemental data online). The motif profile for each of the proteins then was reproduced schematically in Figures 2 to 6.
To search for functional domains within the MADS-box protein sequences, we used the SMART version 3.4 (Schultz et al., 1998; Letunic et al., 2002) World Wide Web–based resource.
Upon request, all novel materials described in this article will be made available in a timely manner for noncommercial research purposes.
Supplementary Material
Acknowledgments
We thank Alfonso Valencia and Ramòn A-Allende for Arabidopsis database mining. This research was funded by the European Community (REGIA Project QLRT-1999-876). L.P. was supported by European Community postdoctoral fellowship QLK5-CT-2000-52129. D.S.H. was funded by European Community postdoctoral fellowship MCFI-2001-00634.
Article, publication date, and citation information can be found at www.plantcell.org/cgi/doi/10.1105/tpc.011544.
Footnotes
Online version contains Web-only data.
References
- Altschul, S.F., Madden, T.L., Schäffer, A.A., Zhang, J., Zhang, Z., Miller, W., and Lipman, D.J. (1997). Gapped BLAST and PSI-BLAST: A new generation of protein database search programs. Nucleic Acids Res. 24, 3389–3402. [DOI] [PMC free article] [PubMed] [Google Scholar]
- Alvarez-Buylla, E.R., Pelaz, S., Liljegren, S.J., Gold, S.E., Burgeff, C., Ditta, G.S., De Pouplana, L.R., Martínez-Castilla, L., and Yanofsky, M.F. (2000). An ancestral MADS-box gene duplication occurred before the divergence of plants and animals. Proc. Natl. Acad. Sci. USA 97, 5328–5333. [DOI] [PMC free article] [PubMed] [Google Scholar]
- Arabidopsis Genome Initiative (2000). Analysis of the genome sequence of the flowering plant Arabidopsis thaliana. Nature 408, 796–815. [DOI] [PubMed] [Google Scholar]
- Bailey, T.L., and Elkan, C. (1994). Fitting a mixture model by expectation maximization to discover motifs in biopolymers. In Proceeding of the Second International Conference on Intelligent Systems for Molecular Biology. (Menlo Park, CA: AAAI Press), pp. 28–36. [PubMed]
- Bowman, J.L., Alvarez, J., Weigel, D., Meyerowitz, E.M., and Smyth, D.R. (1993). Control of flower development in Arabidopsis thaliana by APETALA1 and interacting genes. Development 119, 721–743. [Google Scholar]
- Bowman, J.L., Smyth, D.R., and Meyerowitz, E.M. (1989). Genes directing flower development in Arabidopsis. Plant Cell 1, 37–52. [DOI] [PMC free article] [PubMed] [Google Scholar]
- Coen, E.S., and Meyerowitz, E.M. (1991). The war of the whorls: Genetic interactions controlling flower development. Nature 353, 31–37. [DOI] [PubMed] [Google Scholar]
- Colombo, L., Van Tunen, A.J., Dons, H.J.M., and Angenent, G.C. (1997). Molecular control of flower development in Petunia hybrida. In Advances in Botanical Research, Vol. 26, J.A. Callow, ed (London: Academic Press), pp. 229–250.
- Davies, B., Egea-Cortines, M., de Andrade Silva, E., Saedler, H., and Sommer, H. (1996). Multiple interactions amongst floral homeotic MADS box proteins. EMBO J. 15, 4330–4343. [PMC free article] [PubMed] [Google Scholar]
- Eddy, S.R. (1998). Profile hidden Markov models. Bioinformatics 14, 755–763. [DOI] [PubMed] [Google Scholar]
- Egea-Cortines, M., Saedler, H., and Sommer, H. (1999). Ternary complex formation between the MADS-box proteins SQUAMOSA, DEFICIENS and GLOBOSA is involved in the control of floral architecture in Antirrhinum majus. EMBO J. 18, 5370–5379. [DOI] [PMC free article] [PubMed] [Google Scholar]
- Fan, H.Y., Hu, Y., Tudor, M., and Ma, H. (1997). Specific interactions between the K domains of AG and AGLs, members of the MADS domain family of DNA binding proteins. Plant J. 12, 999–1010. [DOI] [PubMed] [Google Scholar]
- Felsenstein, J. (1978). Cases in which parsimony or compatibility methods will be positively misleading. Syst. Zool. 27, 401–410. [Google Scholar]
- Felsenstein, J. (1989). PHYLIP: Phylogeny Inference Package (Version 3.2). Cladistics 5, 164–166. [Google Scholar]
- Ferrándiz, C., Gu, Q., Martienssen, R., and Yanofsky, M.F. (2000). Redundant regulation of meristem identity and plant architecture by FRUITFULL, APETALA1 and CAULIFLOWER. Development 127, 725–734. [DOI] [PubMed] [Google Scholar]
- Fornara, F., Marziani, G., Mizzi, L., Kater, M., and Colombo, L. (2003). MADS-box genes controlling flower development in rice. Plant Biol. 5, 16–22. [Google Scholar]
- Galbiati, M., Moreno, M.A., Nadzan, G., Zourelidou, M., and Dellaporta, S.L. (2000). Large-scale T-DNA mutagenesis in Arabidopsis for functional genomics analysis. Funct. Integr. Genomics 1, 25–34. [DOI] [PubMed] [Google Scholar]
- Goto, K., and Meyerowitz, E.M. (1994). Function and regulation of the Arabidopsis floral homeotic gene Pistillata. Genes Dev. 8, 1548–1560. [DOI] [PubMed] [Google Scholar]
- Gu, Q., Ferrándiz, C., Yanofsky, M.F., and Martienssen, R. (1998). The FRUITFULL MADS-box gene mediates cell differentiation during Arabidopsis fruit development. Development 125, 1509–1517. [DOI] [PubMed] [Google Scholar]
- Hartmann, U., Höhmann, S., Nettesheim, K., Wisman, E., Seadler, H., and Huijser, P. (2000). Molecular cloning of SVP: A negative regulator of the floral transition in Arabidopsis. Plant J. 21, 351–360. [DOI] [PubMed] [Google Scholar]
- Hayes, T.E., Sengupta, P., and Cochran, B.H. (1988). The human c-fos serum response factor and the yeast factor GRM/PRTF have related DNA-binding specificities. Genes Dev. 2, 1713–1722. [DOI] [PubMed] [Google Scholar]
- Honma, T., and Goto, K. (2001). Complexes of MADS-box proteins are sufficient to convert leaves into floral organs. Nature 409, 525–529. [DOI] [PubMed] [Google Scholar]
- Huelsenbeck, J.P. (1997). Is the Felsenstein zone a fly trap? Syst. Biol. 46, 69–74. [DOI] [PubMed] [Google Scholar]
- Huelsenbeck, J.P. (2000). MrBayes: Baysian Inference of Phylogeny. (Rochester, NY: Department of Biology, University of Rochester).
- Jack, T., Brockman, L.L., and Meyerowitz, E.M. (1992). The homeotic gene APETALA3 of Arabidopsis thaliana encodes a MADS-box and is expressed in petals and stamens. Cell 68, 683–697. [DOI] [PubMed] [Google Scholar]
- Kater, M.M., Franken, J., Carney, K.J., Colombo, L., and Angenent, G.C. (2001). Sex determination in the monoecious species cucumber is confined to specific floral whorls. Plant Cell 13, 481–493. [DOI] [PMC free article] [PubMed] [Google Scholar]
- Krizek, B.A., and Meyerowitz, E.M. (1996). Mapping the protein regions responsible for the functional specificities of the Arabidopsis MADS domain organ-identity protein. Proc. Natl. Acad. Sci. USA 93, 4063–4070. [DOI] [PMC free article] [PubMed] [Google Scholar]
- Letunic, I., Goodstadt, L., Dickens, N.J., Doerks, T., Schultz, J., Mott, R., Ciccarelli, F., Copley, R.R., Ponting, C.P., and Bork, P. (2002). Recent improvements to the SMART domain-based sequence annotation resource. Nucleic Acids Res. 30, 242–244. [DOI] [PMC free article] [PubMed] [Google Scholar]
- Liljegren, S.J., Ditta, G.S., Eshed, Y., Savidge, B., Bowman, J.L., and Yanofsky, M.F. (2000). SHATTERPROOF MADS-box genes control seed dispersal in Arabidopsis. Nature 404, 766–770. [DOI] [PubMed] [Google Scholar]
- Lynch, M., and Conery, J.S. (2000). The evolutionary fate and consequences of duplicate genes. Science 290, 1151–1155. [DOI] [PubMed] [Google Scholar]
- Mandel, M.A., Gustafson-Brown, C., Savidge, B., and Yanofsky, M.F. (1992). Molecular characterization of the Arabidopsis floral homeotic gene APETALA1. Nature 360, 273–277. [DOI] [PubMed] [Google Scholar]
- Marsch-Martinez, N., Greco, R., Van Arkel, G., Herrera-Estrella, L., and Pereira, A. (2002). Activation tagging using the en-I maize transposon system in Arabidopsis. Plant Physiol. 129, 1544–1556. [DOI] [PMC free article] [PubMed] [Google Scholar]
- Michaels, S.D., and Amasino, R.M. (1999). FLOWERING LOCUS C encodes a novel MADS domain protein that acts as a repressor of flowering. Plant Cell 11, 949–956. [DOI] [PMC free article] [PubMed] [Google Scholar]
- Michaels, S.D., Ditta, G., Gustafson-Brown, C., Yanofsky, M., and Amasino, R.M. (2003). AGL24 acts as a promoter of flowering in Arabidopsis and is positively regulated by vernalization. Plant J. 33, 867–874. [DOI] [PubMed] [Google Scholar]
- Münster, T., Pahnke, J., Di Rosa, A., Kim, J.T., Martin, W., Saedler, H., and Theißen, G. (1997). Floral homeotic genes were recruited from homologous MADS-box genes preexisting in the common ancestors of ferns and seed plants. Proc. Natl. Acad. Sci. USA 94, 2415–2420. [DOI] [PMC free article] [PubMed] [Google Scholar]
- Nesi, N., Debeaujon, I., Jond, C., Stewart, A.J., Jenkins, G.I., Caboche, M., and Lepiniec, L. (2002). The TRANSPARENT TESTA16 locus encodes the Arabidopsis BSISTER MADS domain protein and is required for proper development and pigmentation of the seed coat. Plant Cell 14, 2463–2479. [DOI] [PMC free article] [PubMed] [Google Scholar]
- Park, J., Karplus, K., Barrett, C., Hughey, R., Haussler, D., Hubbard, T., and Clothia, C. (1998). Sequence comparisons using multiple sequences detect three times as many remote homologues as pairwise methods. J. Mol. Biol. 284, 1201–1210. [DOI] [PubMed] [Google Scholar]
- Pelaz, S., Ditta, G.S., Baumann, E., Wisman, E., and Yanofsky, M.F. (2000). B and C floral organ identity functions require SEPALLATA MADS-box genes. Nature 405, 200–203. [DOI] [PubMed] [Google Scholar]
- Pellegrini, L., Tan, S., and Richmond, T.J. (1995). Structure of serum response factor core bound to DNA. Nature 376, 490–498. [DOI] [PubMed] [Google Scholar]
- Purugganan, M.D., Rounsley, S.D., Schmidt, R.J., and Yanofsky, M.F. (1995). Molecular evolution of flower development: Diversification of the plant MADS-box regulatory gene family. Genetics 140, 345–356. [DOI] [PMC free article] [PubMed] [Google Scholar]
- Ratcliffe, O.J., Nadzan, G.C., Reuber, T.L., and Riechmann, J.L. (2001). Regulation of flowering in Arabidopsis by an FLC homologue. Plant Physiol. 126, 122–132. [DOI] [PMC free article] [PubMed] [Google Scholar]
- Riechmann, J.L., et al. (2000). Arabidopsis transcription factors: Genome-wide comparative analysis among eukaryotes. Science 290, 2105–2110. [DOI] [PubMed] [Google Scholar]
- Riechmann, J.L., Krizek, B.A., and Meyerowitz, E.M. (1996. a). Dimerization specificity of Arabidopsis MADS domain homeotic proteins APETALA1, APETALA3, PISTILLATA, and AGAMOUS. Proc. Natl. Acad. Sci. USA 93, 4793–4798. [DOI] [PMC free article] [PubMed] [Google Scholar]
- Riechmann, J.L., and Ratcliffe, O.J. (2000). A genomic perspective on plant transcription factors. Curr. Opin. Plant Biol. 3, 423–434. [DOI] [PubMed] [Google Scholar]
- Riechmann, J.L., Wang, M., and Meyerowitz, E.M. (1996. b). DNA-binding properties of Arabidopsis MADS domain homeotic proteins APETALA1, APETALA3, PISTILLATA and AGAMOUS. Nucleic Acids Res. 24, 3134–3141. [DOI] [PMC free article] [PubMed] [Google Scholar]
- Riethof, D.A., and Balakrishnan, R. (2001). LabVelocity: Online tools for life science products, protocols, technical information, MEDLINE searches, and laboratory calculations. Biotechniques 30, 1310–1315. [DOI] [PubMed] [Google Scholar]
- Samach, A., Onouchi, H., Gold, S.E., Ditta, G.S., Schwarz-Sommer, Z., Yanofsky, M.F., and Coupland, G. (2000). Distinct roles of CONSTANS target genes in reproductive development of Arabidopsis. Science 288, 1613–1616. [DOI] [PubMed] [Google Scholar]
- Sambrook, J., Fritsch, E.F., and Maniatis, T. (1989). Molecular Cloning: A Laboratory Manual, 2nd ed. (Cold Spring Harbor, NY: Cold Spring Harbor Laboratory Press).
- Samson, F., Brunaud, V., Balzergue, S., Dubreucq, B., Lepiniec, L., Pelletier, G., Caboche, M., and Lecharny, A. (2002). FLAGdb/FST: A database of mapped flanking insertion sites (FSTs) of Arabidopsis thaliana T-DNA transformants. Nucleic Acids Res. 30, 94–97. [DOI] [PMC free article] [PubMed] [Google Scholar]
- Santelli, E., and Richmond, T.J. (2000). Crystal structure of MEF2A core bound to DNA at 1.5 Å resolution. J. Mol. Biol. 297, 437–449. [DOI] [PubMed] [Google Scholar]
- Schultz, J., Milpetz, F., Bork, P., and Ponting, C.P. (1998). SMART, a simple modular architecture research tool: Identification of signaling domains. Proc. Natl. Acad. Sci. USA 95, 5857–5864. [DOI] [PMC free article] [PubMed] [Google Scholar]
- Scortecci, K.C., Michaels, S.D., and Amasino, R.M. (2001). Identification of a MADS-box gene, FLOWERING LOCUS M, that represses flowering. Plant J. 26, 229–236. [DOI] [PubMed] [Google Scholar]
- Shimeld, S.M. (1999). Gene function, gene networks and the fate of duplicated genes. Semin. Cell Dev. Biol. 10, 549–553. [DOI] [PubMed] [Google Scholar]
- Shore, P., and Sharrocks, A.D. (1995). The MADS-box family of transcription factors. Eur. J. Biochem. 229, 1–13. [DOI] [PubMed] [Google Scholar]
- Simillion, C., Vandepoele, K., Van Montagu, M.C.E., Zabeau, M., and Van de Peer, Y. (2002). The hidden duplication past of Arabidopsis thaliana. Proc. Natl. Acad. Sci. USA 99, 13627–13632. [DOI] [PMC free article] [PubMed] [Google Scholar]
- Strimmer, K., and Von Haeseler, A. (1996). Quartet puzzling: A quartet maximum likelihood method for reconstructing tree topologies. Mol. Biol. Evol. 13, 964–969. [Google Scholar]
- Theißen, G., Kim, J.T., and Saedler, H. (1996). Classification and phylogeny of the MADS-box multigene family suggest defined roles of MADS-box gene subfamilies in the morphological evolution of eukaryotes. J. Mol. Evol. 43, 484–516. [DOI] [PubMed] [Google Scholar]
- Thompson, J.D., Higgins, D.G., and Gibson, T.J. (1994). CLUSTAL W: Improving the sensitivity of progressive multiple sequence alignment through sequence weighting, position-specific gap penalties and weight matrix choice. Nucleic Acids Res. 22, 4673–4680. [DOI] [PMC free article] [PubMed] [Google Scholar]
- Verwoerd, T.C., Dekker, B.M.M., and Hoekema, A. (1989). A small-scale procedure for rapid isolation of plant RNAs. Nucleic Acids Res. 17, 2362. [DOI] [PMC free article] [PubMed] [Google Scholar]
- Vision, T.J., Brown, D.G., and Tanksley, S.D. (2000). The origins of genomic duplications in Arabidopsis. Science 290, 2114–2117. [DOI] [PubMed] [Google Scholar]
- Yanofsky, M.F., Ma, H., Bowman, J.L., Drews, G.N., Feldmann, K.A., and Meyerowitz, E.M. (1990). The protein encoded by the Arabidopsis homeotic gene AGAMOUS resembles transcription factors. Nature 346, 35–39. [DOI] [PubMed] [Google Scholar]
- Zachgo, S. (2002). In situ hybridization. In Molecular Plant Biology: A Practical Approach, Vol. 2, P.M. Gilmartin and C. Bowler, eds (Oxford, UK: Oxford University Press), pp. 41–63.
Associated Data
This section collects any data citations, data availability statements, or supplementary materials included in this article.