Abstract
Integration host factor (IHF) is a prokaryotic protein required for the integration of λ phage DNA into its host genome. An x-ray crystal structure of the complex shows that IHF binds to the minor groove of DNA and bends the double helix by 160° [Rice PA, Yang S, Mizuuchi K, Nash HA (1996) Cell 87:1295–1306]. We sought to dissect the complex formation process into its component binding and bending reaction steps, using stopped-flow fluorimetry to observe changes in resonance energy transfer between DNA-bound dyes, which in turn reflect distance changes upon bending. Different DNA substrates that are likely to increase or decrease the DNA bending rate were studied, including one with a nick in a critical kink position, and a substrate with longer DNA ends to increase hydrodynamic friction during bending. Kinetic experiments were carried out under pseudofirst-order conditions, in which the protein concentration is in substantial excess over DNA. At lower concentrations, the reaction rate rises linearly with protein concentration, implying rate limitation by the bimolecular reaction step. At high concentrations the rate reaches a plateau value, which strongly depends on temperature and the nature of the DNA substrate. We ascribe this reaction limit to the DNA bending rate and propose that complex formation is sequential at high concentration: IHF binds rapidly to DNA, followed by slower DNA bending. Our observations on the bending step kinetics are in agreement with results using the temperature-jump kinetic method.
Keywords: kinetics, stopped flow, FRET
Protein–DNA interactions control essential cellular processes, including enzymatic, regulatory, and structural roles. Significant conformational changes in DNA are often induced upon protein binding to DNA, both in specific and nonspecific protein–DNA interactions. In many sequence-specific interactions between protein and DNA, intrinsic DNA distortion and flexibility are key players in recognition of cognate sequences (indirect read-out); other factors include formation of hydrogen bonds and other contact interactions at the local level (direct read-out) (1, 2). Indirect read-out is known to play a major role in DNA sequence specificity in certain systems such as in the complexes of DNA with E2 (3), EcoRV (4), HincII (4), yeast TATA box-binding protein (5), and the integration host factor (IHF) (6, 7). However, the transient mechanisms of protein–DNA association and dissociation reactions remain largely elusive.
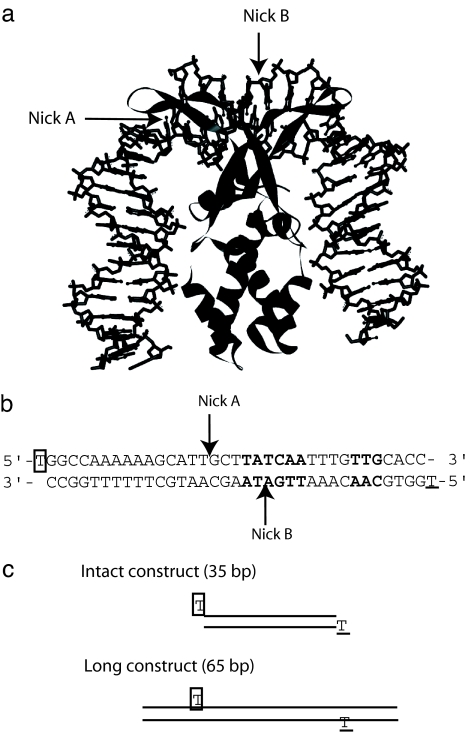
IHF is a small Escherichia coli heterodimeric protein (≈10 kDa each) that can bend DNA and act as an architectural factor in many cellular activities (8, 9). It is involved in DNA replication and transcriptional regulation and in DNA condensation in processes that require DNA bending so as to bring two distant DNA sequences into proximity (8, 9). Its presence is crucial for λ phage DNA recombination; it has been shown to bind to its specific binding sequences with 103 to 104 times higher affinity compared with nonspecific sites (10–12). DNase I and hydroxyl radical footprinting along with methylation interference assays on the IHF–DNA complex have revealed that there are three IHF binding sites on λ phage DNA (13, 14). One of these, the H′ site, with the strongest affinity toward IHF, has been shown to protect >35 base pairs of DNA (13). The x-ray crystal structure of IHF and this site has shown that IHF causes the DNA to bend by >160°, inducing two kinks that are separated by 9 bp (6) (Fig. 1a). Its relatively small size and ability to bend DNA to such a large degree make IHF an interesting candidate for studying protein–DNA reaction kinetics, including the role of bending. These studies provide insight into how DNA flexibility is facilitated in the course of specific binding of proteins to DNA.
Fig. 1.
DNA substrates tested in this study. (a) The IHF-H′ site x-ray crystal structure solved by Rice et al. (6). The 35-bp DNA duplex wraps around the IHF heterodimer subunits that are depicted as ribbons. (b) The sequence of the H′ site is shown with consensus sequences among all three IHF DNA binding sites depicted in bold. The arrows indicate the position of the nick introduced in the nick A and nick B substrates. Boxed thymidine on the top sequence denotes fluorescein-dT and underlined thymidine on the bottom sequence indicates TAMRA-dT. (c) Schematic representation of intact and long substrates with boxed and underlined thymidines denoting fluorescein-dT and TAMRA-dT, respectively.
With many protein–DNA complexes where DNA bending is observed, the question often asked is whether the DNA bending occurs simultaneously with protein binding, or whether there is stepwise binding and bending (reviewed in ref. 15). Another question is what role DNA flexibility plays in the reaction dynamics. The association and dissociation kinetics of IHF and the H′ site on DNA studied previously by Dhavan et al. (16) by using time-resolved synchrotron x-ray footprint assays showed that three subsites (the nine bases between two kinks and the two flanking DNA sequences in the IHF–DNA complex) are simultaneously protected from hydroxyl radical cleavage. Based on this observation, it was concluded that IHF binding to DNA and DNA bending occur in a concerted fashion on the time scale investigated. Such simultaneous protein binding to DNA and DNA bending was also monitored in yeast TATA box-binding protein (17, 18) and EcoRV and its cognate DNA (19). In our experiments we take advantage of the faster time resolution of optically detected stopped-flow measurements and show that at high protein concentrations the rate is limited by a unimolecular process, which we associate with the bending reaction.
Results and Discussion
Association Kinetics with Intact Substrate.
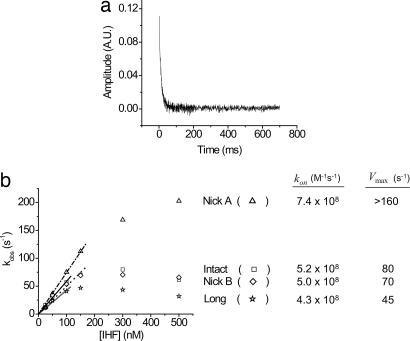
To elucidate the IHF–DNA complex formation mechanism and more specifically to monitor the DNA bending process during the course of complex formation, we conducted association and dissociation kinetic experiments of IHF and DNA by using stopped-flow spectroscopy. We prepared 35-bp-long duplex DNA containing the H′ site with termini labeled with fluorescein and tetramethyl-6-carboxyrhodamine (TAMRA) at opposite ends (Fig. 1b). These dyes allow us to monitor the FRET change on IHF–DNA complex formation and DNA bending, because the end-to-end distance changes from ≈100 to ≈50 Å. We call this sample the “intact” substrate. The kinetic course of the IHF–DNA association reaction was monitored in a molar excess of protein compared with DNA to analyze the otherwise bimolecular reaction under pseudofirst-order conditions. The kinetic curve for the association reaction of 5 nM intact substrate and 300 nM IHF is shown in Fig. 2a. The pseudofirst-order property was clearly evident, because the association kinetic traces at all concentrations of IHF fit well to a single exponential decay process.
Fig. 2.
Fluorescence-detected stopped-flow kinetic results. (a) The association kinetic trace of 5 nM intact and 300 nM IHF at 20°C. The kinetic curves for other IHF concentrations were essentially the same in shape, and all fit into the first-order exponential decay function. (b) Association kinetic pseudofirst order-plot of kobs versus the concentration of IHF for intact (□), nick A (▵), nick B (◊), and long (☆) substrates at 20°C. The final concentration of DNA* was 5 nM for all substrates. A linear concentration dependence of kobs is observed at relatively low concentration of IHF. However, such dependency is lost above 50–100 nM IHF. The kon for each substrate was determined by calculating the slope prepared through the first few points in the plot. Calculated kon and Vmax (DNA bending rate) values for each substrate are listed next to the plot.
When the observed rate constant (kobs) values for the measured first-order decay were plotted against the concentration of IHF, we observed a linear relationship at lower concentrations of IHF, up to ≈100 nM, (Fig. 2b); the slope of this line is the bimolecular reaction rate constant kon. The kon value for the intact substrate in Fig. 2b was calculated to be ≈5 × 10⁸ M−1·s−1, which is comparable to the rate of diffusion limitation for a 35-bp-long DNA molecule and a protein of ≈20 kDa (20). Such diffusion limited association (≈108 s−1·M−1) for IHF and the H′ site was also observed by Dhavan et al. (16) in their kinetic studies by time-resolved synchrotron x-ray footprint assay.
Linearity between the rate and IHF concentration was lost, and kobs reached a peak (Vmax) at higher concentrations of IHF (Fig. 2b). This finding led us to speculate that the maximum in the kobs value observed may be caused by the accumulation of an intermediate complex in which straight DNA is bound by the protein but the DNA has not had time to bend. According to this model the Vmax value is the DNA bending rate. The modest decrease in rate observed above ≈300 nM may be caused by increasing importance of nonspecific binding, for example, by increasing the hydrodynamic resistance to bending. Even though KCl concentrations >100 mM have been shown to promote specific binding of IHF to DNA sequences (21), at 60- to 100-fold excess protein concentrations, some nonspecific binding is likely.
The saturation behavior in kobs observed in the association kinetic plot could possibly be related to the dead time of the stopped-flow fluorimeter (the duration of the time that is not monitored by the instrument after two solutions have been mixed), which is ≈2–3 ms (DX17 manual; Applied Photophysics, Surrey, UK). The time scale of the association kinetics measured was ≈20 ms by the time the concentration of IHF is increased to 500 nM, from which we estimate that ≈20% of the reaction is not captured. The remaining 80% gives a sufficient amplitude for extracting the decay time. The temperature-jump measurements in ref. 25 show that there is no faster relaxation time beyond the resolution of our experiments. Finally, the value of Vmax varies with conditions and the nature of the DNA substrate, as described below, so we rule out a role for the instrument dead time in our results.
Temperature Dependence of IHF–DNA Association Kinetics.
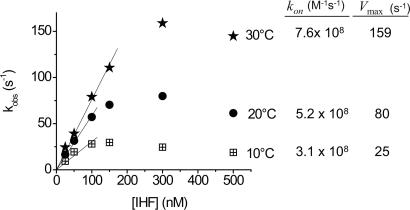
IHF and intact DNA association kinetic studies were conducted at 10°C, 20°C, and 30°C; we observed increases in kobs, kon, and Vmax values with temperature elevation (Fig. 3). The kon values calculated for the intact substrates associating with IHF at 10°C, 20°C, and 30°C (Fig. 3) increased from 3.1 × 10⁸ to 5.2 × 10⁸ and 7.6 × 10⁸ M−1·s−1, respectively. From these kon values and the Arrhenius equation, we determined an activation energy for kon of 7.7 ± 0.4 kcal/mol. Vmax values showed even more substantial increase; from 25 to 159 s−1 for 10°C to 30°C, implying an increased rate of DNA bending. The activation energy for Vmax was calculated to be 16 ± 3 kcal/mol, consistent with the results from the temperature-jump experiments (25), which describes a model for the source of the activation energy.
Fig. 3.
kobs versus the concentration of IHF for intact substrate at 10°C, 20°C, and 30°C. An increase in kobs is observed with temperature, as is also the case for kon and saturation values Vmax (kon and Vmax values at each temperature are shown next to the plots). An Arrhenius plot of lnkon versus ln(1/T) was prepared (data not shown), and the slope of such plot was calculated from which the activation energy of IHF–DNA association, Ea, was determined to be 7.7 ± 0.4 kcal/mol. Similarly, for the activation energy of DNA bending, the kobs values at an IHF concentration of 300 nM was taken as Vmax(s−1). The activation energy of DNA bending was determined to be 16 ± 3 kcal/mol.
IHF and DNA Association Kinetics with Nick A, Nick B, and Long Substrates.
To monitor the role of DNA bending in complex formation in more detail, we prepared additional DNA substrates that still contained the H′ site, but with slight modifications, including substrates with nicks, and with longer DNA flanking sequences. We postulated that a nick in the DNA phosphate backbone in one of the kink positions observed in the IHF–H′ site crystal structure (nick A in Fig. 1) would reduce the elastic constraint, allowing the DNA duplex to bend more readily. The nick B substrate, prepared as a control for nick A, contains a nick between the two kinks at the center of the binding site. Our expectation was that a kink at position B would not accelerate DNA bending, because bending at the B site is minimal. In the long substrate, the duplex tails were elongated by 15 bp, while keeping the dye positions the same as the intact and nick A and nick B substrates so that the dye-to-dye distance remains constant. We predicted that DNA bending in the long substrate would be decelerated because of the increased hydrodynamic friction experienced by the longer flanking sequences of the DNA.
The association kinetic pseudofirst-order plots for the modified DNA substrates are shown in Fig. 2b. The effects on Vmax are in accord with predictions based on the assumption that Vmax measures the rate of DNA bending. The kobs values for nick A rise to ≈200 s−1 at 500 nM IHF, but do not reach a maximum. Thus we can conclude that Vmax for that molecule is more than twice the value of ≈80 s−1 for the intact substrate. The kinetic data for the nick B control do not differ significantly from those for the intact substrate, in accord with our prediction. The observed association rate constant (kobs) of the long substrate saturates at 100 nM of IHF, giving a reduced Vmax value of ≈45 s−1, which we attribute to slower DNA bending imposed by higher frictional resistance from the extended flanking sequences.
The association rate constants, kon, for the altered substrates were calculated, using the first few points of the kobs values where there was linearity between kobs and the concentration of IHF. They were 7.4 × 10⁸ M−1·s−1, 5.0 × 10⁸ M−1·s−1, and 4.3 × 10⁸ M−1·s−1 for nick A, nick B, and long substrates, respectively, compared with 5.2 × 10⁸ M−1·s−1 for the intact species. For all substrates, the error range measured for kon was less than ±8%.
Thus kon varies marginally among intact, nick, and long substrates, yet they were all near the diffusion limited rates. The slightly increased value for nick A may reflect a partial dependence of the overall bimolecular rate constant on the second reaction step, namely bending. Kinetics studies of other protein–DNA systems such as papillomavirus E2 (22) and EcoRV (19) have also shown diffusion limited rate association kinetics in the order of ≈108 M−1·s−1.
Dissociation Kinetics with Intact, Nick A, Nick B, and Long Substrates.
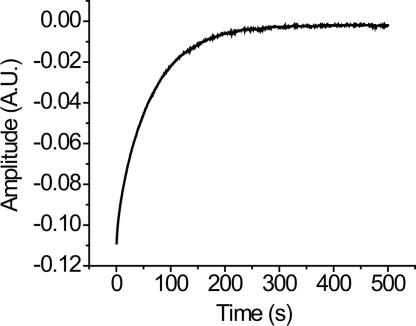
The dissociation kinetic of IHF–DNA experiments were carried out by a competition assay in which an equilibrated IHF–DNA complex was mixed with an excess amount of unlabeled DNA. The dissociation rate constant (koff) was first measured by carrying out a competition assay where the IHF–DNA* (80 nM IHF and 10 nM labeled DNA) complex was mixed with 500 nM of unlabeled DNA (Fig. 4). A single exponential kinetic trace was observed in IHF-labeled DNA dissociation kinetics, indicating single-step dissociation, and mirroring the association kinetics that were single exponential decay process for all of the substrates. Subsequently, the observation that the dissociation rate depended on the concentration of the unlabeled DNA as observed for proteins such as lac repressor (23) led us to perform the competition assays with various concentrations of unlabeled DNA. The dissociation rate constant (koff) was determined by extrapolating a linear plot of the observed dissociation rate constant to zero concentration of unlabeled DNA (data not shown). The dissociation rate constants measured in this manner for all substrates are summarized in Table 1. As was the case for the association kinetics, the dissociation rate constants were similar among all three substrates, varying in the range of 0.01 to 0.07 s−1. The error range observed was ±10–15% of the koff value in all cases.
Fig. 4.
The dissociation kinetic trace of 40 nM IHF from 5 nM labeled DNA in the presence of 250 nM unlabeled competitor DNA. All of the dissociation kinetic traces colleted at various concentrations of unlabeled competitor DNA showed single exponential decay process.
Table 1.
Rate constants and kinetically measured dissociation constant of IHF–DNA kinetics at 20°C
| Substrate | kon, M−1·s−1 | koff, s−1 | KD, nM |
|---|---|---|---|
| Intact | 5.2 × 10⁸ | 0.013 | 0.025 |
| Nick A | 7.4 × 10⁸ | 0.020 | 0.027 |
| Nick B | 5.0 × 10⁸ | 0.029 | 0.058 |
| Long | 4.3 × 10⁸ | 0.029 | 0.067 |
Association rate constant (kon), dissociation rate constant (koff), and kinetic dissociation constant (KD= koff/kon) for intact, nick A, nick B, and long substrates measured and calculated are summarized.
KD Calculation from Association and Dissociation Rate Constants.
Assuming that the IHF–DNA complex formation is a concerted process at relatively low protein concentration,
 |
The dissociation constant (KD) was calculated from the association (kon) and dissociation (koff) kinetic rate constants, KD= koff/kon. In all four substrates, the kon was ≈108 s−1·M−1 and the koff in the range of 0.01 to 0.07 s−1. Thus the KD from kinetic experiments is 0.01–0.07 s−1/≈108 M−1·s−1= 0.02–0.1 nM. The dissociation constant (KD) calculated for the intact substrate, 0.025 nM, showed ≈10-fold stronger binding compared with KD measured by Murtin et al. (12) of 0.3 nM using 70 mM KCl. Other studies where the concentration of DNA was kept below the KD for an accurate measurement by titration assays in similar buffer conditions have shown KD of between 2 and 20 nM (10–12). It should be kept in mind that the kinetic measurements are carried out at concentrations large compared with KD, in contrast to typical equilibrium measurements.
Conclusion
The present study was conducted to investigate whether IHF–DNA complex formation proceeds in a concerted manner (protein binding to DNA and DNA bending occurring simultaneously) or in a stepwise process (protein binding to DNA followed by DNA bending). Based on the correlation between the predicted consequences of variations in the DNA substrate and the experimental observations, we propose a two-step mechanism for formation of the complex, in which protein binding to straight DNA is followed by DNA bending (Fig. 5). At lower concentration of IHF, the initial IHF–DNA binding encounter is rate limiting, and the reaction mechanism is effectively concerted. However, at higher concentrations of IHF, DNA bending becomes the rate-limiting step in the overall reaction. Such a two-step model is depicted in Fig. 5. It is possible that one side of the DNA bends first instead of the two sides together (such an intermediate complex is indicated in parentheses in Fig. 5). Additional substrates containing other kinks, mutations, alternate IHF binding sites, and prebent DNA remain to be investigated. Additional characterization of DNA bending kinetics is provided in ref. 25.
Fig. 5.
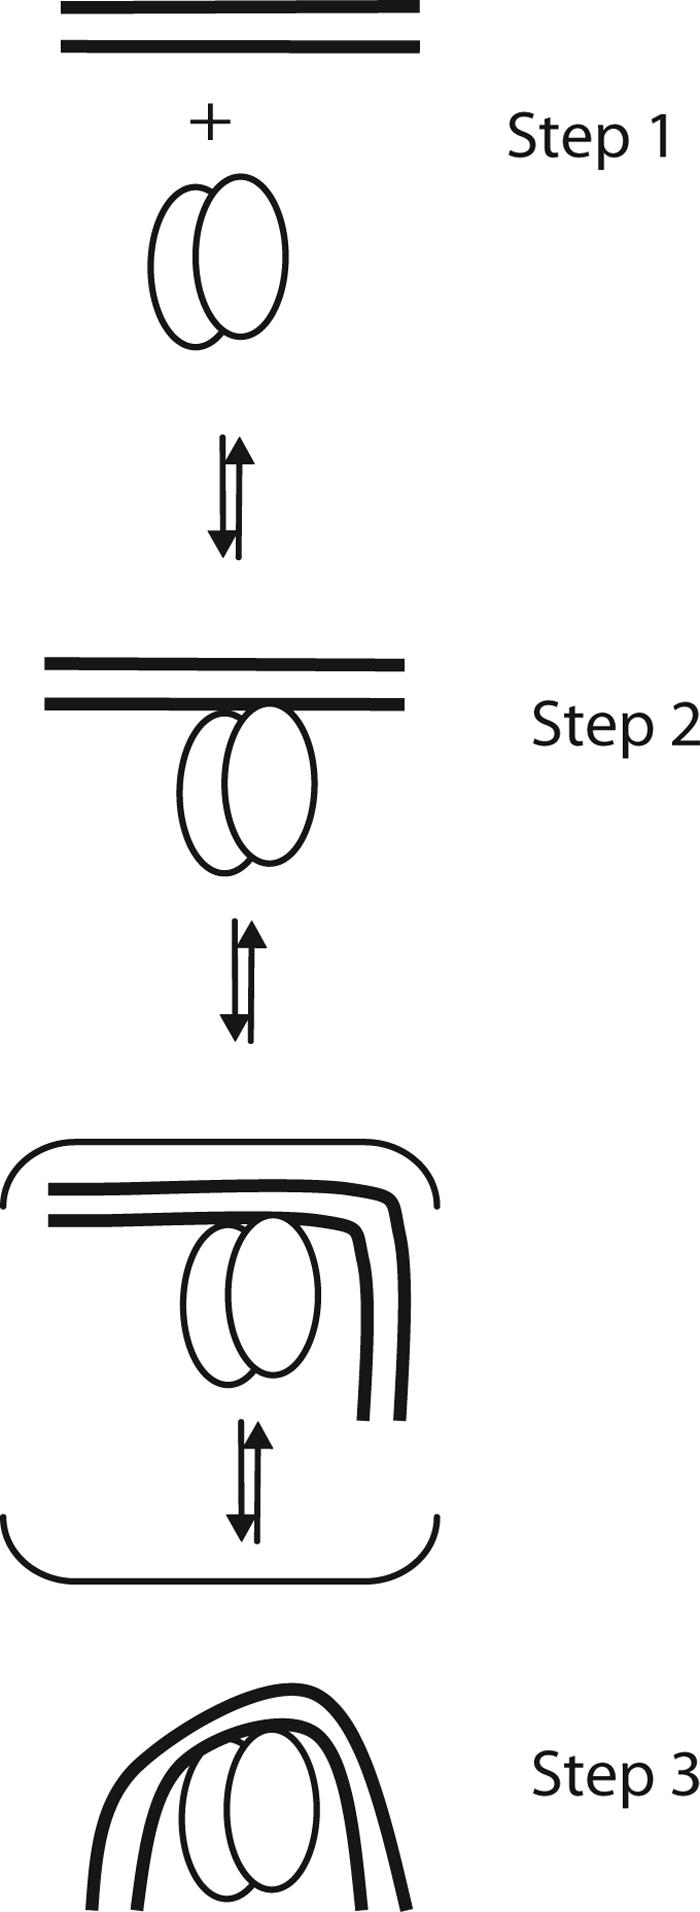
A proposed mechanism for IHF–DNA complex formation. Two lines and two ovals represent DNA duplex and protein dimers, respectively. DNA first binds straight DNA (Step 1) and forms a straight DNA–protein intermediate (Step 2), and finally DNA bending is followed to form a final complex (Step 3). A complex in which one side of the DNA flanking sequences bending (shown in parentheses) may exist along the way between Steps 2 and 3.
Materials and Methods
Sample Preparation.
Cell growth and IHF expression.
The protein was purified either from the E. coli strain containing the plasmid HN880, which was a gift from the laboratory of Howard Nash (National Institutes of Health, Bethesda, MD), or from a plasmid containing pPR204 WT-IHF which was kindly provided by the laboratory of Phoebe Rice (University of Chicago, Chicago, IL). With the former, the cells were grown as described by Nash et al. (24). In the latter, it was expressed in E. coli strain BL21 Start (DE3) (Invitrogen, Carlsbad, CA) according to the manufacturer's instruction. The cells were grown and induced as described by Lynch et al. (7). Purification of IHF was carried out following previously published procedures (7) with minor modifications from either cell. For the cell lysis, instead of lysozyme, a microfluidizer was used. Approximately 35 g of cells was resuspended in 160 ml of buffer containing 50 mM Tris·HCl at pH 6.8, 1.0 mM EDTA, 10 mM β-mercaptoethanol (β-ME), 10 mM glycerol, and 20 mM NaCl. The resuspended material was run through the microfluidizer at 10,000 psi at 4°C. The lysed extract was centrifuged and precipitated following the protocol described by Nash et al. (24). The resulting pellets were suspended in buffer A (50 mM Tris·HCl at pH 7.4, 2 mM EDTA, 10 mM β-ME, and 10% glycerol) and dialyzed against buffer A. The dialysate was applied to a P-11 phosphocellulose column (Whatman, Middlesex, UK). Purified fractions of IHF were eluted with 260 ml of buffer A with a 0.1–1.2 M KCl gradient. The fractions containing IHF were identified by 15% SDS/PAGE gel. The IHF fractions were combined and dialyzed against buffer B (15 mM NaH2PO4–Na2HPO4 at pH 6.4, 0.5 mM EDTA, and 5% glycerol) containing 50 mM NaCl. The resultant dialysate was then applied to a Mono S column (Amersham Pharmacia, Piscataway, NJ) and eluted with a gradient from 0.05 to 0.65 M NaCl of 180 ml of buffer B. The fractions containing IHF were dialyzed against 20 mM Tris·HCl (pH 7.4), 50 mM (NH4)2SO4, 0.5 mM EDTA, and 2.5% glycerol (6). The final concentration of IHF was determined by gas chromatography-mass spectrometric analysis at the Keck Foundation (Yale University).
Oligonucleotides.
Oligonucleotides were synthesized by the Keck Foundation (Yale University). Sequences prepared containing the H′ site, which we call intact substrate, is shown in Fig. 1b. Fluorescein-dT and TAMRA-dT (Glen Research, Sterling, VA) labels were incorporated into 5′ ends of thymidine on the top (boxed) and bottom sequences (underlined) in Fig. 1b. The nick A and nick B substrates were prepared such that there was a break in the phosphate backbone indicated by the arrows in the x-ray crystal structure in Fig. 1a and also in the DNA sequences in Fig. 1c. Therefore, for the nick substrates, three DNA sequences were prepared. The long substrate top strand sequence was 5′-TCGATCAGAGTAGCTGGCCAAAAAAGCATTGCTTATCAATTTGTTGCACCAGCGATCAGTGCATC-3′ (italicized thymidine represents fluorescein-dT) and bottom one was 3′-AGCTAGTCTCATCGACCGGTTTTTTCGTAACGAATAGTTAAACAACGTGGTCGCTAGTCACGTAG–5′ (underlined thymidine denotes TAMRA-dT). The fluorescent labels were incorporated into the long substrate so that the distance between the two fluorescent dye pair remains the same as that in intact substrate. Unlabeled strands for nick substrates and the fluorescein-labeled strands of intact and nick substrates were purified with a 15% urea denaturing gel, and the long substrate was purified with a 10% urea denaturing gel. Similarly, TAMRA-labeled strands were purified with a native gel. The concentrations of each oligonucleotide were determined by measuring the UV absorption at 260 nm. The molar extinction coefficient used to calculate the concentration by Beer's Law was obtained by using the Oligonucleotide Properties Calculator by Northwestern University (www.basic.northwestern.edu/biotools/oligocalc.html). For the intact and long samples, equal molar concentrations of top and bottom oligonucleotides were mixed. For the nick A and nick B samples, equal molar concentrations of all three strands were put together. The oligonucleotides were hybridized in 10 mM Tris·Cl at pH 8.0 and 0.1 mM EDTA and the sample was heated to 90°C followed by slow cooling to room temperature for 12 h. DNA duplex formation was confirmed by running a prepared duplex sample on a 15% native acrylamide gel stained with 1× SYBR Gold. This process enabled the detection of the presence of any excess single strand of DNA.
Stopped-Flow Experiment.
Instrumentation and parameters.
Kinetic measurements were performed on a stopped-flow spectrofluorimeter DX 17MV (Applied Photophysics, Leatherhead, UK). The excitation wavelength was set at 485 nm (±5 nm), and the fluorescence change was detected by using a 515-nm cut-off optical filter (Andover Corporation, Salem, NH). The samples were allowed to thermally equilibrate for 1 min after being placed into the drive syringes. One thousand data points were collected for each measurement, and four to five kinetic traces were acquired at every IHF concentration point. Each trace was fit to the appropriate equation to obtain the rates and amplitudes of the curves by using the graphic software Origin version 6.0 (Microcal, Northampton, MA).
Association kinetics.
All reactions were carried out in IHF binding buffer (20 mM Tris·HCl, pH 8.0/100 mM KCl/1 mM EDTA/0.01% Nonidet P-40). The IHF and DNA association profile was monitored by mixing labeled DNA and IHF. The stock concentration of labeled DNA was kept constant (10 nM) while the stock concentrations of IHF were varied from 50 nM to 1 μM so that the association reaction could be analyzed by a pseudofirst-order approximation. The association experiments were conducted at 10°C, 20°C, and 30°C for the intact substrate and at 20°C for nick A, nick B, and long substrates.
Control experiment.
A control experiment was carried out before each set of experiments by rapid mixing of labeled DNA and buffer. No signal change was observed in this experiment, which is indicative of the absence of photobleaching of fluorescein and/or contaminants in the spectrometer. The fluorescein-only-labeled duplex was also subject to the same rapid mixing reaction with buffer. Once again, this process did not result in a change in signal. Thus all of the kinetic traces collected by the stopped-flow experiments were fit to the appropriate equations without any corrections for photobleaching or other artifacts.
Acknowledgments
We thank Howard Nash and Phoebe Rice for providing E. coli and plasmids for the expression of IHF. This work was supported by National Institutes of Health Grant GM 21966.
Abbreviations
- IHF
integration host factor
- TAMRA
tetramethyl-6-carboxyrhodamine.
Footnotes
The authors declare no conflict of interest.
References
- 1.Rhodes D, Schwabe JWR, Chapman L, Fairall L. Philos Trans R Soc London B. 1996;351:501–509. doi: 10.1098/rstb.1996.0048. [DOI] [PubMed] [Google Scholar]
- 2.Vonhippel PH. Science. 1994;263:769–770. [Google Scholar]
- 3.Hegde RS. Annu Rev Biophys Biomol Struct. 2002;31:343–360. doi: 10.1146/annurev.biophys.31.100901.142129. [DOI] [PubMed] [Google Scholar]
- 4.Horton NC, Dorner LF, Perona JJ. Nat Struct Biol. 2002;9:42–47. doi: 10.1038/nsb741. [DOI] [PubMed] [Google Scholar]
- 5.Bareket-Samish A, Cohen I, Haran TE. J Mol Biol. 2000;299:965–977. doi: 10.1006/jmbi.2000.3797. [DOI] [PubMed] [Google Scholar]
- 6.Rice PA, Yang S, Mizuuchi K, Nash HA. Cell. 1996;87:1295–1306. doi: 10.1016/s0092-8674(00)81824-3. [DOI] [PubMed] [Google Scholar]
- 7.Lynch TW, Read EK, Mattis AN, Gardner JF, Rice PA. J Mol Biol. 2003;330:493–502. doi: 10.1016/s0022-2836(03)00529-1. [DOI] [PubMed] [Google Scholar]
- 8.Friedman DI. Cell. 1988;55:545–554. doi: 10.1016/0092-8674(88)90213-9. [DOI] [PubMed] [Google Scholar]
- 9.Landy A. Annu Rev Biochem. 1989;58:913–949. doi: 10.1146/annurev.bi.58.070189.004405. [DOI] [PubMed] [Google Scholar]
- 10.Yang SW, Nash HA. EMBO J. 1995;14:6292–6300. doi: 10.1002/j.1460-2075.1995.tb00319.x. [DOI] [PMC free article] [PubMed] [Google Scholar]
- 11.Wang S, Cosstick R, Gardner JF, Gumport RI. Biochemistry. 1995;34:13082–13090. doi: 10.1021/bi00040a020. [DOI] [PubMed] [Google Scholar]
- 12.Murtin C, Engelhorn M, Geiselmann J, Boccard F. J Mol Biol. 1998;284:949–961. doi: 10.1006/jmbi.1998.2256. [DOI] [PubMed] [Google Scholar]
- 13.Craig NL, Nash HA. Cell. 1984;39:707–716. doi: 10.1016/0092-8674(84)90478-1. [DOI] [PubMed] [Google Scholar]
- 14.Yang CC, Nash HA. Cell. 1989;57:869–880. doi: 10.1016/0092-8674(89)90801-5. [DOI] [PubMed] [Google Scholar]
- 15.Swinger KK, Rice PA. Curr Opin Struct Biol. 2004;14:28–35. doi: 10.1016/j.sbi.2003.12.003. [DOI] [PubMed] [Google Scholar]
- 16.Dhavan GM, Crothers DM, Chance MR, Brenowitz M. J Mol Biol. 2002;315:1027–1037. doi: 10.1006/jmbi.2001.5303. [DOI] [PubMed] [Google Scholar]
- 17.Parkhurst KM, Richards RM, Brenowitz M, Parkhurst LJ. J Mol Biol. 1999;289:1327–1341. doi: 10.1006/jmbi.1999.2835. [DOI] [PubMed] [Google Scholar]
- 18.Parkhurst KM, Brenowitz M, Parkhurst LJ. Biochemistry. 1996;35:7459–7465. doi: 10.1021/bi9530301. [DOI] [PubMed] [Google Scholar]
- 19.Hiller DA, Fogg JM, Martin AM, Beechem JM, Reich NO, Perona JJ. Biochemistry. 2003;42:14375–14385. doi: 10.1021/bi035520w. [DOI] [PubMed] [Google Scholar]
- 20.Berg OG, Winter RB, Vonhippel PH. Biochemistry. 1981;20:6929–6948. doi: 10.1021/bi00527a028. [DOI] [PubMed] [Google Scholar]
- 21.Holbrook JA, Tsodikov OV, Saecker RM, Record MT., Jr J Mol Biol. 2001;310:379–401. doi: 10.1006/jmbi.2001.4768. [DOI] [PubMed] [Google Scholar]
- 22.Ferreiro DU, de Prat-Gay G. J Mol Biol. 2003;331:89–99. doi: 10.1016/s0022-2836(03)00720-4. [DOI] [PubMed] [Google Scholar]
- 23.Ruusala T, Crothers DM. Proc Natl Acad Sci USA. 1992;89:4903–4907. doi: 10.1073/pnas.89.11.4903. [DOI] [PMC free article] [PubMed] [Google Scholar]
- 24.Nash HA, Robertson CA, Flamm E, Weisberg RA, Miller HI. J Bacteriol. 1987;169:4124–4127. doi: 10.1128/jb.169.9.4124-4127.1987. [DOI] [PMC free article] [PubMed] [Google Scholar]
- 25.Kuznetsov SV, Sugimura S, Vivas P, Crothers DM, Ansari A. Proc Natl Acad Sci USA. 2006;103:18515–18520. doi: 10.1073/pnas.0608394103. [DOI] [PMC free article] [PubMed] [Google Scholar]


