Abstract
The knowledge of the microscopic structure of water at interfaces is essential for the understanding of interfacial phenomena in numerous natural and technological environments. To study deeply buried liquid water–solid interfaces, high-energy x-ray reflectivity measurements have been performed. Silicon wafers, functionalized by a self-assembled monolayer of octadecyl-trichlorosilane, provide strongly hydrophobic substrates. We show interfacial density profiles with angstrom resolution near the solid–liquid interface of water in contact with an octadecyl-trichlorosilane layer. The experimental data provide clear evidence for the existence of a hydrophobic gap on the molecular scale with an integrated density deficit ρd = 1.1 Å g cm−3 at the solid–water interface. In addition, measurements on the influence of gases (Ar, Xe, Kr, N2, O2, CO, and CO2) and HCl, dissolved in the water, have been performed. No effect on the hydrophobic water gap was found.
Keywords: hydrophobicity, interfacial water, x-ray reflectivity
Hydrophobicity, i.e., the repulsion of water, is a well known phenomenon in our environment (1). The generic hydrophobic interaction occurs between a nonpolar molecule and the water molecule. In bulk water, the hydrophobic interaction leads to the so-called hydrophobic hydration of unpolar solvents which generically results in a reduced density and an increased heat capacity. The seminal study on the thermodynamics of nonpolar solvation goes back to Frank and Evans in the mid-1940s (2). While of course the details of structural ordering remained unclear, it became evident that nonpolar solvation is a negentropic process which appeared later to become a key element to understand protein folding and stability (3). The microscopic details of how the nonpolar molecules interact with each other in water is a key information to understand how proteins and biological membranes maintain their structural integrity. Today we know that hydrophobic bonds are a major force driving proper protein folding, and that the interplay between hydrophobic and hydrophilic interactions is important to stabilize the shape of biological structures, such as proteins and cell membranes (4).
Hydrophobic surfaces are of particular interest, since they control many interfacial phenomena in biology and technology. However, the microscopic details of how water meets a hydrophobic interface are still not settled and in fact rather controversial. A basic missing piece of information is the size of the hydrophobic gap between the water phase and the hydrophobic surface. Wetting studies on mesoporous silica (5) indicate that water is separated from the hydrophobic walls by a vapor gap of thickness 3–4 Å. Molecular dynamics simulations carried out for liquid water between flat hydrophobic surfaces predict density oscillations extending up to 10 Å into the adjacent water accompanied by a molecular orientational order affecting a water layer of 7 Å. The simulations, as well as the results from surface vibrational spectroscopy, show that the water molecules near the hydrophobic wall produce extensively dangling hydrogen bonds (6, 7). From AFM studies on hydrophobic Si (111) wafers coated with polystyrene it has been concluded that nanobubbles appear at the water–polystyrene interface that decrease in size and number as the hydrophobicity of the subphase increases (8). Recent neutron reflectivity studies on water–octadecyl-trichlorosilane (OTS) interfaces seem to imply the existence of an extended hydrophobic gap up to several nm (9–11) which is in severe conflict with results from theoretical and simulation studies (12–15). Furthermore, a rather confusing situation appeared around the influence of dissolved gases on the hydrophobic gap, in particular in conjunction with confined media and the formation of nanobubbles (16–18). Low resolution neutron reflectivity studies (11) indicate a strong influence of dissolved gases on the hydrophobic gap with the size of the gap varying by more than a factor of 5 for different gases.
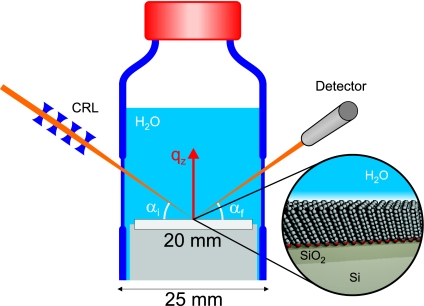
Here we present a high-resolution x-ray reflectivity study of water in contact with OTS and present first rigorous data on the size of the hydrophobic gap as well as on the influence of dissolved gas. These data have been obtained by an experimental setup as depicted in Fig. 1: We used silicon wafers covered by a hydrophobic OTS layer immersed in bulk water kept in a sample cell, which allows control of the amount of gas in the water. High-energy x-ray microbeams have been used to penetrate to the hydrophobic interface and to gain high-resolution information on the hydrophobic gap. We show rigorous results on the integrated water density depletion at the interface and a rigorous upper limit for the gap size. We further give evidence that the hydrophobic gap is not affected by dissolved gases, such as the nonpolar molecule CO2 or the polar molecule CO.
Fig. 1.
Sketch of the experimental setup. The microfocused high-energy x-ray beam penetrates the sample cell from the side illuminating the interface to be studied. The x-ray beam is reflected from the interface and detected by a scintillation counter. Zooming in at the interface, a sketch of the structure of the OTS self-assembled monolayer in contact with water is shown. The reflectivity is measured as a function of vertical momentum transfer qz by varying the incident angle αi and exit angle αf of the x-ray beam symmetrically.
Results and Discussion
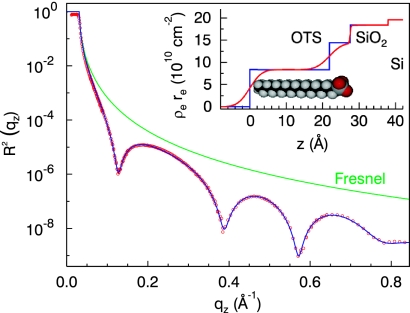
Fig. 2 shows the x-ray reflectivity R2(qz) associated with the dry OTS layer grown on SiO2. It exhibits the three characteristics of such reflectivity data sets, i.e., the total reflection regime for qz < qc = 0.03 Å−1 which is determined by the electron density difference between air and silicon, the rapid decay of the reflected intensity for qz > qc commonly known as the Fresnel reflectivity curve (green line), and finally the thickness oscillations originating from the thin OTS layer. From this intensity distribution the laterally averaged electron density profile across the interface can be deduced in a rather straightforward way (see Materials and Methods). In the actual fitting procedure the experimental data in the range of 0.06 Å < qz < 0.82 Å−1 have been used resulting in an absolute density profile shown in the inset of Fig. 2. The spatial resolution is given by the maximum momentum transfer qz of the experiment, here qmax = 0.8 Å−1, which is equivalent to d = πqmax−1 = 4 Å. By using one slab for the SiO2 layer on the Si substrate and two slabs for the head and the tail group of the OTS, respectively, we were able to get a perfect fit to the measured reflectivity curve (blue line in Fig. 2). We find that the oxide layer is 11 Å thick with a density of ρSiO2 = 2.2 g cm−3, thus, slightly smaller than the bulk density of the silicon substrate (ρSi = 2.32 g cm−3). The thickness and the density of the head and the tail group are dh = 5.7 Å, ρh = 1.7 g cm−3 and dt = 21.8 Å, ρt = 0.86 g cm−3, respectively (see Fig. 2 Inset). These values are in very good agreement with the work of Tidswell et al. (19, 20), showing that the OTS layer is homogenous.
Fig. 2.
X-ray reflectivity of the dry OTS layer grown on a native SiO2 layer on top of a silicon wafer substrate. For comparison the Fresnel reflectivity of a pure silicon substrate is shown (green line). The reflectivity is perfectly reproduced by a two layer model for the OTS self-assembled monolayers for the head and the tail group of the OTS molecule (blue line). (Inset) Electron density profile deduced from the measured reflectivity curve (blue line, box model for the electron density; red line, real density profile including roughness of the layers).
As expected, the extracted value for ρt lies in between those of liquid n-octadecane (ρ = 0.78 g cm−3) and single crystalline n-octane [ρ = 0.93 g cm−3 (21)] or high-density polyethylene PE-HD (ρ = 0.94–0.97 g cm−3). This is explained by the more densely packed hydrocarbon chains of the anchored silane on the native SiO2 substrate in comparison to the corresponding disordered liquid phase. On the other hand, a density smaller than the one found in densely packed single crystalline material is expected. The length of a stretched linear alkyl chain CnH2n+1 in all-trans configuration can be estimated by n − 1 times the projected C–C bond length of 1.265 Å plus 1.5 Å for the terminal methyl group, resulting in a maximal length of 23 Å for n = 18. Compared with the value extracted from the x-ray reflectivity data one gets a tilt angle of ≈20°, which is explained by the larger silane anchor group in comparison with the diameter of the hydrocarbon chain. The Van der Waals interaction between the alkyl chains therefore favors a tilt resulting in a closer packing of the OTS tails.
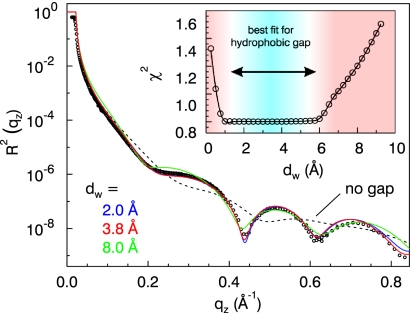
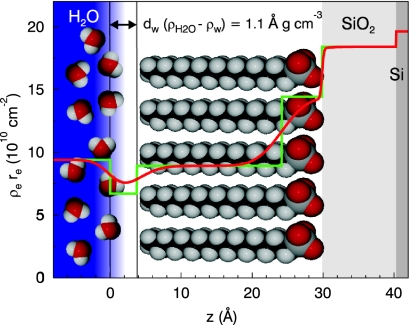
Fig. 3 shows the key result of our study, i.e., the x-ray reflectivity curve as obtained with the OTS sample immersed in degassed water. To appreciate that the observed pronounced intensity oscillations are a direct evidence for the appearance of a density depletion at the water–OTS interface, we have calculated the expected reflectivity profile, if the water molecules made a direct contact with the OTS molecules (black dashed curve). The weak oscillations result from the fact, that the average electron density of water and OTS is very close to each other making the interface almost invisible to x-rays (contrast-matching; see Fig. 4). In turn, the observed density oscillations appear only in the x-ray experiment, if a distinct density change appears between the water and the hydrocarbon chain. Detailed modeling confirmed that only an electron-depleted gap at the water–OTS interface can reproduce the phase of the oscillations. Apparently, the repulsive interaction between the H2O molecules and the OTS leads to rearrangement of the H2O molecules adjacent to hydrophobic alkyl chains such that a depleted layer emerges.
Fig. 3.
X-ray reflectivity of the OTS layer immersed in degassed water. The reflectivity is reproduced by a three layer model for the OTS layer (head and tail group of the OTS molecule) on SiO2 and a depletion layer between the OTS layer and the bulk water. The solid lines give the best fits for a fixed thickness dw of the hydrophobic gap. (dashed line, no gap; blue, 2.0 Å; red, 3.8 Å; green, 8.0 Å). The inset shows that for 1 Å < dw < 6 Å (blue range) all fits give an integrated density deficit of ρwdw = 1.1 Å g cm−3 with comparable deviations χ 2 from the experimental curve (circles).
Fig. 4.
The reflectivity is reproduced by a four layer model including SiO2, an OTS layer (head and tail group of the OTS molecule), and a depletion layer between the OTS layer and the bulk water (green line). The underlying electron density profile corresponds to the red reflectivity curve in Fig. 3 (green line, box model for the electron density; red line, real density profile including the roughness of the layers).
To model the reflectivity curve and extract microscopic details of this gap, we have kept all of the parameters fixed which have already been determined at the dry samples and have only allowed for a densification of the OTS tail group (hydrocarbon chain, dtρt = const) of 7%, while the product of density and thickness has been kept constant, and an additional density depletion layer of thickness dw in between the hydrophobic alkyl chains and the water phase. The resulting best fit is shown in Fig. 3 (red curve, dw = 3.8 Å, ρw/ρH2O = 0.71). Fig. 4 shows the corresponding electron density profile. The most important result is that the measured data give a clear-cut evidence for the existence of a layer with reduced electron density between the OTS and the water on a molecular scale. We found a value of (ρH2O − ρw)dw = 1.1 Å g cm−3 for the integrated density deficit. It is this deficit which acts as a phase shift in the x-ray reflectivity, making the contrast-matched OTS tail explicitly visible.
To get access to the size of the hydrophobic gap, we have performed extensive fitting of the data taking into account the roughness of the OTS film (σdry = 2.6 Å) and the finite range in qz resulting in a real space resolution in the order of πqmax−1 = 4 Å. Fig. 3 shows a representative selection of calculated reflection patterns with fixed thickness dw of the hydrophobic gap ranging from dw = 2.0 Å (blue curve) to dw = 8.0 Å (green curve). For fixed values of 1 Å < dw < 6 Å all fits were comparable in quality indicated by the constant deviation χ2 ∝ minα Σi (lnαIiexp − lnIical)2 between the experimental (Iexp) and calculated (Ical) data (see Fig. 3 Inset). This shows that within the q-range covered by the experiment and with the given interfacial roughness of the OTS layer of σOTS = 2.6 Å, it is not possible to fix the gap width better than to the range 1–6 Å. The value of 6 Å is a very solid upper limit for the hydrophobic gap. On the other hand for a thickness dw < 1.1 Å of the hydrophobic gap an integrated density deficit of (ρH2O−ρw)dw = 1.1 Å g cm−3 can only be achieved with an unphysical (negative) interfacial layer density ρw. Therefore this range in the gap size and the total density deficit (ρH2O−ρw) dw = 1.1 Å g cm−3 associated with the hydrophobic gap turn out to be very robust experimental results. Almost all earlier structural studies concluded in much larger values for the hydrophobic gap (11).
A current controversy focuses onto the existence of gas nanobubbles at the water–OTS interface. Within our very high instrumental resolution parallel to the interface of Δqx < 10−5Å−1 (corresponding to a lateral size of 70 μm), we detected no off-specular diffuse scattering and no broadening of the reflectivity profiles. This implies that any emerging gas bubble must be larger than 70 μm resulting inter alia into totally unphysical contact angles. Our results thus provide a very strong evidence that the hydrophobic gap is not caused by the formation of gas bubbles at the interface.
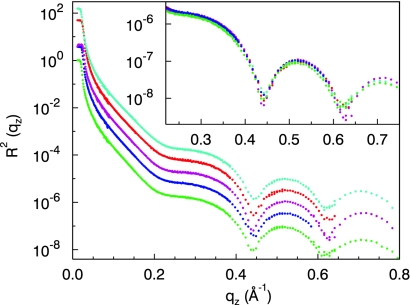
One can intuitively assume that any dissolved gas within the water phase would segregate at the hydrophobic interface thereby further increasing the gap size and reducing interface energy costs: We therefore investigated in great detail the influence of dissolved gases on the hydrophobic gap. For this, we have immersed the hydrophobic interface in water which was saturated with a variety of gases [inert noble (Ar, Xe, Kr), linear nonpolar (N2, O2, CO2), and polar (CO)] and a 0.5 M aqueous HCl solution. Selected reflectivity curves for different gases are shown in Fig. 5. It is evident that all of the curves are virtually identical up to the maximum momentum transfer accessible in the experiment. Therefore, we conclude that, within our real space resolution of 4 Å, there is no evidence from our x-ray reflectivity measurements for an effect of dissolved gases on the size of the hydrophobic gap.
Fig. 5.
X-ray reflectivity of the OTS layer immersed in water, which was saturated with a variety of gases [light green (bottom), degassed; blue, CO; purple, CO2; red, Ar; dark green (top), 0.5 M HCl]. The curves are shifted vertically for clarity. (Inset) Magnification of the high q-range, where the measurement is most sensitive. All measured reflectivity curves are identical up to the maximum momentum transfer achieved in the experiments.
These results are in severe conflict with the conclusions drawn from the neutron reflectivity studies (11). We also note that extended depletion layers as extracted from the neutron data should also show up in optical ellipsometry where no such profiles were found (22, 23). Furthermore, no indication for the influence of gases dissolved into the water on the hydrophobic gap (d < 2.5 Å) was found in heat conductance measurements (24). Our x-ray results give thus a first robust microscopic explanation for these macroscopic observations. The perturbation of the water structure by the presence of the hydrophobic interface is confined to the molecular length scale where the hydrophobic water gap is comparable to the correlation length of bulk water ξ = 4 Å (25) and the average OO distance dOO = 2.9 Å (26).
Materials and Methods
Sample Preparation.
Self-assembled monolayers of OTS were grafted onto silicon substrates covered with a native oxide layer. Substrates of 20 mm × 25 mm were cut from (100) oriented Si-wafers (Siltronic; thickness 625 μm, boron, p-type, 10–20 Ω cm). The sample edges were polished to avoid parasitic scattering at small incident angles αi. The substrates were cleaned in an ultrasonic bath using standard solvents (isopropanol, acetone, chloroform) for 15 min, respectively. To prepare a OH surface termination of the SiO2 layer, the substrates were treated in freshly prepared Piranha acid (one part H2O2 35%, three parts H2SO4 98%) for 30 min. After thorough rinsing with ultrapure water, the substrates were completely wetted with water indicating a high degree of OH surface termination. Before further treatment the samples were blown dry with a jet of pure Ar gas.
The self-assembled monolayer was prepared from a solution of 1 mM OTS (Aldrich; 90%) in a mixture of 75% n-hexane (Riedel-de Haën; 99%, puriss. p.a.) and 25% chloroform (Fluka; 99.8%, puriss. p.a.). After 3 h the samples were removed from the deposition solution and rinsed twice in fresh n-hexane and toluene.
Degassed water was prepared from ultrapure water (Millipore Gradient; 1018 MΩ cm) by heavily stirring with a PTFE coated magnetic stir bar (rotation speed ≈1,000 min−1) under vacuum for 1 h. Water enriched with various gases was prepared from degassed water by bubbling the respective gas from a glass frit (porosity 100–160 μm) through the water until saturation was achieved. The so-prepared water was sucked into the sealed sample cell through a PFA tube to avoid contact with air.
X-Ray Reflectivity.
In x-ray reflectivity experiments a highly collimated monochromatic x-ray beam hits the sample surface under a shallow angle αi and is reflected of the surface/interface (see Fig. 1). The x-ray reflectivity shows the total reflection regime followed by a strong intensity decay (Fresnel curve). The reflected intensity is recorded by an x-ray detector as a function of the incidence angle, thereby performing a scan in reciprocal space which is perpendicular to the surface/interface. In turn, the recorded signal carries detailed information on the laterally averaged electron density profile, which can be recovered from the x-ray data by several well established theoretical schemes (27). Here we used the so-called sliced Parrat formalism (0.5-Å-thick slabs), which is based on a rigorous dynamical scattering theory (28). In this approach, the density profile across the interface under investigation is modeled as a series of slabs of constant density and applying the proper electrodynamic boundary conditions between the slabs. The first x-ray reflectivity measurements on water surfaces have been presented by Braslau et al. (29), revealing its intrinsic roughness as caused by capillary waves.
Experimental Setup.
x-ray reflectivity measurements were performed at the high-energy beamline ID15A, European Synchrotron Radiation Facility, using the surface and interface scattering instrument HEMD for high-energy microdiffraction (30). A sketch of the experimental setup is shown in Fig. 1. The high-energy x-ray beam (E = 72.5 keV) was focused by a set of compound refractive lenses (CRL) on the sample to reduce the footprint at small incident angles αi. The measured beam size at the sample position was 5 μm normal to the sample surface and 25 μm parallel to the sample surface. The sample was contained in a cylindrical glass cell (Schott Duran), which was tightly sealed by a PTFE screw cap equipped with connectors to fill and empty the cell with high-purity water. The sample cell is mounted on a polyethylene holder. Two 0.5 mm thin planar glass slides, molded parallelly into the cell, serve as windows for the high-energy x-ray beam. The sample cell and all connectors were thoroughly cleaned before the experiments. A continuous wedge absorber (polished lead glass) and a fast shutter were inserted into the primary beam to reduce the radiation dose on the sample as much as possible.
Radiation Damage.
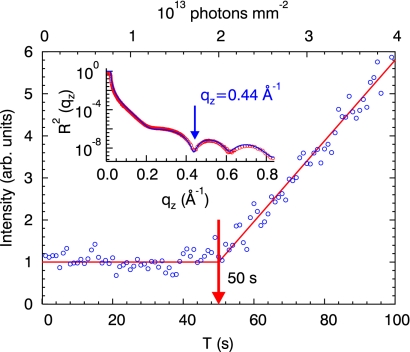
While consecutive reflectivity measurements on dry OTS samples could be recorded without any noticeable beam damage, measurements on OTS immersed in water cause severe damage of the organic molecules due to creation of free radicals in the water phase. To quantify the interface degradation with radiation dose, we monitored the temporal changes in the reflected intensity from the sample immersed in water, exploiting the fact that we have maximum sensitivity to structural changes in the OTS film at the minimum of the reflectivity curve at qz = 0.44 Å−1 (see Fig. 6 Inset). Smallest structural modifications will then disturb the destructive interference and lead to a clearly visible intensity increase (known in conventional optics as “Aufhellung”). Fig. 6 shows clearly that, after an incubation time of ≈50 s, the x-ray intensity at the interference minimum starts to increase, indicating the onset of the degradation of the OTS layer. To assure that each data point has been recorded from an intact OTS layer, the cell was translated perpendicular to the x-ray beam while measuring the reflectivity of the sample immersed in water.
Fig. 6.
Time-dependent variation of the x-ray reflectivity at the angle of destructive interference at qz = 0.44 Å−1 (see Inset) with the sample immersed in water. The radiation damage sets in after ≈50 s. The total deposited radiation dose is denoted at the top axis.
Acknowledgments
We thank P. Dreier (Siltronic, Munich, Germany) for supplying the high-quality Si-wafer substrates. This work was partially supported by the Australian Research Council Special Research Centre Scheme.
Abbreviation
- OTS
octadecyl-trichlorosilane.
Footnotes
The authors declare no conflict of interest.
References
- 1.Chandler D. Nature. 2005;437:640–647. doi: 10.1038/nature04162. [DOI] [PubMed] [Google Scholar]
- 2.Frank HS, Evans MW. J Chem Phys. 1945;13:507–532. [Google Scholar]
- 3.Kauzmann W. Adv Prot Chem. 1959;14:1–63. doi: 10.1016/s0065-3233(08)60608-7. [DOI] [PubMed] [Google Scholar]
- 4.Israelachvili J, Wennerström H. Nature. 1996;379:219–225. doi: 10.1038/379219a0. [DOI] [PubMed] [Google Scholar]
- 5.Helmy R, Kazakevich Y, Ni C, Fadeev AY. J Am Chem Soc. 2005;127:12446–12447. doi: 10.1021/ja053267c. [DOI] [PubMed] [Google Scholar]
- 6.Lee CY, McCammon JA, Rossky PJ. J Chem Phys. 1984;80:4448–4455. [Google Scholar]
- 7.Du Q, Freysz E, Shen YR. Science. 1994;264:826–828. doi: 10.1126/science.264.5160.826. [DOI] [PubMed] [Google Scholar]
- 8.Simonsen AC, Hansen PL, Klosgen B. J Colloid Interface Sci. 2004;273:291–299. doi: 10.1016/j.jcis.2003.12.035. [DOI] [PubMed] [Google Scholar]
- 9.Steitz R, Gutberlet T, Hauss T, Klosgen B, Krastev R, Schemmel S, Simonsen AC, Findenegg GH. Langmuir. 2003;19:2409–2418. [Google Scholar]
- 10.Schwendel D, Hayashi T, Dahint R, Pertsin A, Grunze M, Steitz R, Schreiber F. Langmuir. 2003;19:2284–2293. [Google Scholar]
- 11.Doshi DA, Watkins EB, Israelachvili JN, Majewski J. Proc Natl Acad Sci USA. 2005;102:9458–9462. doi: 10.1073/pnas.0504034102. [DOI] [PMC free article] [PubMed] [Google Scholar]
- 12.Lum K, Chandler D, Weeks JD. J Phys Chem B. 1999;103:4570–4577. [Google Scholar]
- 13.Grigera JR, Kalko SG, Fischbarg J. Langmuir. 1996;12:154–158. [Google Scholar]
- 14.Jensen TR, Jensen MO, Reitzel N, Balashev K, Peters GH, Kjaer K, Bjornholm T. Phys Rev Lett. 2003;90:086101. doi: 10.1103/PhysRevLett.90.086101. [DOI] [PubMed] [Google Scholar]
- 15.Mamatkulov SI, Khabibullaev PK, Netz RR. Langmuir. 2004;20:4756–4763. doi: 10.1021/la036036x. [DOI] [PubMed] [Google Scholar]
- 16.Mahnke J, Stearnes J, Hayes RA, Fornasiero D, Ralston J. Phys Chem Chem Phys. 1999;1:2793–2798. [Google Scholar]
- 17.Koishi T, Yoo S, Yasuoko K, Zeng XC, Narumi T, Susukita R, Kawai A, Furusawa H, Suenaga A, Okimoto N, et al. Phys Rev Lett. 2004;93:185701. doi: 10.1103/PhysRevLett.93.185701. [DOI] [PubMed] [Google Scholar]
- 18.Luzar A, Bratko D. J Phys Chem B. 2005;109:22545–22552. doi: 10.1021/jp054545x. [DOI] [PubMed] [Google Scholar]
- 19.Tidswell IM, Ocko BM, Pershan PS, Wassermann SR, Whitesides GM, Axe JD. Phys Rev B. 1990;41:1111–1128. doi: 10.1103/physrevb.41.1111. [DOI] [PubMed] [Google Scholar]
- 20.Tidswell IM, Rabedeau TA, Pershan PS, Kosowsky SD, Folkers JP, Whitesides GM. J Chem Phys. 1991;95:2854–2861. [Google Scholar]
- 21.Boese R, Weiss HC, Blaser D. Angew Chem Int Ed. 1999;38:988–992. doi: 10.1002/(SICI)1521-3773(19990401)38:7<988::AID-ANIE988>3.0.CO;2-0. [DOI] [PubMed] [Google Scholar]
- 22.Mao M, Zhang J, Yoon RH, Ducker WA. Langmuir. 2004;20:1843–1849. [Google Scholar]
- 23.Takata Y, Cho JHJ, Law BM, Aratono M. Langmuir. 2006;22:1715–1721. doi: 10.1021/la052599s. [DOI] [PubMed] [Google Scholar]
- 24.Ge Z, Cahill DG, Brown PV. Phys Rev Lett. 2006;96:186101. doi: 10.1103/PhysRevLett.96.186101. [DOI] [PubMed] [Google Scholar]
- 25.Xie Y, Ludwig KF, Morales G, Hare DE, Sorensen CM. Phys Rev Lett. 1993;71:2050–2053. doi: 10.1103/PhysRevLett.71.2050. [DOI] [PubMed] [Google Scholar]
- 26.Soper AK, Ricci MA. Phys Rev Lett. 2000;84:2881–2884. doi: 10.1103/PhysRevLett.84.2881. [DOI] [PubMed] [Google Scholar]
- 27.Tolan M. X-Ray Scattering from Soft Matter Thin Films. Berlin: Springer; 1999. [Google Scholar]
- 28.Parratt LG. Phys Rev B. 1954;95:359–369. [Google Scholar]
- 29.Braslau A, Deutsch M, Pershan PS, Weiss AH, Als-Nielsen J, Bohr J. Phys Rev Lett. 1985;54:114–117. doi: 10.1103/PhysRevLett.54.114. [DOI] [PubMed] [Google Scholar]
- 30.Reichert H, Honkimäki V, Snigirev A, Engemann S, Dosch H. Physica B. 2003;336:46–55. doi: 10.1103/PhysRevLett.92.205701. [DOI] [PubMed] [Google Scholar]


