Abstract
Mammalian preimplantation blastocysts exhibit insulin-stimulated glucose uptake despite the absence of the only known insulin-regulated transporter, GLUT4. We describe a previously unidentified member of the mammalian facilitative GLUT superfamily that exhibits ≈20–25% identity with other murine facilitative GLUTs. Insulin induces a change in the intracellular localization of this protein, which translates into increased glucose uptake into the blastocyst, a process that is inhibited by antisense oligoprobes. Presence of this transporter may be necessary for successful blastocyst development, fuel metabolism, and subsequent implantation. Moreover, the existence of an alternative transporter may explain examples in other tissues of insulin-regulated glucose transport in the absence of GLUT4.
Glucose transport activity in early preimplantation murine embryos has been attributed to the known facilitative glucose transporters, GLUT1, GLUT2, and GLUT3 (1–4). GLUT1 is present throughout the preimplantation period, which begins with the one-cell embryo and ends with the blastocyst stage. GLUT2 and GLUT3 are first expressed at a late eight-cell stage and remain present for the rest of the preimplantation period. The simultaneous appearance of all three transporters corresponds to the critical time in mammalian development when embryonic fuel metabolism switches from the oxidation of lactate and pyruvate via the Krebs cycle and oxidative phosphorylation to anaerobic metabolism of glucose via glycolysis. This critical substrate change is thought to be due to the biosynthetic and developmental demands placed on the embryo as the blastocyst creates the fluid-filled blastocoel and prepares for implantation. We have also shown that a significant decrease in glucose transport at this stage of development induced by maternal diabetes occurs concurrently with a premature and exaggerated increase in apoptosis in the early embryo (5). This occurrence suggests that optimal glucose transport mechanisms are necessary for preimplantation embryo survival.
Both the insulin receptor and insulin-like growth factor-1 (IGF-1) receptor are expressed at approximately the same time as this increase in glucose demand (6, 7). IGF-1, a ligand for both receptors, is present from the two-cell stage onward, whereas insulin is not made by the embryo (8). Others have shown that insulin and IGF-1 regulate glucose transport in mouse blastocysts via the IGF-1 receptor (9). The only known insulin-regulated transporter, GLUT4, however, is not expressed at any time during preimplantation development (2). For these reasons, we hypothesized that a previously unidentified, insulin-regulated GLUT may be expressed at this stage of development.
Methods
Cloning and Sequence Comparison of GLUT8.
A homologous amino acid sequence from the C terminus of GLUT1–5 was used to search the National Center for Biotechnical Information by using the tblastx program. Two rodent clones, AA052119 and H34451, were identified, and they encoded the C terminus and 3′ untranslated regions of a previously uncharacterized GLUT. These clones were used to screen a mouse blastocyst cDNA library obtained from Barbara Knowles (The Jackson Laboratory). This plasmid library was made from poly(A) RNA from a pool of day-5 mouse blastocysts as described (10). The original library was altered by cloning it into pSport (GIBCO) by using SalI and NotI sites (cloning site changes made by Sue-Yun Hwang, The Jackson Laboratory). A partial cDNA clone was identified, and gene-specific primers were used to identify the remainder of the GLUT8 cDNA by using 5′ rapid amplification of cDNA ends (CLONTECH) with RNA obtained from the murine embryonic teratocarcinoma cell line F9. A full-length cDNA was PCR amplified from F9 cDNA, and the amplified product was sequenced in both directions.
GLUT8 mRNA Analysis.
Total RNA was isolated from embryonic-day-18 and 8-week-old BALB/c mouse tissues according to the method of Chomczynski and Sacchi (11). Total RNA (15 μg) was electrophoresed overnight, transferred to a GenScreen Plus membrane, and crosslinked. A 163-bp fragment of GLUT8 cDNA was amplified, diluted 1:100, reamplified, and 32P-labeled by using the Klenow fragment (Ambion, Austin, TX).
The blot containing the mRNA was prehybridized for 2 h at 42°C and subsequently hybridized overnight at 42°C in the same solution containing 1.68 × 10⁶ cpm/ml. The blot was washed two times at room temperature in 2× SSC/0.5% SDS and then washed three times for 10 min each at 65°C. The signal on the blot was detected in a Molecular Analyst PhosphorImager. The blot was stripped and reprobed with an S2 ribosomal probe as an internal control (12).
GLUT8 Protein Analysis.
A polyclonal antibody was raised against a keyhole limpet conjugate to the last 11 amino acids of the C-terminal tail (LEQVTAHFEGR) of GLUT8 by immunization of rabbits (Charles River Pharmaceuticals, Southbridge, MA). For overexpression studies, GLUT8 tagged with FLAG at the N terminus was transiently transfected by diethylaminoethyl-dextran in COS-7 cells. The cell lysates were solubilized in SDS, and 400 μg of total protein was subjected to immunoprecipitation with 10 μg of anti-FLAG M2 monoclonal antibody (Sigma). The immunoprecipitation complexes were subjected to SDS/PAGE and transferred to nitrocellulose. The blots were immunoblotted with GLUT8 antiserum (1:500), GLUT8 antiserum (1:500) plus 50 molar excess peptide, or anti-FLAG M2 (1 μg/ml), and enhanced chemiluminescence was used to detect the proteins. For the tissue Western blots, 100 μg of total protein was added to sample buffer, subjected to SDS/PAGE, and transferred to nitrocellulose. For the embryo Western blot, 279 blastocysts were pooled, added to 5× sample buffer, subjected to SDS/PAGE, and transferred. Immunoblotting was done as described above.
GLUT8 Localization Within the Mouse Blastocyst.
Two-cell and four-cell embryos were obtained from superovulated (B6 × SJL)F1 (The Jackson Laboratory) female mice 48 h after mating and cultured to a blastocyst stage as described (1). The blastocysts were fixed on glass slides and immunostained with GLUT8 peptide-purified antiserum (10 μg/ml). Fluorescence was detected with laser-scanning confocal immunofluorescent microscopy (Bio-Rad MRC-600) as described (1). As controls, fixed blastocysts were stained with preimmune serum or with immune serum plus a 50-fold molar excess of the peptide used to raise the antibody.
Functional Characterization of GLUT8 in the Mouse Blastocyst.
Antisense and hyperglycemia mouse embryo experiments.
Two-cell embryos were obtained as described above and cultured to a blastocyst stage under one of the following conditions: (i) 5 μM GLUT8 sense oligoprobe (5′-ATGAGTCCCGAGGACCCCCAG-3′), (ii) 5 μM GLUT8 antisense oligoprobe (5′-CTGGGGGTCCTCGGGACTCAT-3′), or (iii) medium with nothing added. Nonradioactive insulin-stimulated 2-deoxyglucose uptake into single blastocysts was performed with microfluorometric assays combined with enzymatic cycling reactions as described (1) with the following modifications. Blastocysts from each condition were incubated in medium at a final glucose concentration of 5.6 mM with 500 nM insulin (Sigma, bovine pancreas) for 30 min, and 2-deoxyglucose uptake was then measured as described (1). For the high-glucose conditions, two-cell embryos were cultured to a blastocyst stage in either 52 mM d-glucose or 52 mM l-glucose, and insulin-stimulated transport was measured in the fashion described above. For the GLUT1 and GLUT3 antisense oligoprobes studies, two-cell embryos were cultured to a blastocyst stage in the following conditions: (i) 5 μM GLUT1/3 antisense oligoprobes, (ii) 5 μM GLUT1/3 sense oligoprobes, or (iii) control medium containing no oligoprobes. The sequences for these oligoprobes have been published (4). Insulin-stimulated uptake was measured in the same fashion. Both confocal immunofluorescent microscopy and Western blot analysis with the respective affinity purified antibodies were performed as described above.
Xenopus oocyte injection experiments.
Stage V–VI stage oocytes were injected with 50 ng of RNA prepared from GLUT8 cDNA, GLUT1 cDNA, or GLUT4 cDNA as described (13). At 3 days after injection, uptake of 2-deoxy-d-[3H]glucose was measured as described (13). Groups of 10–20 oocytes were assayed at a time. Total membranes were prepared as described (13), and immunoblot analysis was performed with GLUT1 (1:500) and GLUT4 (1:2,500) rabbit polyclonal antibodies.
Statistical Analysis.
Differences between control values and experimental values were compared by Student's t test or by one-way ANOVA coupled with Fisher's test (by using statview 4.5) when comparisons were made between more than one experimental group. All data are expressed as means ± SEM. All experiments were performed in duplicate or triplicate. For blastocyst glucose uptake assays, at least 15 embryos were assayed in each of two or three experiments. For confocal immunofluorescent microscopy studies, at least 12 embryos were examined for each experimental group on three different days. For the oocyte glucose uptake studies, at least 12 oocytes were assayed in two different experiments. Significance was defined as P < 0.01.
Results
Cloning and Structure of GLUT8.
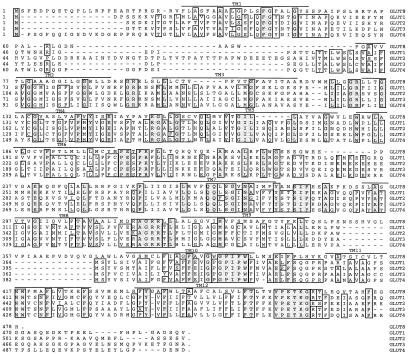
A full-length 1,843-bp cDNA encoding a 478-amino acid protein was cloned from the murine embryonic teratocarcinoma cell line F9. The protein sequence shows 22%, 25%, and 23% identity with GLUT1, GLUT3, and GLUT4, respectively (Fig. 1). This sequence contains 12 putative membrane spanning domains and a large cytoplasmic loop between TM6 and TM7 as seen with the other GLUTs. Unlike the other GLUTs, this transporter contains an extra 21 amino acids in the exofacial loop between TM9 and TM10 and is not homologous to any of the other GLUT sequences. Also, GLUT8 has a considerably shorter cytoplasmic C terminus domain, 20 amino acids, making it the shortest of the GLUTs. Several of the sequences critical for glucose transport are conserved in GLUT8. Specifically, these include two tryptophan residues corresponding to W388 and W412 of GLUT1, shown to confer cytochalasin B binding and conformation changes necessary for hexose binding and transport (14). Similarly, GLUT8 contains Q282, a glutamine residue required for binding of 2-N-4-1-(1-azi-2,2,2-triflu-oroethyl) benzoyl-1,3-bis(d-mannose-4-yloxy)-2-propylamine (ATB-BMP), a competitive glucose inhibitor (15). Finally, the repeat sequence motifs GRR/K are present between TM2 and TM3 and between TM8 and TM9 (16).
Figure 1.
GLUT8 sequence analysis. Protein alignment of mouse GLUT8 with murine GLUT1–4. The alignment was made with megalign in the dnastar program with the clustal method. Gray shading indicates positions that are identical in all transporters; open boxes identify residues shared by four of five transporters. The approximate positions of the transmembrane regions are denoted by a bar and the abbreviation TM.
Tissue Expression of GLUT8 mRNA and Protein.
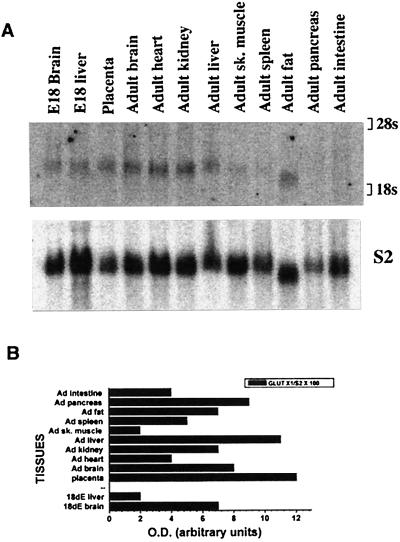
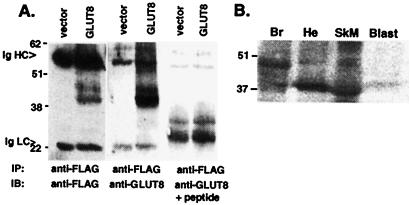
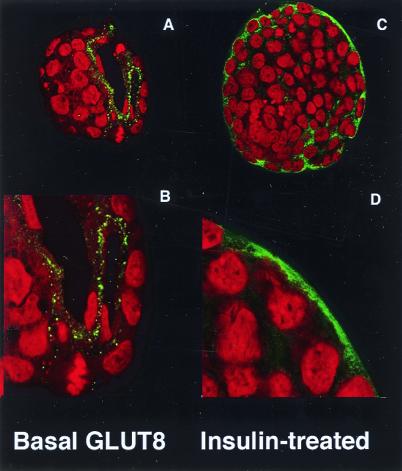
Northern blot analysis revealed a 2.1-kilobase band in most tissues at a very low level of expression with the highest expression in placenta (Fig. 2 A and B). GLUT8 protein was detected by overexpression of an N terminus FLAG-tagged GLUT8 cDNA in COS-7 cells (Fig. 3A). This protein runs as a diffuse band from 38 to 47 kDa and is blocked by addition of excess peptide to the antiserum solution. In endogenous mouse tissue, this transporter was expressed at a low level in heart, skeletal muscle, and brain as shown by immunoblotting (Fig. 3B). Again, this band can be blocked by addition of excess peptide (data not shown). In addition, this previously unidentified GLUT was detected in the mouse preimplantation blastocyst (Fig. 3B) but not detected before this stage (data not shown). By confocal immunofluorescence microscopy, this protein was detected in the blastocyst with the peptide-purified C terminus antibody (Fig. 4). In a basal, non-insulin-stimulated state, this protein seems to be located in intracellular compartments or vesicles, predominantly in the trophectoderm and primitive endoderm cells surrounding the blastocoel. On insulin exposure, however, the transporter distribution within the cell changes, and more protein appears at or near the plasma membrane of the trophectoderm cells encircling the entire embryo. This change in location with insulin is akin to that of GLUT4, which moves from sequestered intracellular vesicles to the plasma membrane.
Figure 2.
GLUT8 expression is detected in most tissue RNA. (A) Northern blot of total RNA from adult and fetal mouse tissue (15 μg) with a GLUT8 cDNA probe prepared as described in Methods. GLUT8 is present as a 2.1-kilobase band. E18, embryonic day 18. (B) Quantitation of RNA. The same blot was stripped and rehybridized to a mouse ribosomal protein S2 cDNA fragment that served as an internal control. The OD of each mRNA band was assessed with a Molecular Dynamics PhosphorImager and imagequant software (Molecular Dynamics) and was expressed as a percentage of the corresponding S2 message.
Figure 3.
GLUT8 detected in overexpression systems or endogenous mouse tissue. (A) Immunoprecipitation/immunoblot analysis of FLAG-GLUT8 overexpressed in COS-7 cells. Whole-cell lysates were made from COS-7 cells transfected either with vector only (Vector) or with a construct expressing GLUT8 tagged with the peptide tag FLAG (DYKDDDDK). All lysates were immunoprecipitated (IP) with anti-FLAGM2, and immunoblot (IB) analysis was performed with anti-FLAGM2, anti-GLUT8, and anti-GLUT8 + peptide. Immunoglobulin heavy chain (Ig HC) and immunoglobulin (Ig LC) are indicated by arrows. (B) GLUT8 protein is detected as an ≈37-kDa band in adult mouse brain (Br), heart (He), skeletal muscle (SkM), and blastocyst stage embryos (Blast). Each adult tissue lane contains 100 μg of protein. The blastocyst lane contain ≈279 blastocysts for a total of ≈7 μg of protein.
Figure 4.
Confocal immunofluorescent labeling to localize GLUT8 protein expression in the blastocyst under basal and insulin-stimulated conditions. (A) Blastocyst under basal conditions stained with peptide-purified polyclonal antibody to the C terminus of GLUT8 (green) and propidium iodide (red) as a nuclear stain. This technique localizes the protein to the trophectoderm and primitive endoderm lining the blastocoel. (B) Higher magnification of the trophectoderm revealing GLUT8 in vesicle-like intracellular compartment. (C) Blastocyst under insulin-stimulated conditions stained with the same GLUT8 antibody. This technique demonstrates a general cellular redistribution of the protein with increased plasma membrane staining. (D) Higher magnification of the blastocyst cells revealing cytoplasmic and plasma membrane staining and less staining of the vesicle-like compartments.
GLUT8 Functional Studies.
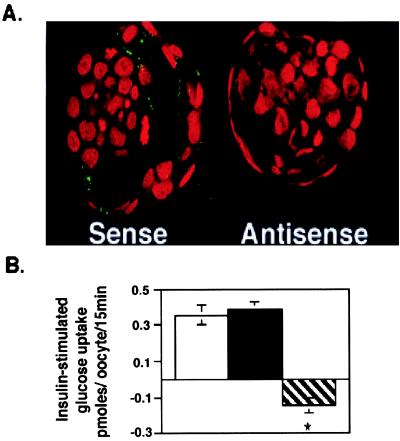
Functional studies confirm this movement of GLUT8 to the plasma membrane by demonstrating an increase in glucose uptake with insulin treatment in the mouse blastocyst. In addition, this insulin-stimulated uptake was inhibited by exposure to a GLUT8 antisense oligoprobe. The successful use of antisense oligoprobes in the mouse blastocyst has been reported (4). Embryos cultured in control medium or medium containing sense oligoprobe experienced a 5.6-fold increase in glucose uptake in response to insulin compared with those embryos cultured in antisense oligoprobe (Fig. 5B). Confocal immunofluorescent microscopy confirmed significant inhibition of GLUT8 protein expression in these blastocysts exposed to antisense as compared with those exposed to sense (Fig. 5A).
Figure 5.
GLUT8 is responsible for insulin-stimulated glucose uptake in the mouse blastocyst. (A) Confocal immunofluorescent labeling with GLUT8 antibody to determine the effect of treatment on GLUT8 expression. Embryos cultured in GLUT8 antisense demonstrate little or no GLUT protein expression compared with those cultured in sense. More than 15 blastocysts were evaluated for each group. (B) Insulin-stimulated glucose transport measured as pmol per embryo per 15 min or change in basal vs. insulin-stimulated 2-deoxyglucose taken up by individual blastocysts cultured in control medium (open bar), medium with 5 μM GLUT8 sense (black bar), or medium with 5 μM GLUT8 antisense (striped bar). Each bar represents three experiments totaling approximately 45 blastocysts. *, P < 0.001 by ANOVA with Fisher's test.
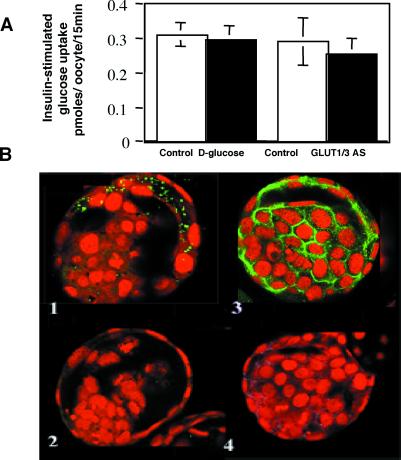
Although it has been suggested that this increase in glucose uptake on exposure to insulin is due to GLUT1 translocation (9), this suggestion does not seem to hold true. We have shown previously that exposure to high d-glucose concentrations (52 mM) during the preimplantation period leads to a down-regulation of GLUT1, GLUT2, and GLUT3 with a concomitant decrease in basal glucose transport (1). GLUT1 and GLUT3 are found on the apical and basolateral plasma membrane of the trophectoderm cells and are responsible for uptake of maternal glucose (1, 3, 4). GLUT2 is restricted to basal plasma membrane of trophectoderm and is not thought to contribute to uptake of glucose from the oviductal or uterine fluid (3). We now show that exposure in vitro to 52 mM d-glucose from the two-cell to the blastocyst stage has no effect on insulin-stimulated glucose uptake at a blastocyst stage, compared with embryos cultured in 52 mM l-glucose or control conditions (Fig. 6A). This result suggests that GLUT8 is responsible for the insulin-stimulated uptake, because GLUT1 and GLUT3 proteins are down-regulated under these conditions (Fig. 6B). To confirm that neither GLUT1 nor GLUT3 contributes to this insulin-regulated effect, antisense oligoprobes to both transporters were used. Under these conditions, there was likewise no significant difference in insulin-stimulated glucose transport (Fig. 6A). These findings suggest that some transporter other than GLUT1 or GLUT3 must be responsible for this effect.
Figure 6.
GLUT1 and GLUT3 are not responsible for the insulin-stimulated glucose uptake. (A) Insulin-stimulated glucose transport was not significantly different in embryos exposed to high glucose vs. control conditions despite the decrease in GLUT1 and GLUT3 protein. Similarly, decreasing GLUT1 and GLUT3 expression with antisense had no effect on insulin-stimulated glucose uptake as compared with controls. (B) Confocal immunofluorescent labeling with GLUT8 (B1) revealed no decrease in GLUT8 protein expression in embryos cultured under high glucose conditions (52 mM d-glucose); this effect is in contrast to labeling with GLUT1 (B2), which showed a significant decrease in expression on exposure to high glucose. GLUT3 demonstrated the same decrease in protein expression in response to high glucose (data not shown). Exposure to GLUT1 sense (B3) had no effect on GLUT1 protein expression, whereas exposure to GLUT1 antisense (B4) markedly decreased GLUT1 protein expression at the blastocyst stage. GLUT3 sense and antisense produced the same results.
The controls also demonstrate that the subcellular distribution of GLUT1 in the mouse blastocyst is different from that of GLUT8 (Fig. 6 B1 vs. B3). GLUT1 appears to outline cells, consistent with plasma membrane staining with very little intracellular staining. For this reason, GLUT1 would not be expected to contribute significantly to insulin-stimulated transport. GLUT8, in contrast to GLUT1, appears to reside in distinct intracellular vesicles or compartments, similar to GLUT4. GLUT8, by its change in cellular location with insulin exposure and by the ability of antisense oligoprobes to block insulin-stimulated glucose uptake, may represent the embryonic counterpart of the insulin-regulated GLUT, GLUT4.
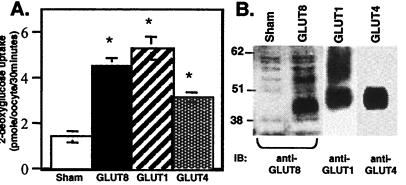
To confirm that GLUT8 functions as a GLUT, we used a Xenopus oocyte expression system as described (17). Uptake of 2-deoxy-d-[3H]glucose was greater than 3-fold higher in oocytes injected with GLUT8 compared with sham-injected oocytes, comparable to the increase seen in oocytes injected with GLUT1 or GLUT4 (Fig. 7A). Immunoblotting of total membranes from the injected oocytes demonstrated expression of GLUT8, GLUT1, and GLUT4 (Fig. 7B). The GLUT8 protein appears as a diffuse band between 37 and 45 kDa, indicative of the high degree of glycosylation characteristic of the other GLUTs (17).
Figure 7.
GLUT8 transports 2-deoxyglucose in a Xenopus expression system. (A) Uptake of 2-deoxy-d-[3H]glucose (50 μM, 30 min at 22°C) was measured 3 days after injection of water (Sham) or 50 ng of GLUT8, GLUT1, or GLUT4 mRNA into stage V Xenopus oocytes. Each bar represents two experiments totaling at least 35 oocytes. *, P < 0.001 by ANOVA with Fisher's test as compared with sham. (B) Immunoblot (IB) analysis of total membranes from oocytes injected with sham, GLUT8 mRNA, GLUT1 mRNA, or GLUT4 mRNA.
Discussion
Teleologically, GLUT8 may have evolved as an additional mechanism for glucose transport into the mammalian blastocyst. This transporter would maximize glucose use at a critical turning point in development. During the early blastocyst stage, the embryo switches abruptly from using pyruvate as its main energy substrate to glucose (18). Before the blastocyst stage, pyruvate is oxidized via the Krebs cycle and oxidative phosphorylation and also provides ATP to the preimplantation embryo. The blastocyst stage, however, marks a new peak in cellular proliferation and growth, and the first epithelial layer, the trophectoderm, is formed. These changes create new biosynthetic demands on the embryo. Maintenance of a high rate of glycolysis is thought to be important for providing metabolic intermediates for biosynthetic pathways. For example, glucose-6-phosphate is used in the formation of ribose-5-phosphate required for DNA and RNA synthesis. It has been hypothesized that high rates of flux via glycolysis are necessary at this time in development to act as a “dynamic buffer … to allow intermediates to be tapped off at the precise rate required whenever they are required for biosynthesis” (19).
An alternative explanation for the increased glucose demand and thus the evolution of an alternative GLUT at this stage has been proposed by Leese (20). Increasing amounts of glucose are converted to lactate at the blastocyst stage in species such as humans and rodents in which the embryo resides in the uterus for a relatively short time before implantation. The reason for this anaerobic type of metabolism is the lack of adequate vascularization and oxygenation at the implantation sites or decidual zones. The only source of ATP for the embryo at this point would be conversion of glucose to lactate via glycolysis. Thus, the embryo, in preparation for the lack of oxygen, may be maximizing glucose uptake at this stage by expressing GLUT8 along with the other facilitative transporters to convert glucose to lactic acid by glycolysis.
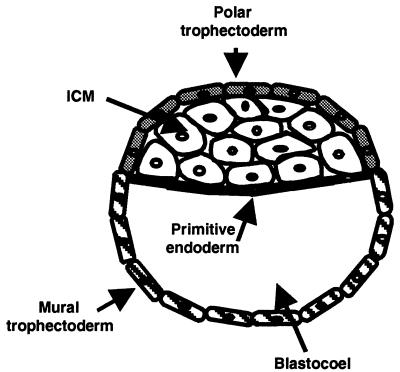
Expression of this previously unidentified GLUT appears concurrently with expression of the IGF-1 receptor in the mammalian blastocyst and coincides with movement of the embryo from the oviduct to the uterus, which contains higher concentrations of IGF-1 and insulin (21). By electron microscopy, it has also been shown that the IGF-1 receptor is present on both the basolateral and apical surfaces of all trophectoderm epithelial cells (22). The trophectoderm epithelium encircles the entire blastocyst and consists of two regions (Fig. 8). The polar trophectoderm separates oviductal and uterine fluids from the ICM. The mural trophectoderm surrounds the blastocoel cavity and is not in contact with the ICM. Another epithelial layer forms at the blastocyst stage. This layer, the primitive endoderm, forms on the free surface of the nonpolarized ICM and is derived from the ICM but acts as a polarized epithelium, more like the trophectoderm lineage. Herein, we show that GLUT8 is seen predominantly within vesicles in the cells lining the blastocoel in a basal state, presumably the trophectoderm and primitive endoderm cells. On insulin stimulation, however, both mural and polar trophectoderm cells and possibly primitive endoderm cells show cell surface or plasma membrane GLUT8 protein staining, suggesting intracellular translocation and possibly unmasking of GLUT8. In glucose uptake studies with mouse blastocysts, it has been shown that insulin and IGF-1 stimulate glucose uptake via binding to the IGF-1 receptor, not the insulin receptor (9). We postulate that signaling via the IGF-1 receptor pathway within the trophectoderm cells may trigger translocation of GLUT8 to the apical plasma membranes and facilitate glucose transport, possibly by the same signaling pathways as GLUT4 translocation. IGF-1/insulin-stimulated uptake similarly may occur via GLUT8 trafficking within the primitive endodermal epithelium. This uptake would facilitate vectorial transport of glucose from the blastocoel to the ICM. It has also been noted recently that expression of insulin receptor substrate-1 at both the mRNA and protein levels increases significantly at the blastocyst stage of mouse development (23). Although this expression has not been localized to a particular cell type, this finding suggests that activity of this IGF-1/insulin–IGF-1 receptor–insulin receptor substrate-1–GLUT8 pathway may be functional within the trophectoderm and endoderm. Further investigations are necessary to support these conclusions.
Figure 8.
The preimplantation mouse blastocyst. A schematic drawing of the differentiated mouse blastocyst. The inner cell mass (ICM) and trophectoderm are the two cell lineages formed at this stage. The trophectoderm epithelium serves as the interface between the blastocyst and the oviduct/uterine environment. The polar and mural trophectoderm are in direct contact with the ICM and blastocoel, respectively. The primitive endoderm, a polarized epithelial layer derived from the ICM, separates the ICM from the blastocoel.
During the preparation of this manuscript, another group identified a previously unidentified GLUT, GLUTX1, which is identical to the isoform reported herein (24). Their RNA and protein expression data are similar to ours, with the exception of testis, which we did not examine. Unlike these investigators, we were able to detect a low level of protein expression in adult tissue (i.e., brain, skeletal muscle, and fat) and higher expression in mouse blastocysts, suggesting that this protein may be an embryonic transporter. Ibberson et al. (24) show transport activity in Xenopus oocytes only after suppression of a dileucine motif present in the N-terminal region. Such activity is in contrast to our data, which indicate that transport activity in oocytes injected with GLUT1, GLUT4, or GLUT8 is similar. We demonstrate high expression of each transporter in total oocyte membranes and suggest the discrepancy between the glucose uptake data may be due to inadequate transporter expression in the oocyte.
Physiologic levels of insulin and IGF-1 promote blastocyst development and blastocoel formation, consistent with our proposal that IGF-1/insulin-stimulated glucose uptake fuels biosynthetic activities at this critical point in development (25, 26). In contrast, lack of a threshold level of glucose transport may trigger apoptosis in the blastocyst. We have shown previously that down-regulation of GLUT1 and GLUT3 at the blastocyst stage in response to hyperglycemia (1) occurs concurrently with the onset of increased apoptotic nuclei (5). Similarly, in other cell systems, decreased basal glucose uptake has been shown to initiate the programmed cell death cascade (27–29). Blockade of the IGF-1 receptor by antisense expression plasmids, blocking antibodies, or dominant negative mutants of the IGF-1 receptor all result in an increase in apoptosis (30–32). Thus, the evolution of this previously unidentified embryonic GLUT may be to assure adequate substrate delivery to the blastocyst, thus preventing embryonic apoptosis and possible embryo demise.
The physiological role of GLUT8 in adult tissues is not clear from tissue distribution. Very low levels of expression are seen in adult tissue. Increased expression of this embryonic transporter, however, may be induced under abnormal conditions when known GLUTs are not functional. For example, in the GLUT4 null mouse, some muscle types experience increased glucose uptake in response to insulin, and this increase is not due to compensation from the other known GLUT isoforms (33). Similarly, GLUT2 null mice still experience second-phase insulin secretion in response to glucose, suggesting that glucose uptake and metabolism must be occurring via some other GLUT isoform (34). Finally, some thyroid tumors are known to take up large amounts of fluorodeoxyglucose as detected by positron emission tomography scan; however, these tumors do not express any known GLUTs (35). In such pathologic and nonphysiologic situations, an embryonic transporter, such as GLUT8, may be turned on and expressed at higher levels. Although our present studies demonstrate the presence of GLUT8 in day-18 fetal brain and liver, whether this embryonic GLUT isoform persists as the fetal form of the insulin-responsive GLUT remains to be investigated.
Acknowledgments
The authors thank B. Mercer for his critical reading of the manuscript and discussions in the course of the work, C. Makepeace and P. Hruz for their assistance with the Xenopus oocyte injections, and B. Knowles and S.-Y. Hwang for the mouse blastocyst cDNA library. This work was supported in part by National Institutes of Health Grants R03 HD34693 (to K.H.M.), P60 DK30579 (to K.H.M.), HD-25024 (to S.U.D.), and RO1 DK38495 (to M.M.) as well as Postdoctoral Fellowship Grant T32-DK07296-20 (to M.O.C.); by the Burroughs–Wellcome Fund through a Career Award in the Biomedical Sciences (to K.H.M.); by the Diabetes Research and Training Center at Washington University (to K.H.M. and M.M.); and by the Juvenile Diabetes Fund through a Research Award (to K.H.M.).
Abbreviations
- GLUT
glucose transporter
- IGF
insulin-like growth factor
- TM
transmembrane region
- ICM
inner cell mass
Footnotes
Data deposition: The sequence reported in this paper has been deposited in the GenBank database (accession no. AF232061).
References
- 1.Moley K H, Chi M M-Y, Mueckler M M. Am J Physiol. 1998;275:E38–E47. doi: 10.1152/ajpendo.1998.275.1.E38. [DOI] [PubMed] [Google Scholar]
- 2.Hogan A, Heyner S, Charron M J, Copeland N G, Gilbert D J, Jenkins M A, Thorens B, Schultz G A. Development (Cambridge, UK) 1991;113:363–372. doi: 10.1242/dev.113.1.363. [DOI] [PubMed] [Google Scholar]
- 3.Aghayan M, Rao L V, Smith R M, Jarett L, Charron M J, Thorens B, Heyner S. Development (Cambridge, UK) 1992;115:305–312. doi: 10.1242/dev.115.1.305. [DOI] [PubMed] [Google Scholar]
- 4.Pantaleon M, Harvey M B, Pascoe W S, James D E, Kaye P L. Proc Natl Acad Sci USA. 1997;94:3795–3800. doi: 10.1073/pnas.94.8.3795. [DOI] [PMC free article] [PubMed] [Google Scholar]
- 5.Moley K H, Chi M M-Y, Knudson C M, Korsmeyer S J, Mueckler M M. Nat Med. 1998;12:1421–1424. doi: 10.1038/4013. [DOI] [PubMed] [Google Scholar]
- 6.Heyner S, Smith R M, Schultz G A. BioEssays. 1989;11:171–176. doi: 10.1002/bies.950110604. [DOI] [PubMed] [Google Scholar]
- 7.Rappolee D A, Sturm K S, Behrendtsen O, Peterson R A, Werb Z. Genes Dev. 1992;6:939–952. doi: 10.1101/gad.6.6.939. [DOI] [PubMed] [Google Scholar]
- 8.Doherty A S, Temeles G L, Schultz R M. Mol Reprod Dev. 1994;37:21–26. doi: 10.1002/mrd.1080370104. [DOI] [PubMed] [Google Scholar]
- 9.Pantaleon M, Kaye P L. Mol Reprod Dev. 1996;44:71–76. doi: 10.1002/(SICI)1098-2795(199605)44:1<71::AID-MRD8>3.0.CO;2-Q. [DOI] [PubMed] [Google Scholar]
- 10.Rothstein J L, Johnson D, DeLoia J A, Skowronski J, Solter D, Knowles B. Genes Dev. 1992;6:1190–1201. doi: 10.1101/gad.6.7.1190. [DOI] [PubMed] [Google Scholar]
- 11.Chomczynski P, Sacchi N. Anal Biochem. 1987;162:156–159. doi: 10.1006/abio.1987.9999. [DOI] [PubMed] [Google Scholar]
- 12.Smith J B, Herschman H R. J Biol Chem. 1995;270:16756–16765. doi: 10.1074/jbc.270.28.16756. [DOI] [PubMed] [Google Scholar]
- 13.Garcia J C, Strube M, Leingang K, Keller K, Mueckler M M. J Biol Chem. 1992;267:7770–7776. [PubMed] [Google Scholar]
- 14.Keller K, Strube M, Mueckler M M. J Biol Chem. 1989;264:18884–18889. [PubMed] [Google Scholar]
- 15.Hashiramoto M, Kadowaki T, Clark A E, Muraoka A, Momomura K, Sakura H, Tobe K, Akanuma Y, Yazaki Y, Holman G D, et al. J Biol Chem. 1992;267:17502–17507. [PubMed] [Google Scholar]
- 16.Maiden M C, Davis E O, Baldwin S A, Moore D C, Henderson P J. Nature (London) 1987;325:641–643. doi: 10.1038/325641a0. [DOI] [PubMed] [Google Scholar]
- 17.Marshall B A, Murata H, Hresko R C, Mueckler M M. J Biol Chem. 1993;35:26193–26199. [PubMed] [Google Scholar]
- 18.Wales R G. J Reprod Fertil. 1986;76:717–725. doi: 10.1530/jrf.0.0760717. [DOI] [PubMed] [Google Scholar]
- 19.Newsholme P, Newsholme E A. Biochem J. 1989;261:211–218. doi: 10.1042/bj2610211. [DOI] [PMC free article] [PubMed] [Google Scholar]
- 20.Leese H J. In: Early Embryo Development and Paracrine Relationships, UCLA Symposia on Molecular and Cellular Biology. Wiley L M, Heyner S, editors. Vol. 117. New York: Wiley–Liss; 1991. pp. 67–78. [Google Scholar]
- 21.Lighten A D, Moore G E, Winston R M, Hardy K. Hum Reprod. 1998;13:3144–3150. doi: 10.1093/humrep/13.11.3144. [DOI] [PubMed] [Google Scholar]
- 22.Smith R M, Garside W T, Aghayan M, Shi C-Z, Shah N, Jarett L, Heyner S. Biol Reprod. 1993;49:1–12. doi: 10.1095/biolreprod49.1.1. [DOI] [PubMed] [Google Scholar]
- 23.Puscheck E E, Pergament E, Patel Y, Dreschler J, Rappolee D A. Mol Reprod Dev. 1998;49:386–393. doi: 10.1002/(SICI)1098-2795(199804)49:4<386::AID-MRD5>3.0.CO;2-J. [DOI] [PubMed] [Google Scholar]
- 24.Ibberson M, Uldry M, Thorens B. J Biol Chem. 2000;275:4607–4612. doi: 10.1074/jbc.275.7.4607. [DOI] [PubMed] [Google Scholar]
- 25.De Hertogh R, Vanderheyden I, Pampfer S, Robin D, Dufrasnes E, Delcourt J. Diabetes. 1991;40:641–647. doi: 10.2337/diab.40.5.641. [DOI] [PubMed] [Google Scholar]
- 26.Heyner S, Rao V, Jarett L, Smith R M. Dev Biol. 1989;134:48–58. doi: 10.1016/0012-1606(89)90077-8. [DOI] [PubMed] [Google Scholar]
- 27.Liu X, He Z, Yanoff M, Jian B, Ye X. Invest Ophthalmol Visual Sci. 1998;39:1535–1545. [PubMed] [Google Scholar]
- 28.Miller T M, Johnson E M. J Neurosci. 1996;16:7484–7510. doi: 10.1523/JNEUROSCI.16-23-07487.1996. [DOI] [PMC free article] [PubMed] [Google Scholar]
- 29.Kan O, Baldwin S A, Whetton A D. J Exp Med. 1994;180:917–921. doi: 10.1084/jem.180.3.917. [DOI] [PMC free article] [PubMed] [Google Scholar]
- 30.Resnicoff M, Abraham D, Yutanawiboonchai W, Rotman H L, Kajstura J, Rubin R, Zoltick P, Baserga R. Cancer Res. 1995;55:2463–2469. [PubMed] [Google Scholar]
- 31.Sell C, Dumenil G, Deveaud C, Miura M, Coppola D, DeAngelis T, Rubin R, Efstratiadis A, Baserga R. Mol Cell Biol. 1994;14:3604–3612. doi: 10.1128/mcb.14.6.3604. [DOI] [PMC free article] [PubMed] [Google Scholar]
- 32.Morales A V, Serna J, Alarcon C, DeLaRosa E J, DePablo F. Endocrinology. 1997;138:3967–3975. doi: 10.1210/endo.138.9.5396. [DOI] [PubMed] [Google Scholar]
- 33.Stenbit A E, Burcelin R, Katz E B, Tsao T S, Gautier N, Charron M J, Le Marchand-Brustel Y. J Clin Invest. 1996;98:629–634. doi: 10.1172/JCI118833. [DOI] [PMC free article] [PubMed] [Google Scholar]
- 34.Guillam M T, Hummler E, Schaerer E, Yeh J I, Birnbaum M J, Beermann F, Schmidt A, Deriaz N, Thorens B, Yeh J I. Nat Genet. 1997;17:327–330. doi: 10.1038/ng1197-327. [DOI] [PubMed] [Google Scholar]
- 35.Musholt T J, Musholt P B, Dehdashti F, Moley J F. Surgery. 1997;122:1049–1060. doi: 10.1016/s0039-6060(97)90208-7. [DOI] [PubMed] [Google Scholar]


