Abstract
Functional links between proteins can often be inferred from genomic associations between the genes that encode them: groups of genes that are required for the same function tend to show similar species coverage, are often located in close proximity on the genome (in prokaryotes), and tend to be involved in gene-fusion events. The database STRING is a precomputed global resource for the exploration and analysis of these associations. Since the three types of evidence differ conceptually, and the number of predicted interactions is very large, it is essential to be able to assess and compare the significance of individual predictions. Thus, STRING contains a unique scoring-framework based on benchmarks of the different types of associations against a common reference set, integrated in a single confidence score per prediction. The graphical representation of the network of inferred, weighted protein interactions provides a high-level view of functional linkage, facilitating the analysis of modularity in biological processes. STRING is updated continuously, and currently contains 261 033 orthologs in 89 fully sequenced genomes. The database predicts functional interactions at an expected level of accuracy of at least 80% for more than half of the genes; it is online at http://www.bork.embl-heidelberg.de/STRING/.
INTRODUCTION
Protein–protein interactions are not limited to direct physical binding. Proteins may also interact indirectly—by sharing a substrate in a metabolic pathway, by regulating each other transcriptionally, or by participating in larger multi-protein assemblies. For predicting such functional associations (including direct binding), the current growth in completed genomes offers unique opportunities through so-called ‘genomic context’ or ‘nonhomology-based’ inference methods (1–3).
These methods are based on the fact that functionally associated proteins are encoded by genes that share similar selection pressures—the genes need to be maintained together, and regulated together, such that the encoded proteins can interact at the same time and place in the cell. This leaves signals in the genome, which become detectable above the noise of random genomic events when analyzing multiple species. For example, the need for maintaining functionally associated genes together can become visible as an agreement in occurrence-patterns across several genomes (4,5): the genes tend to be either present together, or absent together—they have the same ‘phylogenetic profile’. This is particularly informative when the profile is not in agreement with organismal phylogeny, as is the case when horizontal transfers or gene losses are involved (6,7). Likewise, the need for similar regulation is often reflected in a tendency of functionally associated genes to be close neighbors in prokaryotic genomes (8,9), where they generally have the same transcriptional orientation and little or no sequence between them. This suggests that they are single transcription units (operons), recurring in similar but not identical composition across several genomes (10). Finally, genes whose protein products need to interact closely in the cell have a noticeable tendency to be fused into a single gene, encoding a combined polypeptide (11,12) in which the proteins have a higher chance of interacting productively.
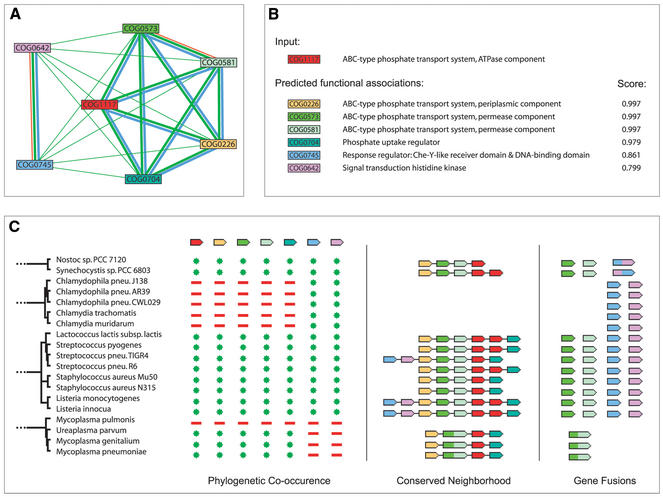
Optimal, user-friendly exploitation of genomic context for the prediction of functional interactions requires: (i) a benchmarked scoring scheme that integrates the three types of context and gives a confidence value for each prediction, (ii) automatic implementation and orthology assignment of the genes in newly published genomes, and (iii) easy navigation between various displays so that not only the pairwise interactions, but also the network of interactions and the presence of potential (sub)modules in the network become visible. Previous genomic context databases such as Indigo (13), the first version of STRING (14), the Clusters of Orthologous Group (COG) database (15), Predictome (16), and SNAPper (17) only rely on a single form of genomic context. Where they do include multiple forms (Predictome and COG) these are not integrated; nor do any of the databases indicate the reliability of the predictions. This indication of reliability is necessary: with the ever-increasing number of genomes, the amount of predictions can become quite large and, depending on the parameters, may include many false positives. We took the opportunity of a complete redesign of STRING to introduce such a scoring scheme, derived by integrating all three types of genomic context. Additionally, STRING is now continuously updated and the predictions are fully precomputed. Particular emphasis has been placed on fast and easy navigation, coupled to integrated visual outputs (see Fig. 1 for an example output of STRING).
Figure 1.
An example of a functional module detected by STRING. The module encompasses the prototypic phosphate-regulon, an active uptake-system for inorganic phosphate found in most, but not all, prokaryotes (24). (A) Network view. Green lines connect proteins which are associated by recurring neighborhood, blue connections are inferred by phylogenetic co-occurence, and red lines indicate gene-fusion events; line thickness is a rough indicator for the strength of the association. The visualization shows that the module is composed of two sub-modules: The larger module to the right contains the structural and immediate regulatory molecules of the transporter; the two proteins to the left form a two-component regulator system controlling the transcription of the other components in response to phosphate starvation. (B) Score summary view. Association scores are highest among structural components. (C) Evidence view. A subset of the full evidence is shown, visualizing the three types of genomic context links.
USAGE
Users enter the database via a protein of interest, for which functional associations are to be predicted. This protein can be identified by its accession number or identifier. Alternatively, the raw amino acid sequence of the protein can be supplied (in this case, checksum lookups and similarity searches are done to identify the corresponding entry in the database). The user is then presented with a summary of the predicted functional links for the protein, ranked by estimated confidence. Further pages are accessible which summarize and explain the evidence that leads to the predictions. Additionally, a fully interactive network display is available—allowing navigation through the combined functional associations. The network display also allows iteration—zooming out of a particular module and visualizing its connections to other modules. For independent computational analysis, the entire set of predictions contained in STRING is available as computer-readable flat-files through the website.
PREDICTION ALGORITHMS
The concepts behind the individual algorithms for the prediction of functional associations have all been published and validated previously; for STRING, only minor modifications were made. The requirements for the detection of gene fusions are more strict than those published previously (11,12); fused proteins are not recognized by homology, but rather by orthology of the fused parts to other, non-fused proteins (18,19).
For neighborhood evidence, a repeatedly occurring neighborhood is required, in species that are sufficiently remote to uncover functional constraints on gene order.
For the analysis of gene co-occurrence, STRING does not require perfect agreement between the occurrence of two genes, but uses a measure from information theory, mutual information (20,21), which quantifies the information gained—from the knowledge that one gene is present—about the presence of another gene in the same genome. The specific algorithm used here corrects for biases in the number of genomes sequenced for a particular branch of phylogeny, by collapsing into a single node those taxa in which the presence or absence of a specific gene pair is in agreement in all the species.
SCORING-FRAMEWORK AND BENCHMARKING
The three types of genomic association each contain quantitative information (e.g. the number of times two genes occur together in an operon). Additionally, there is a positive correlation between the genomic associations and the likelihood and strength of interactions (9,21); this allows the derivation of a scoring system.
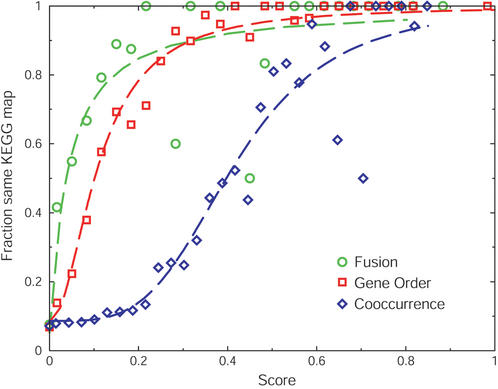
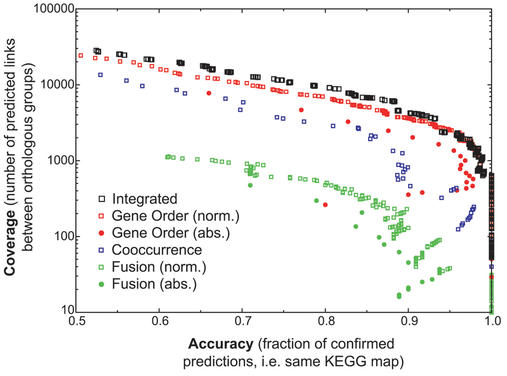
We benchmarked the various genomic associations separately (Fig. 2), based on the co-occurrence of proteins on metabolic maps in the KEGG database (22); proteins that occur on the same metabolic KEGG map are presumed to be functionally interacting, those that occur on different maps are not. For both fusion and conserved gene order, we find that the simple counting of events is insufficient; it is outperformed by a score that includes normalization by the number of species covered by the genes involved (Fig. 3).
Figure 2.
Comparing different types of genomic associations to obtain equivalency. Scores are plotted versus the observed accuracy for each genomic association method. Data points indicate the fraction of predicted pairs of orthologous groups that are on the same KEGG map for each type of genomic association. For fusion and gene order, scores indicate the number of non-redundant observations divided by the number of species that contain at least one of the orthologous groups. The dashed lines in the respective colors represent fits of these data to standard saturating hill equations: f(x)=a+[(1−a)xb/(cb+xb)], where x represents the score, a the intercept, b the cooperativity, and c the value of x where half of the maximum is reached.
Figure 3.
Increased performance of an integrated score relative to the different types of genomic association scores. Coverage and accuracy are plotted using a sliding scale of score thresholds for each genomic association method. Shown are the three individual methods, as well as the integrated score (for fusion and gene order, the absolute count versus the normalized count are shown separately). Methods in general can be said to perform better when their data points are higher and further to the right.
The comparison of the different types of genomic association to the same benchmark helps to establish which scores in each method are equivalent. For example, at a fusion frequency of 0.04, 50% of the predicted pairs are on the same KEGG map, while this is only reached at a conserved gene order frequency of 0.10 (Fig. 2). This equivalency can be formalized by finding a function that describes the relation between the score and the observed accuracy. The correlations of the genomic association counts with the fraction of proteins on the same KEGG map are sigmoidal, and we, therefore, fitted them to hill-equations (Fig. 2).
The equivalency mapping makes it possible to combine the three hill-equations into a single score. We integrate the scores by multiplying the probabilities of associations not predicting a functional interaction. In this way, multiple scores can be combined to form a single score that expresses a higher confidence (Fig. 3). Combining the separate scores leads to a higher coverage at a given accuracy, specifically for the genes that score sub-optimally for all the individual genomic associations (Fig. 3). Remarkably, gene-order conservation remains clearly the most power-full method of the three (21).
DATA SOURCES, ORTHOLOGY
For information on genomes, genes, and encoded proteins, STRING relies on the annotated proteomes maintained by SWISS-PROT (23). Assignment of functional equivalence of genes across these genomes is essential for the predictions, and this information is derived from the manually curated orthology database, COGs (15). For any genomes not yet present in the COG database, orthology assignments are made by an automatic method resembling the COG procedure. This results not only in the addition of new genes to COGs, which are presently based on 43 genomes, but also in the creation of a number of additional orthologous groups (NOGs, non-supervised orthologous groups) (see http://www.bork.embl-heidelberg.de/STRING/ for details on the orthology assignment procedure. Essentially, assignments are based on triangles of reciprocal best matches between species in all-against-all Smith–Waterman searches, allowing for recent duplications within the genome, and including a clean-up step to join remaining genes by simple bidirectional hits).
STRING uses a relational database system (PostgreSQL, http://www.postgresql.org) to store primary data, such as genes and genomic locations. Periodically, complete all-against-all runs of the prediction algorithms are performed, and the resulting functional associations are stored in the database system as well. Precomputed results are stored at several levels of detail, allowing for very fast navigation through the predictions.
Acknowledgments
ACKNOWLEDGEMENTS
This work was supported in part by grants from the Netherlands Organization for Scientific Research (NWO), from the Deutsche Forschungsgemeinschaft, and from the Bundesministerium für Forschung und Bildung, Germany, through its contribution to the Helmholtz Network for Bioinformatics.
REFERENCES
- 1.Galperin M.Y. and Koonin,E.V. (2000) Who's your neighbor? New computational approaches for functional genomics. Nat. Biotechnol., 18, 609–613. [DOI] [PubMed] [Google Scholar]
- 2.Marcotte E.M. (2000) Computational genetics: finding protein function by nonhomology methods. Curr. Opin. Struct. Biol., 10, 359–365. [DOI] [PubMed] [Google Scholar]
- 3.Huynen M., Snel,B., Lathe,W. and Bork,P. (2000) Exploitation of gene context. Curr. Opin. Struct. Biol., 10, 366–370. [DOI] [PubMed] [Google Scholar]
- 4.Pellegrini M., Marcotte,E.M., Thompson,M.J., Eisenberg,D. and Yeates,T.O. (1999) Assigning protein functions by comparative genome analysis: protein phylogenetic profiles. Proc. Natl Acad. Sci. USA, 96, 4285–4288. [DOI] [PMC free article] [PubMed] [Google Scholar]
- 5.Huynen M.A. and Bork,P. (1998) Measuring genome evolution. Proc. Natl Acad. Sci. USA, 95, 5849–5856. [DOI] [PMC free article] [PubMed] [Google Scholar]
- 6.Ettema T., van der Oost,J. and Huynen,M. (2001) Modularity in the gain and loss of genes: applications for function prediction. Trends Genet., 17, 485–487. [DOI] [PubMed] [Google Scholar]
- 7.Aravind L., Watanabe,H., Lipman,D.J. and Koonin,E.V. (2000) Lineage-specific loss and divergence of functionally linked genes in eukaryotes. Proc. Natl Acad. Sci. USA, 97, 11319–11324. [DOI] [PMC free article] [PubMed] [Google Scholar]
- 8.Overbeek R., Fonstein,M., D'Souza,M., Pusch,G.D. and Maltsev,N. (1999) The use of gene clusters to infer functional coupling. Proc. Natl Acad. Sci. USA, 96, 2896–2901. [DOI] [PMC free article] [PubMed] [Google Scholar]
- 9.Dandekar T., Snel,B., Huynen,M. and Bork,P. (1998) Conservation of gene order: a fingerprint of proteins that physically interact. Trends Biochem. Sci., 23, 324–328. [DOI] [PubMed] [Google Scholar]
- 10.Lathe W.C. III, Snel,B. and Bork,P. (2000) Gene context conservation of a higher order than operons. Trends Biochem. Sci., 25, 474–479. [DOI] [PubMed] [Google Scholar]
- 11.Enright A.J., Iliopoulos,I., Kyrpides,N.C. and Ouzounis,C.A. (1999) Protein interaction maps for complete genomes based on gene fusion events. Nature, 402, 86–90. [DOI] [PubMed] [Google Scholar]
- 12.Marcotte E.M., Pellegrini,M., Ng,H.L., Rice,D.W., Yeates,T.O. and Eisenberg,D. (1999) Detecting protein function and protein-protein interactions from genome sequences. Science, 285, 751–753. [DOI] [PubMed] [Google Scholar]
- 13.Nitschke P., Guerdoux-Jamet,P., Chiapello,H., Faroux,G., Henaut,C., Henaut,A. and Danchin,A. (1998) Indigo: a World-Wide-Web review of genomes and gene functions. FEMS Microbiol. Rev., 22, 207–227. [DOI] [PubMed] [Google Scholar]
- 14.Snel B., Lehmann,G., Bork,P. and Huynen,M.A. (2000) STRING: a web-server to retrieve and display the repeatedly occurring neighbourhood of a gene. Nucleic Acids Res., 28, 3442–3444. [DOI] [PMC free article] [PubMed] [Google Scholar]
- 15.Tatusov R.L., Natale,D.A., Garkavtsev,I.V., Tatusova,T.A., Shankavaram,U.T., Rao,B.S., Kiryutin,B., Galperin,M.Y., Fedorova,N.D. and Koonin,E.V. (2001) The COG database: new developments in phylogenetic classification of proteins from complete genomes. Nucleic Acids Res., 29, 22–28. [DOI] [PMC free article] [PubMed] [Google Scholar]
- 16.Mellor J.C., Yanai,I., Clodfelter,K.H., Mintseris,J. and DeLisi,C. (2002) Predictome: a database of putative functional links between proteins. Nucleic Acids Res., 30, 306–309. [DOI] [PMC free article] [PubMed] [Google Scholar]
- 17.Kolesov G., Mewes,H.W. and Frishman,D. (2002) SNAPper: gene order predicts gene function. Bioinformatics, 18, 1017–1019. [DOI] [PubMed] [Google Scholar]
- 18.Yanai I., Derti,A. and DeLisi,C. (2001) Genes linked by fusion events are generally of the same functional category: a systematic analysis of 30 microbial genomes. Proc. Natl Acad. Sci. USA, 98, 7940–7945. [DOI] [PMC free article] [PubMed] [Google Scholar]
- 19.Snel B., Bork,P. and Huynen,M. (2000) Genome evolution. Gene fusion versus gene fission. Trends Genet., 16, 9–11. [DOI] [PubMed] [Google Scholar]
- 20.Kullback S. (1959) Information Theory and Statistics. John Wiley & Sons Inc., New York, NY, pp. 1–11.
- 21.Huynen M., Snel,B., Lathe,W.,III and Bork,P. (2000) Predicting protein function by genomic context: quantitative evaluation and qualitative inferences. Genome Res., 10, 1204–1210. [DOI] [PMC free article] [PubMed] [Google Scholar]
- 22.Kanehisa M. and Goto,S. (2000) KEGG: Kyoto encyclopedia of genes and genomes. Nucleic Acids Res., 28, 27–30. [DOI] [PMC free article] [PubMed] [Google Scholar]
- 23.Bairoch A. and Apweiler,R. (2000) The SWISS-PROT protein sequence database and its supplement TrEMBL in 2000. Nucleic Acids Res., 28, 45–48. [DOI] [PMC free article] [PubMed] [Google Scholar]
- 24.Torriani A. (1990) From cell membrane to nucleotides: the phosphate regulon in Escherichia coli. Bioessays, 12, 371–376. [DOI] [PubMed] [Google Scholar]


