Abstract
The Database of Macromolecular Movements (http://MolMovDB.org) is a collection of data and software pertaining to flexibility in protein and RNA structures. The database is organized into two parts. Firstly, a collection of ‘morphs’ of solved structures representing different states of a molecule provides quantitative data for flexibility and a number of graphical representations. Secondly, a classification of known motions according to type of conformational change (e.g. ‘hinged domain’ or ‘allosteric’) incorporates textual annotation and information from the literature relating to the motion, linking together many of the morphs. A variety of subsets of the morphs are being developed for use in statistical analyses. In particular, for each subset it is possible to derive distributions of various motional quantities (e.g. maximum rotation) that can be used to place a specific motion in context as being typical or atypical for a given population. Over the past year, the database has been greatly expanded and enhanced to incorporate new structures and to improve the quality of data. The ‘morph server’, which enables users of the database to add new morphs either from their own research or the PDB, has also been enhanced to handle nucleic acid structures and multi-chain complexes.
INTRODUCTION
The Database of Macromolecular Movements (http://molmovdb.org) started as a survey of protein motions collected from extensive study of the structure databases and journal literature (1,2). The initial title of ‘Protein Motions Database’ was changed to reflect the inclusion of several RNA structures; however, the focus of the database continues to be biased towards proteins. Originally a collection of static web pages with several custom animations and images, the database has grown to encompass a large body of quantitative information and server-generated movies, and is now more broadly applied to structural flexibility. The database has proven useful as a reference tool, but is also intended as a platform for data mining and efforts are underway to correlate entries with other structural databases such as SCOP (3), CATH (4) and PartsList (5).
The content of the database falls into two sections, titled ‘motions’ and ‘morphs’, though they are interconnected as much as possible. The morphs became an integral part of the database with the introduction of the ‘Morph Server’, a web server for rapid generation of animations from protein structures (6). This has proven useful to scientists wishing to visualize molecules being studied, and as a source for both quantitative data and movies complementing the collected motions. Although the overlap between the two halves of the database is not perfect (some motions lack multiple crystal structures, and some morphs do not represent genuine conformation changes), the accumulated data is of sufficient quality and depth to enable detailed studies of structural flexibility based on global statistics.
THE MOTIONS DATABASE
The core of the database is a collection of 178 macromolecular motions (as of September 2002) with some textual annotation, including references and solved structures. These are classified by the size of the mobile part, ranging from small loops to entire subunits, and then on the mechanism of motion, usually ‘hinge’ or ‘shear’. The largest grouping by far is hinged domain motions, with 47 proteins listed. Depth of annotation varies; all motions have at least one entry in the Protein Data Bank and one or more references, and the better-studied motions have extensive prose descriptions. Links to extra graphics on- and offsite are included in some cases. Currently, animations of the conformational transition are available for 140 of the entries, namely those for which the crystallographic data is of sufficient quality and availability to generate a simulation. The majority of these movies were produced by our automated system (see below). Motions can either be searched directly or accessed through a browser that classifies them according to motion type, protein fold, or function.
THE GALLERY OF MORPHS
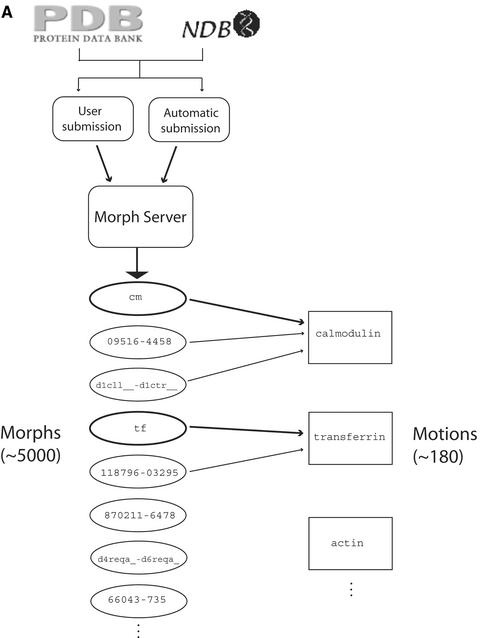
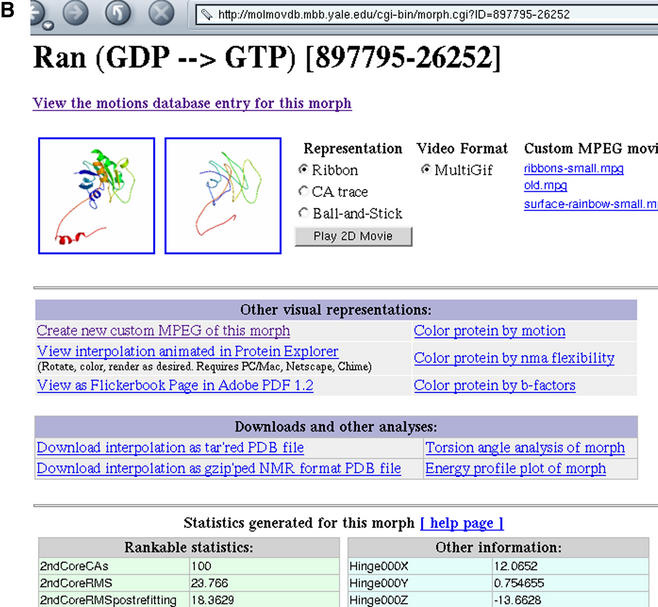
Currently, there are ∼4400 movies of protein motions (also referred to as ‘morphs’) generated by the Morph Server. Of these, 750 were created manually by the authors or from submissions by nearly 200 different users. The remainder (termed the ‘Outlier’ set) were generated automatically from alignments of pairs of structures in the Protein Data Bank (7) having high sequence similarity and significant structural differences (8). Trajectories are generated by adiabatic mapping with either X-PLOR (9) or CNS (10), using a consensus structure if necessary. A number of different animations are provided using the molecular graphics packages PyMOL (http://pymol.sf.net) and Molscript (11), in MPEG, GIF and Adobe PDF formats. The interpolations created are optimized for speed, not chemical realism, but the results usually appear plausible and are well suited to visualization. A comprehensive report is available for each morph, including the statistics obtained through sieve-fitting of the structures and any images available (Fig. 1). We have added the capability for users to generate customized high-quality movies of completed morphs via the web interface, with a complete range of structural representations.
Figure 1.
(A) Schema of the database, showing flow of information and relationship between motions and morphs. The ideal morph for each motion, where available, is shown with bold highlighting. (B) Page describing an individual morph. At the top is a listing of movies and images associated with the morph, followed by more elaborate representations. Complete trajectories are available for download either as a collection of files or as a single PDB file with multiple MODEL records. A comprehensive listing of statistics generated by the server appears below, along with the sequence alignment used as reference when generating the morph (not shown).
The size and scope of the movie collection has made conventional browsing increasingly more difficult. A recent improvement has been the addition of a dynamic interface that displays a gallery of morphs ranked by user-selected statistics. As with motions, specific structures can be located by searching with text strings or PDB IDs. However, the best method of accessing the movies is ultimately through the collected motions. As many morphs as possible have been linked to motion reports (and vice-versa), leaving only those for which insufficient evidence of functional conformational change exists. This process has been streamlined by automatic downloading of references from the PDB and PubMed database, allowing novel morphs to serve as templates for the generation of new entries in the motions database.
SUBSETS AND DISTRIBUTIONS OF THE MORPHS
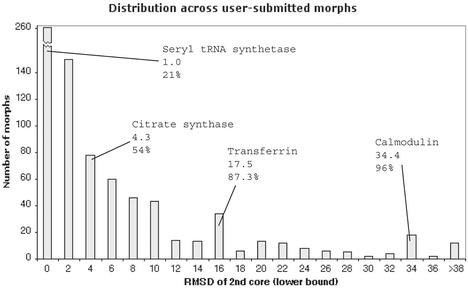
A number of subsets of the morphs have been identified—based on fold, function, or type of motion—for further use in quantitative analyses of protein motion. The distributions of various statistics across a given subset can be plotted graphically. Figure 2 shows an example—the distribution of an RMS deviation statistic (defined in the caption) over the set of user-submitted morphs. Within the current database framework, one can readily plot distributions for other subsets and other standardized statistics (e.g. hinge rotation angle for the ‘outlier set’). These distributions allow one to put an individual motion in context (expressing its motional quantities as percentile ranks) and evaluating whether or not it is typical in the database.
Figure 2.
A representative distribution of a statistic from one subset of the database. The subset encompasses all user-submitted morphs. The statistic used is the RMS deviation (in Angstroms) between start and end frames of the ‘2nd core’, the moving part of the protein, as calculated by our sieve-fitting procedure. The positions of several well-studied motions in this distribution are highlighted and labeled with their respective RMSD and percentile values.
CHANGES TO THE MORPH SERVER
User submissions to the server have proven to be the single most important source of new data, either for entirely novel motions or additional structures of known motions. Although the original version of the server was optimized for handling discrepancies in the input files such as gaps in the structure or different sequences, it did not allow the user to supply multiple chains. A developmental version of the server has been made available which can morph macromolecular complexes, provided the structures supplied are nearly homogeneous. Nucleic acid structures—either alone or with proteins—can also be morphed through this mechanism. These types of structures are more difficult to analyze within the existing framework, and fewer statistics are collected as compared to the normal server. Nonetheless, the ability to visualize conformational changes in multi-chain structures and RNA has improved the annotation available for our directory of motions. For example, movies of the entire 30S ribosomal subunit (12) have been generated using the new server. A number of RNA structures have been incorporated into the database via this mechanism, culled from multiple conformations available in the Nucleic Acid Database (13).
AVAILABILITY AND CONTRIBUTIONS
The database and Morph Server are available at http://molmovdb.org. Submission of new entries is highly encouraged, and users are welcome to contact the authors directly via email if they are aware of omissions in either part of the database. All online data is freely downloadable, including trajectories and movies, as long as the source is cited. Some parts of the database are stored as either MySQL tables (the listing of movies and statistics) or XML files (individual motions), and may be obtained separately by emailing the authors.
Acknowledgments
ACKNOWLEDGEMENTS
The authors would like to thank W. Krebs for his comments. M.G. acknowledges a grant from the NSF (DBI 9723182).
REFERENCES
- 1.Gerstein M., Lesk,A. and Chothia,C. (1994) Structural mechanisms for domain movements. Biochemistry, 33, 6739–6749. [DOI] [PubMed] [Google Scholar]
- 2.Gerstein M. and Krebs,W. (1998) A database of molecular motions. Nucleic Acid Res., 26, 4280–4290. [DOI] [PMC free article] [PubMed] [Google Scholar]
- 3.Murzin A.G., Brenner,S.E., Hubbard,T. and Chothia,C. (1995) SCOP: a structural classification of proteins database for the investigation of sequences and structures. J. Mol. Biol., 247, 536–540. [DOI] [PubMed] [Google Scholar]
- 4.Orengo C.A., Michie,A.D., Jones,S., Jones,D.T., Swindells,M.B. and Thornton,J.M. (1997) CATH- A hierarchic classification of protein domain structures. Structure, 5, 1093–1108. [DOI] [PubMed] [Google Scholar]
- 5.Qian J., Stenger,B., Wilson,C.A., Lin,J., Jansen,R., Teichmann,S.A., Park,J., Krebs,W.G., Yu,H., Alexandrov,V., Echols,N. and Gerstein,M. (2001) PartsList: a web-based system for dynamically ranking protein folds based on disparate attributes, including whole-genome expression and interaction information. Nucleic Acids Res., 29, 1750–1764. [DOI] [PMC free article] [PubMed] [Google Scholar]
- 6.Krebs W.G. and Gerstein,M. (2000) The morph server: a standardized system for analyzing and visualizing macromolecular motions in a database framework. Nucleic Acids Res., 28, 1665–1675. [DOI] [PMC free article] [PubMed] [Google Scholar]
- 7.Berman H.M., Westbrook,J., Feng,Z., Gilliland,G., Bhat,T.N., Weissig,H., Shindyalov,I.N. and Bourne,P.E. (2002) The Protein Data Bank. Nucleic Acids Res., 28, 235–242. [DOI] [PMC free article] [PubMed] [Google Scholar]
- 8.Krebs W.G., Alexandrov,V., Wilson,C., Echols,N., Yu,H. and Gerstein,M. (2002) Normal mode analysis of macromolecular motions in a database framework: Developing mode concentration as a useful classifying statistic. Proteins, 48, 682–695. [DOI] [PubMed] [Google Scholar]
- 9.Brunger A.T. (1993) X-PLOR 3.1, A System for X-ray Crystallography and NMR. Yale University Press, New Haven, USA.
- 10.Brunger A.T., Adams,P.D., Clore,G.M., DeLano,W.L., Gros,P., Grosse-Kunstleve,R.W., Jiang,J.-S., Kuszewski,J., Nilges,N., Pannu,N.S., Read,R.J., Rice,L.M., Simonson,T. and Warren,G.L. (1998) Crystallography and NMR system (CNS): a new software system for macromolecular structure determination. Acta Crystallogr., D54, 905–921. [DOI] [PubMed] [Google Scholar]
- 11.Kraulis P.J. (1991) MOLSCRIPT: a program to produce both detailed and schematic plots of protein structures. J. Appl. Crystallogr., 24, 946–950. [Google Scholar]
- 12.Wimberly B.T., Brodersen,D.E., Clemons,W.M., Morgan-Warren,R., Carter,A.P., Vonrhein,C., Hartsch,T. and Ramakrishnan,V. (2000) Structure of the 30S ribosomal subunit. Nature, 407, 327–339. [DOI] [PubMed] [Google Scholar]
- 13.Berman H.M., Olson,W.K., Beveridge,D.L., Westbrook,J., Gelbin,A., Demeny,T., Hsieh,S.-H., Srinivasan,A.R. and Schneider,B. (1992) The Nucleic Acid Database: a comprehensive relational database of three-dimensional structures of nucleic acids. Biophys. J., 63, 751–759. [DOI] [PMC free article] [PubMed] [Google Scholar]


