Abstract
The Proteome Analysis database (http://www.ebi.ac.uk/proteome/) has been developed by the Sequence Database Group at EBI utilizing existing resources and providing comparative analysis of the predicted protein coding sequences of the complete genomes of bacteria, archeae and eukaryotes. Three main projects are used, InterPro, CluSTr and GO Slim, to give an overview on families, domains, sites, and functions of the proteins from each of the complete genomes. Complete proteome analysis is available for a total of 89 proteome sets. A specifically designed application enables InterPro proteome comparisons for any one proteome against any other one or more of the proteomes in the database.
INTRODUCTION
The EBI Proteome Analysis database (1), developed in 2000, provides a tool for the in silico analysis of proteins and of whole proteomes. Tools like this have become increasingly important, because the various sequencing projects are leading to an accumulating amount of raw sequence data, and the field of proteomics is expanding rapidly.
The Proteome Analysis database has been set up to provide comprehensive statistical analyses of the predicted proteomes of fully sequenced organisms. Since most of the predicted protein sequences are without a documented functional role, the retrieval of information about their structures, potential family memberships, and sequence similarities are essential steps towards the integrated analysis of organisms at the gene, transcript, protein and functional levels. The Proteome Analysis database aims at the integration of information from a variety of sources that will together facilitate the classification of proteins in complete proteome sets. It provides a broad view of the proteome data classified according to signatures describing particular sequence motifs or sequence similarities and at the same time affords the option of examining various specific details like structure or functional classification.
SOURCE DATABASES
The analysis of proteins and proteomes is compiled using the InterPro database (2) on protein families, domains and functional sites, the CluSTr database (3), which offers an automatic classification of proteins into groups of related ones, and GO Slim, part of the Gene Ontology (GO) project (4) which describes genes and gene products according to molecular function, biological process and cellular component. The analysis is performed on non-redundant complete proteome sets of SWISS-PROT and TrEMBL entries (5). Proteomes derived from newly sequenced genomes are identified for advanced promotion into TrEMBL: at this stage the annotation of entries is upgraded, and proteome analysis is performed. The data in the Proteome Analysis database is spanning archaea, bacteria and eukaryotes. From all organisms, there are links to the NEWT Taxonomy Browser (http://www.ebi.ac.uk/newt/index.html).
STATISTICAL ANALYSIS
Several different forms of analyses of proteins and proteomes are performed in the Proteome Analysis database, some are precomputed, others are carried out dynamically:
InterPro analysis: the Proteome Analysis pages make available InterPro-based statistical analysis of each of the proteomes, like general statistics (matches per genome and the number of proteins matched for each InterPro entry), Top 30 and Top 200 InterPro entries (entries with the highest number of protein matches for the reference proteome), 15 most common families, and 15 most common domains.
CluSTr analysis: the CluSTr-based analysis comprises data on general statistics (the number of clusters with two or more proteins, the total number of proteins in these clusters, the number of singletons and the number of distinct families at different levels of protein similarity), a list of singletons, and 30 biggest clusters. It also suggests a list of candidates for novel protein domains as well as targets for structural genomics.
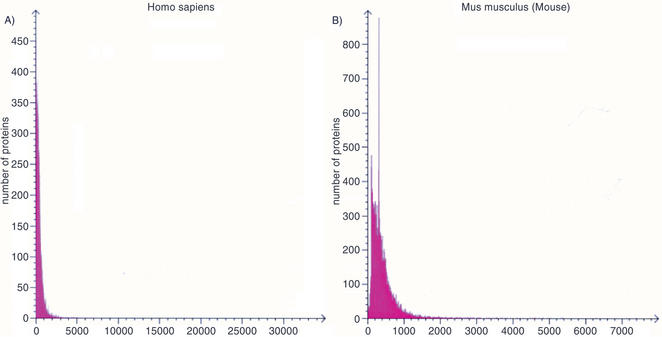
Structural information: structural information in the Proteome Analysis pages includes protein length distribution and amino acid composition for each of the proteomes, which are also represented graphically (Fig. 1). Additionally, links are provided to the Homology derived Secondary Structure of Proteins database (HSSP; 6), the Protein Data Bank (PDB; 7), and the Structural Classification of Proteins database (SCOP; 8). There is also the option to view the structures with molecular visualization software, RasMol (http://www.umass.edu/microbio/rasmol/) and Chime (http://www.umass.edu/microbio/chime/).
Comparative analysis: comparative analysis data is presented in two different versions; static and dynamic HTML pages. The static HTML pages contain the most obvious proteome comparisons, based on InterPro statistics. The dynamic HTML pages allow the user to compare a reference proteome with any other (one or more) proteomes (9).
Additional analysis: the classification of proteomes is performed according to the assignment of proteins to a selection of high level terms from each of the three GO sections, molecular function, biological process and cellular component (GO Slim). A functional classification of the proteins within each proteome set has been generated to show the percentage of proteins involved in, for example, metabolism, transcription, etc.
Chromosome tables: chromosome tables are available for most of the proteomes in the database, providing an ordered list of genes, together with their chromosome location, information about the protein they encode and useful links to other databases. Tables are provided for each chromosome, and also for organelle genomes and plasmids, where these are considered to comprise part of the normal genome of a fully-sequenced organism. For archaeal and bacterial proteomes, the chromosomal location for the start of each gene is given in nucleotides, using the DNA sequence in the corresponding EMBL Nucleotide Sequence database (10) Genomes record as a reference. The length of the gene (the ‘offset’ from the start position), and its location on the forward or reverse strands, are also given. For Saccharomyces cerevisiae, mappings between proteins in SWISS-PROT/TrEMBL and those in the Saccharomyces Genome Database (SGD) using sequence similarity were created. Mappings have also been made between human entries in the SWISS-PROT and TrEMBL databases and the corresponding official HUGO gene symbol or NCBI LocusLink provisional symbol. Two views for each chromosome are available; a full view, listing all genes in the specified chromosome together with additional links to specialized databases, and a gene-disease view which displays only genes that are annotated in SWISS-PROT and TrEMBL as linked to one or more diseases. Further to the chromosome tables for the human proteome, a gene search facility allows the user to search using the gene name, chromosome location, keyword and/or text.
Figure 1.
Analysis of full-length proteins (fragments excluded): (a) Homo sapiens—average protein length: 469 amino acid residues; size range: 3–34 350 amino acid residues. (b) Mus musculus—average protein length: 416 amino acid residues; size range: 10–7389 amino acid residues.
DATABASE APPLICATIONS AND DATA PRESENTATION
The Proteome Analysis database provides information on domain structure and function, gene duplication and protein families in different genomes. A variety of ways to query and compare the data, depending on the objectives of the analysis, is offered. The tools to interrogate and compare entire proteomes of organisms by domain and/or protein family distributions and combinations provide the means that make it possible to identify systematically conserved proteins, conserved families that are missing in a given genome, or proteins unique to a particular species. Many new proteomes have been added and the database now holds data for 89 proteomes (September 2002). Although complete coding sequence predictions for Homo sapiens and Mus musculus are not yet available in the EMBL Nucleotide Sequence database, SWISS-PROT, TrEMBL and Ensembl (11) jointly offer a draft complete proteome for these species. This data is available as part of the Proteome Analysis Database.
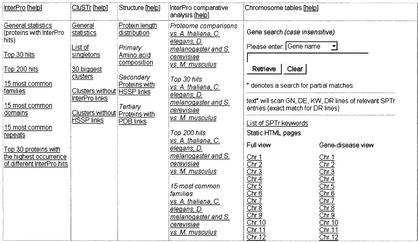
The Proteome Analysis home page (http://www.ebi.ac.uk/proteome/) provides a hyperlinked list of the proteomes analysed, arranged under the classification of archaea, bacteria and eukaryotes. The top level Proteome Analysis page of each organism provides hyperlinks to the data generated by the types of analyses mentioned throughout the paper which are all organized in the form of a table (Fig. 2). In addition, the index page of each organism contains further information such as a brief description of the organism, where the complete genome sequencing was carried out, hyperlinks to the first publication of the complete genome, additional relevant sites and contact information. Links are provided to the EBI genome and proteome Fasta server (http://www.ebi.ac.uk/fasta33/genomes.html). This server allows users to perform FASTA searches with their own query sequences against one or many proteomes or genomes.
Figure 2.
Part of the top level proteome analysis page for Homo sapiens.
REFERENCES
- 1.Apweiler R., Biswas,M., Fleischmann,W., Kanapin,A., Karavidopoulou,Y., Kersey,P., Kriventseva,E.V., Mittard,V., Mulder,N., Phan,I. and Zdobnov,E. (2001) Proteome Analysis database: online application of InterPro and CluSTr for the functional classification of proteins in whole genomes. Nucleic Acids Res., 29, 44–48. [DOI] [PMC free article] [PubMed] [Google Scholar]
- 2.Apweiler R., Attwood,T.K., Bairoch,A., Bateman,A., Birney,E., Biswas,M., Bucher,P., Cerutti,L., Corpet,F., Croning,M.D.R. et al. (2001) The InterPro database, an integrated documentation resource for protein families, domains and functional sites. Nucleic Acids Res., 29, 37–40. [DOI] [PMC free article] [PubMed] [Google Scholar]
- 3.Kriventseva E.V., Fleischmann,W., Zdobnov,E.M. and Apweiler,R. (2001) CluSTr: a database of clusters of SWISS-PROT+TrEMBL proteins. Nucleic Acids Res., 29, 33–36. [DOI] [PMC free article] [PubMed] [Google Scholar]
- 4.Ashburner M., Ball,C.A., Blake,J.A., Botstein,D., Butler,H., Cherry,J.M., Davis,A.P., Dolinski,K., Dwight,S.S., Eppig,J.T. et al. (2000) Gene Ontology: tool for the unification of biology. The Gene Ontology Consortium. Nature Genet., 25, 25–29. [DOI] [PMC free article] [PubMed] [Google Scholar]
- 5.Bairoch A. and Apweiler,R. (2000) The SWISS-PROT protein sequence database and its supplement TrEMBL in 2000. Nucleic Acids Res., 28, 45–48. [DOI] [PMC free article] [PubMed] [Google Scholar]
- 6.Holm L. and Sander,C. (1999) Protein folds and families: sequence and structure alignments. Nucleic Acids Res., 27, 244–247. [DOI] [PMC free article] [PubMed] [Google Scholar]
- 7.Berman H.M., Westbrook,J., Feng,Z., Gilliland,G., Bhat,T.N., Weissig,H., Shindyalov,I.N. and Bourne,P.E. (2000) The Protein Data Bank. Nucleic Acids Res., 28, 235–242. [DOI] [PMC free article] [PubMed] [Google Scholar]
- 8.Lo Conte L., Brenner,S.E., Hubbard,T.J.P., Chothia,C. and Murzin,A.G. (2002) SCOP database in 2002: refinements accommodate structural genomics. Nucleic Acids Res., 30, 264–267. [DOI] [PMC free article] [PubMed] [Google Scholar]
- 9.Kanapin A., Apweiler,R., Biswas,M., Fleischmann,W., Karavidopoulou,Y., Kersey,P., Kriventseva,E.V., Mittard,V., Mulder,N., Oinn,T., Phan,I., Servant,F. and Zdobnov,E. (2002) Interactive InterPro-based comparisons of proteins in whole genomes. Bioinformatics, 18, 374–375. [DOI] [PubMed] [Google Scholar]
- 10.Stoesser G., Baker,W., van den Broek,S., Camon,E., Garcia-Pastor,M., Kanz,C., Kulikova,T., Leinonen, R., Lin,Q., Lombard,V., Lopez,R., Redaschi,N., Stoehr,P., Tuli,M.A., Tzouvara,K. and Vaughan,R. (2002) The EMBL Nucleotide Sequence Database. Nucleic Acids Res., 30, 21–26. [DOI] [PMC free article] [PubMed] [Google Scholar]
- 11.Hubbard T., Barker,D., Birney,E., Cameron,G., Chen,Y., Clark,L., Cox,T., Cuff,J., Curwen,V., Down,T. et al. (2002) The Ensembl genome database project. Nucleic Acids Res., 30, 38–41. [DOI] [PMC free article] [PubMed] [Google Scholar]


