Abstract
MBGD is a workbench system for comparative analysis of completely sequenced microbial genomes. The central function of MBGD is to create an orthologous gene classification table using precomputed all-against-all similarity relationships among genes in multiple genomes. In MBGD, an automated classification algorithm has been implemented so that users can create their own classification table by specifying a set of organisms and parameters. This feature is especially useful when the user's interest is focused on some taxonomically related organisms. The created classification table is stored into the database and can be explored combining with the data of individual genomes as well as similarity relationships among genomes. Using these data, users can carry out comparative analyses from various points of view, such as phylogenetic pattern analysis, gene order comparison and detailed gene structure comparison. MBGD is accessible at http://mbgd.genome.ad.jp/.
INTRODUCTION
The growth of the number of completed microbial genome sequences is accelerated recently and nearly a hundred of genomes in various levels of relatedness have already been available today. Especially interesting are the recently available multiple genomes of some particular taxonomic groups such as proteobacteria gamma subdivision and Bacillus/Clostridium group in gram-positive bacteria. The role of comparative genomics becomes much more important to utilize these large number of sequences not only for elucidating commonality in all of life, but also for understanding the evolutionary diversity within various groups, as well as for understanding the evolutionary processes or mechanisms producing such diversity.
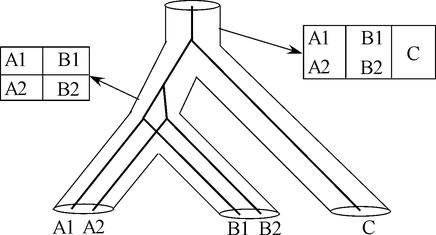
Ortholog identification is a crucial step for comparative genome analysis and several systems providing ortholog grouping have been developed (1–5). Clusters of Orthologous Groups (COG) (1,2) is a representative of such system, where comprehensive ortholog classification is manually maintained; each COG entry is well annotated and is assigned a stable accession number. In spite of its usefulness for genome annotation as well as for comparative genome analysis, however, ortholog grouping is not so simple task and a single classification table is not sufficient for every purpose of comparative analysis. Indeed, ortholog grouping can be considered as a mapping from hierarchical structure representing gene phylogeny into a simple classification table, and different partitioning of the same set of genes may result when different sets of organisms are considered (Fig. 1). In general, when one intends to compare genomes of some closely related organisms, resulting orthologous groups are expected to contain more one-to-one relationships than those created from all organisms currently sequenced.
Figure 1.
Ortholog grouping as a mapping from tree structures to a classification table. In this figure, a species tree among three organisms A, B and C is drawn by pipes and a gene tree among five genes A1, A2, B1, B2 and C is drawn by lines. The left table represents an ortholog grouping created from two organisms A and B that contains two ortholog clusters, whereas the right table created from three organisms A, B and C consists of only one ortholog cluster.
Since the first release in 1997, MBGD has been developed under a different concept: it provides a classification system rather than a classification result itself. The key components of MBGD include, (i) an algorithm that can classify genes into orthologous groups using precomputed all-against-all homology search results, (ii) a user interface that is designed for users to explore the resulting classification in detail, and (iii) an incremental updating process for similarities and other data, which enables the system to provide the latest data rapidly. MBGD allows users to create their own orthologous classification table using a specified set of organisms. By this approach, the users can obtain appropriate classification results that they want using the latest data available. On the other hand, the users themselves should examine the classification results carefully to interpret them. MBGD provides various functions to support this task.
In this paper, we introduce the concept, architecture and usability of MBGD.
BUILDING THE DATABASE
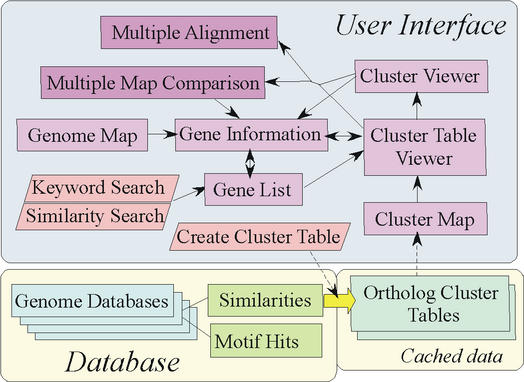
The overall architecture of MBGD is illustrated in Figure 2. In MBGD, similarity relationships among all protein coding genes in genomes are precomputed and stored. Using these data and a user-specified set of organisms and/or parameters, an ortholog classification table is dynamically created. The created table is cached into the database and one can compare multiple genomes by this table from various points of view such as gene arrangement and phylogenetic relationship. The user can also specify keywords or query sequences to retrieve a set of genes to see the cluster table containing them.
Figure 2.
Overall architecture of MBGD. Three components (database, cached data created on demand and user interfaces) are separately shown.
Genome sequence data were obtained from the NCBI GenBank FTP site (6). In addition to all bacterial and archaeal genome sequences, currently two eukaryotic genomes, Saccharomyces cerevisiae and Schizosaccharomyces pombe are included. Sequence similarities are calculated at first by the BLAST program (7). To eliminate the database size dependency, the size of search space is adjusted to 109 for every BLAST search. The similarity is retained when the adjusted E-value is less than or equal to 10−2, and in such a case a rigorous alignment is calculated by the dynamic programming (DP) algorithm (8) with 250 PAM PET91 scoring matrix (9). Motifs are searched against the PROSITE library (10) as well as the CDD database (11) containing domain profiles originally defined in Pfam (12) or SMART (13).
Function category assignment in MBGD is based on the consensus of the assignments by the original authors, each of which was actually taken from the KEGG web site (4). For the purpose of comparison, we created a reference set of function categories based on the TIGR role categories on the CMR site (14) and made correspondence between the reference and original categories by names. Though most of the original categories could correspond to at least a top level of the reference hierarchy, some categories that could not fit to the reference are discarded. Despite this correspondence, policies to assign function categories to individual genes may still be different between genomes and even apparent orthologs may be classified into different categories. In MBGD, a function category of each ortholog group is determined by a majority vote and each member of the group is reassigned to this category.
MBGD uses MySQL database management system to store most of the data including similarity relationships as well as cluster tables created on demand.
CLUSTERING ORTHOLOGOUS GENES
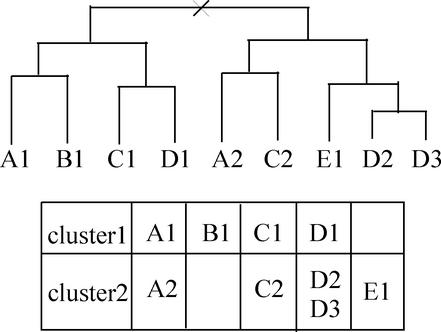
Creating orthologous gene classification table is the central function of MBGD. Here, we briefly introduce the algorithm, although details will be published elsewhere. The algorithm at first performs hierarchical clustering procedure known as UPGMA (Unweighted Pair Group Method with Arithmetic mean) (15) using the precomputed similarities and then splits the resulting hierarchical trees so as to separate intra-species paralogous genes (Fig. 3). To classify fusion proteins correctly, the algorithm also splits genes into domains if required, during the course of clustering.
Figure 3.
Tree splitting procedure for ortholog grouping in MBGD. In this figure, nine genes (A1, B1 etc.) in five organisms (A–E) are classified into two clusters. In this example, the root node is split because three out of four organisms are duplicated in both of the subtrees. The cutoff ratio of duplicated organisms in each root node is a parameter of our algorithm. Note that here we do not consider the species phylogeny in contrast to Figure 1.
Tree splitting process is one of the most essential parts for ortholog grouping. Actually, it does not consider species phylogeny but considers only sets of organisms contained in both sides of the tree root. This approach is, in strict sense, not a correct ortholog grouping, but can be plausible for comparison of microbial genomes, where a substantial number of horizontal gene transfers should have been occurred. Although it typically gives similar results to those from clustering of bi-directional best-hit relationships, especially when the resulting ortholog group is a simple one-to-one relationship, it can handle intra-species homologous relationships in more unified manner. Indeed, in MBGD users can optionally create a homologous (not an orthologous) gene cluster table by simply omitting this tree splitting procedure. Difference may also arise when some of the homologous genes were lost in the course of evolution, as in the example of Figure 3. A natural explanation in this case is that the genes in organisms E and B are lost from the orthologous linage 1 and 2, respectively. Nonetheless, bi-directional best-hit approach might detect genes B1 and E1 as orthologs. Although we think that our approach can give relatively more exact relationships, sometimes users may want to consider B1 and E1 as indeed orthologs [or ‘equivalogs’ (3)] when they have a conviction or expectation that the two groups have the equivalent function and/or both the organisms B and E should have genes with the corresponding function. Moreover, UPGMA cannot recover the correct topology of phylogenetic relationships in general. In MBGD, users can easily re-examine this splitting individually on the cluster table viewer (see below).
EXPLORING THE CLUSTER TABLE
In MBGD, a default cluster table has been precomputed using a default set of organisms that contains one strain from every species. When users change the set of organisms or parameters [the NCBI taxonomy database (16) can be used for organism selection], the clustering procedure is invoked. Typically, clustering with 20 or less genomes requires a few minutes of computation. Once created, the new table is used throughout the session instead of the default one.
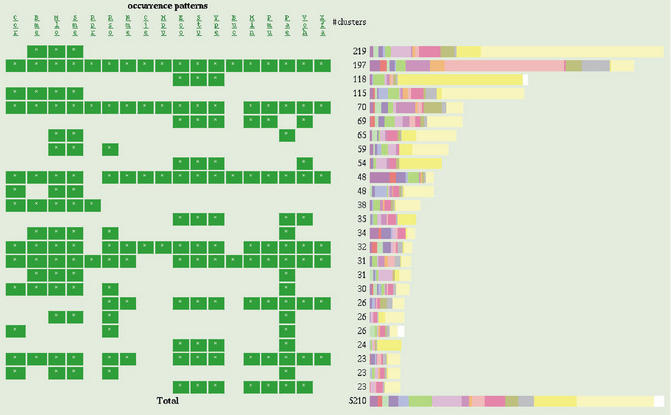
The clustering result is summarized as a bar graph which we call cluster map (Fig. 4). In this graph, the result is sorted according to the phylogenetic patterns (1) or profiles (17), which represent presence or absence of the orthologs in each genome and each cluster is assigned a color according to its function category. The map can be redrawn with a restricted set of clusters by specifying conditions on phylogenetic patterns or keywords. Users can find some phylgenetic patterns that are strongly related to some particular functions on this map.
Figure 4.
Gene cluster map created from 18 organisms belonging to proteobacteria. The left hand side of the figure shows phylogenetic patterns (occurrence patterns in our original terminology), which represent presence (green box) or absence of orthologs in each genome. The bar graph of the right-hand side shows the number of clusters of each phylgenetic pattern, where colors represent function categories. See the web site for explanation of the colors and the abbreviations of organisms' names.
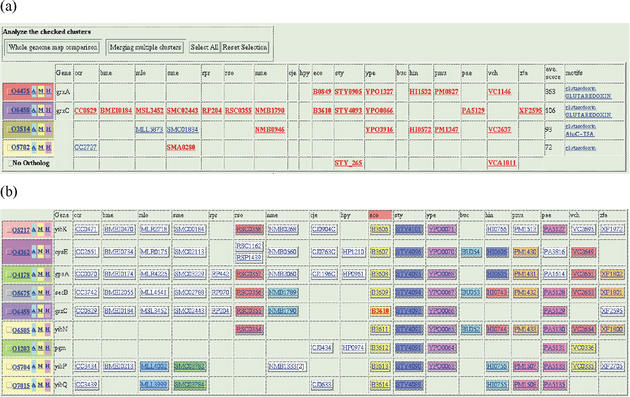
Either by clicking the bar graph of the map or by pressing the ‘Show cluster table’ button, the actual cluster table is shown, where each row represents an ortholog cluster and each column represents an organism (Fig. 5). The first column of each row is a control panel for examining the clustering results in detail. Basically, there are three functions: a multiple sequence alignment by MAP (18) or CLUSTALW (19) program (by ‘A’ button); a comparative display of genome maps around the current orthologs, where orthologous genes are shown by the same colors and patterns (by ‘M’ button); and finding homologous clusters i.e. clusters containing some genes homologous to one of the genes in the current cluster (by ‘H’ button). By the first two functions, users can examine the degree of conservation within the current cluster from the viewpoint of either sequence or gene arrangement. A more rigorous phylogenetic relationship can also be seen by constructing a neighbor-joining tree (20) from the resulting alignment. Another page, a cluster viewer, which can be accessed by clicking the cluster identifier in the first column, provides the same functions, but allows the users to select genes to be analyzed individually.
Figure 5.
Ortholog cluster tables. Both tables were created from the same 18 proteobacteria as in Figure 4. (a) Ortholog clusters that are homologous to grxA (glutaredoxin 1) orthologs. Four clusters and two singletons (appeared in the ‘No Ortholog’ row) are found and are ordered by average similarity scores shown in the last but one column. Genes that are actually found by similarity searches are written in red boldface. (b) Ortholog clusters that contain genes around B3610 gene on the Escherichia coli genome. Ortholog clusters are ordered according to the gene order of the E.coli genome, and neighboring genes in each genome are assigned the same colors. Note that the same colors in different genomes (columns) have no meaning.
The last function is probably the most notable function of the MBGD interface (Fig. 5a). Here, homologous clusters are listed in the order of average pairwise similarity scores against the current cluster. By successive use of this function, one can navigate the protein space along the transitive similarity. Similar, but generally more comprehensive collection of homologous clusters may also be obtained by clicking a motif name appeared at the last column, if available. These functions present views of hierarchical structures of homology–orthology relationships and they may give a solution for the classification difficulty described above: when the users suspect that some genes are missing from the resulting cluster table, the objective genes may be found out by such an analysis. Especially, if some homologous clusters have phylogenetic patterns that are nearly complementary to each other, there is a possibility that they are in fact evolutionary diverged orthologs or functionary equivalent non-orthologous (paralogous or xenologous) genes (21). In such cases, users can merge the current and the objective clusters, and apply multiple sequence alignment or multiple map comparison program for examining similarities among them.
MBGD also provides another representation of the cluster table that is useful for comparison of gene orders in multiple genomes (Fig. 5b). In this table, clusters are ordered according to the order of the reference genome and neighboring genes on each genome are assigned the same colors. Since this representation requires a gene that is located at the center of the reference genome, it can be accessed through an individual gene information page that is obtained by clicking a particular gene name.
SEARCHING THE CLUSTER TABLE
MBGD provides several methods to retrieve specific orthologous groups from the default or created cluster table (Fig. 2). For example, users can specify keywords on the top page of MBGD. The system searches for the keywords at first in individual gene records, and then it finds clusters containing the retrieved genes. In this case, the users need pay less attention to the differences of descriptions between organisms, because they can finally get all of the orthologous genes.
MBGD also provides a usual genome map search interface for users to navigate an individual genome to retrieve a particular gene. All information about a particular gene such as homology relationships and motif hits is summarized in a gene information page, which also includes a link to retrieve neighboring orthologs (Fig. 5b), as described above.
Users can also specify query sequences for similarity search. Here, the system calculates similarities between query and database sequences by the same way as all-against-all similarities in MBGD, i.e. BLAST searches followed by DP alignment and then finds the clusters containing those genes hit by the search. The result is listed in the order of the average similarity scores against the query in the same way as shown in Figure 5a.
Acknowledgments
ACKNOWLEDGEMENTS
I am grateful to Dr Toshihisa Takagi for his advice and help in initiating this project and continuous support, and to Dr Naotake Ogasawara for helpful suggestions. I also thank Toshio Higuchi for technical assistance and Yoichi Hashimoto and Kagehiko Kitano for their initial contributions. This work was supported in part by Grant-in-Aid for Scientific Researches on Priority Areas (C) ‘Genome Information Science’ from Ministry of Education, Culture, Sports, Science and Technology of Japan and by Human Genome Center, University of Tokyo. Computational resources were provided by Computer Laboratory, National Institute for Basic Biology, Okazaki National Research Institutes.
REFERENCES
- 1.Tatusov R.L., Koonin,E.V. and Lipman,D.J. (1997) A genomic perspective on protein families. Science, 278, 631–637. [DOI] [PubMed] [Google Scholar]
- 2.Tatusov R.L., Natale,D.A., Garkavtsev,I.V., Tatusova,T.A., Shankavaram,U.T., Rao,B.S., Kiryutin,B., Galperin,M.Y., Fedorova,N.D. and Koonin,E.V. (2001) The COG database: new developments in phylogenetic classification of proteins from complete genomes. Nucleic Acids Res., 29, 22–28. [DOI] [PMC free article] [PubMed] [Google Scholar]
- 3.Haft D.H., Loftus,B.J., Richardson,D.L., Yang,F., Eisen,J.A., Paulsen,I.T. and White,O. (2001) TIGRFAMS: a protein family resource for the functional identification of proteins. Nucleic Acids Res., 29, 41–43. [DOI] [PMC free article] [PubMed] [Google Scholar]
- 4.Kanehisa M., Goto,S., Kawashima,S. and Nakaya,A. (2002) The KEGG database at GenomeNet. Nucleic Acids Res., 30, 42–46. [DOI] [PMC free article] [PubMed] [Google Scholar]
- 5.Overbeek R., Larsen,N., Pusch,G.D., D'Souza,M., Selkov,E.,Jr, Kyrpides,N., Fonstein,M., Maltsev,N. and Selkov,E. (2000) WIT: integrated system for high-throughput genome sequence analysis and metabolic reconstruction. Nucleic Acids Res., 28, 123–125. [DOI] [PMC free article] [PubMed] [Google Scholar]
- 6.Benson D.A., Karsch-Mizrachi,I., Lipman,D.J., Ostell,J., Rapp,B.A. and Wheeler,D.L. (2002) GenBank. Nucleic Acids Res., 30, 17–20. [DOI] [PMC free article] [PubMed] [Google Scholar]
- 7.Altschul S.F., Madden,T.L., Schaffer,A.A., Zhang,J., Zhang,Z., Miller,W. and Lipman,D.J. (1997) Gapped BLAST and PSI-BLAST: a new generation of protein database search programs. Nucleic Acids Res., 25, 3389–3402. [DOI] [PMC free article] [PubMed] [Google Scholar]
- 8.Smith T.F. and Waterman,M.S. (1981) Identification of common molecular subsequences. J. Mol. Biol., 147, 195–197. [DOI] [PubMed] [Google Scholar]
- 9.Jones D.T., Taylor,W.R. and Thornton,J.M. (1992) The rapid generation of mutation data matrices from protein sequences. Comput. Appl. Biosci., 8, 275–282. [DOI] [PubMed] [Google Scholar]
- 10.Falquet L., Pagni,M., Bucher,P., Hulo,N., Sigrist,C.J.A., Hofmann,K. and Bairoch,A. (2002) The PROSITE database, its status in 2002. Nucleic Acids Res., 30, 235–238. [DOI] [PMC free article] [PubMed] [Google Scholar]
- 11.Marchler-Bauer A., Panchenko,A.R., Shoemaker,B.A., Thiessen,P.A., Geer,L.Y. and Bryant,S.H. (2002) CDD: a database of conserved domain alignments with links to domain three-dimensional structure. Nucleic Acids Res., 30, 281–283. [DOI] [PMC free article] [PubMed] [Google Scholar]
- 12.Bateman A., Birney,E., Cerruti,L., Durbin,R., Etwiller,L., Eddy,S.R., Griffiths-Jones,S., Howe,K.L., Marshall,M. and Sonnhammer,E.L.L. (2002) The Pfam Protein Families Database. Nucleic Acids Res., 30, 276–280. [DOI] [PMC free article] [PubMed] [Google Scholar]
- 13.Letunic I., Goodstadt,L., Dickens,N.J., Doerks,T., Schultz,J., Mott,R., Ciccarelli,F., Copley,R.R., Ponting,C.P. and Bork,P. (2002) Recent improvements to the SMART domain-based sequence annotation resource. Nucleic Acids Res., 30, 242–244. [DOI] [PMC free article] [PubMed] [Google Scholar]
- 14.Peterson J.D., Umayam,L.A., Dickinson,T., Hickey,E.K. and White,O. (2001) The comprehensive microbial resource. Nucleic Acids Res., 29, 123–125. [DOI] [PMC free article] [PubMed] [Google Scholar]
- 15.Sneath P.H.A. and Sokal,R.R. (1973) Numerical Taxonomy. Freeman, San Francisco.
- 16.Wheeler D.L., Chappey,C., Lash,A.E., Leipe,D.D., Madden,T.L., Schuler,G.D., Tatusova,T.A. and Rapp,B.A. (2000) Database resources of the National Center for Biotechnology Information. Nucleic Acids Res., 28, 10–14. [DOI] [PMC free article] [PubMed] [Google Scholar]
- 17.Pellegrini M., Marcotte,E.M., Thompson,M.J., Eisenberg,D. and Yeates,T.O. (1998) Assigning protein functions by comparative genome analysis: protein phylogenetic profiles. Proc. Natl Acad. Sci. USA, 96, 4285–4288. [DOI] [PMC free article] [PubMed] [Google Scholar]
- 18.Huang X. (1994) On global sequence alignment. Comput. Appl. Biosci., 10, 227–235. [DOI] [PubMed] [Google Scholar]
- 19.Thompson J.D., Higgins,D.G. and Gibson,T.J. (1994) CLUSTAL W: improving the sensitivity of progressive multiple sequence alignment through sequence weighting, position-specific gap penalties and weight matrix choice. Nucleic Acids Res., 22, 4673–4680. [DOI] [PMC free article] [PubMed] [Google Scholar]
- 20.Saitou N. and Nei,M. (1987) The neighbor-joining method: a new method for reconstructing phylogenetic trees. Mol. Biol. Evol., 4, 406–425. [DOI] [PubMed] [Google Scholar]
- 21.Galperin M.Y. and Koonin,E.V. (2000) Who's your neighbor? New computational approaches for functional genomics. Nat. Biotechnol., 18, 609–613. [DOI] [PubMed] [Google Scholar]


