Abstract
Enlarged FAMSBASE is a relational database of comparative protein structure models for the whole genome of 41 species, presented in the GTOP database. The models are calculated by Full Automatic Modeling System (FAMS). Enlarged FAMSBASE provides a wide range of query keys, such as name of ORF (open reading frame), ORF keywords, Protein Data Bank (PDB) ID, PDB heterogen atoms and sequence similarity. Heterogen atoms in PDB include cofactors, ligands and other factors that interact with proteins, and are a good starting point for analyzing interactions between proteins and other molecules. The data may also work as a template for drug design. The present number of ORFs with protein 3D models in FAMSBASE is 183 805, and the database includes an average of three models for each ORF. FAMSBASE is available at http://famsbase.bio.nagoya-u.ac.jp/famsbase/.
INTRODUCTION
Genome sequencing projects have generated an enormous amount of protein sequence information (1). About half of the encoded amino acid sequences are for proteins of unknown function (2), and computational and experimental methods have been developed to obtain any functional information on these proteins (3). Proteins only function when they correctly fold, and the three dimensional (3D) structure of proteins is one of the most important pieces of information for predicting function (4). Functional sites are dispersed in a protein's amino acid sequence, but upon folding are placed in close spatial relationship. In an enzyme, for instance, a ligand binds to a pocket on the surface of the protein, and the structure of the pocket basically determines which ligands can interact with the enzyme. In order to assess the function of these unstudied proteins, structural genomic projects have been started. However, one cannot determine every protein 3D structure within a reasonable time, and therefore, homology modeling will play an important role in the coming era of structural genomics (5). Thus, assessing the ratio of ORFs whose protein 3D structures can be modeled by the present homology modeling methods is important for the methods and for deciding target sequences for structural genomics. An appropriate target selection for the structural genomics will effectively increase template structures for the homology modeling.
We developed enlarged FAMSBASE, a database of protein homology modeling against the whole genomes of 41 species by expanding former FAMSBASE against genomes of two species (6,7). The details of FAMSBASE will be published elsewhere (Umeyama et al., in preparation.) In this report, we describe the features and statistics of enlarged FAMSBASE.
FEATURES OF FAMSBASE
FAMSBASE is a PostgreSQL driven relational database. Homology modeling requires template searching, sequence alignment between template and target sequences and modeling. In FAMSBASE, template searching and sequence alignment are wholly based on the GTOP database (8). In the 2001 version of GTOP database, the whole genome sequences of 41 species were processed through PSI-BLAST analysis (9) against the amino acid sequences of proteins in the Protein Data Bank (PDB) (10). ORFs in genome sequences with E-values from PSI-BLAST results of less than 0.001 were treated as ORFs having template structures. Every ORF with corresponding 3D structure in PDB is automatically modeled by FAMS (Full Automatic Modeling System) (11), and the atomic coordinates of such models are stored in FAMSBASE. FAMS participated in CAFASP2, the second Critical Assessment of Fully Automated Structure Prediction, and outperformed other methods (12,13). Based on a template protein and a pair-wise alignment found by PSI-BLAST with a threshold E-value of 0.001, FAMS first builds a protein backbone by minimizing the conformational energy with a simulated annealing method, and then generates side chains for each residue. The main chain is then optimized with a constraint on all side chains. The above procedure is iteratively applied. The details of the procedure will be explained elsewhere (Umeyama et al., in preparation). FAMS is now accessible at http://physchem.pharm.kitasato-u.ac.jp/. Model building of those ORFs has been carried out on 1000 nodes of PC clusters. The operating system will be published elsewhere (Umeyama et al., in preparation).
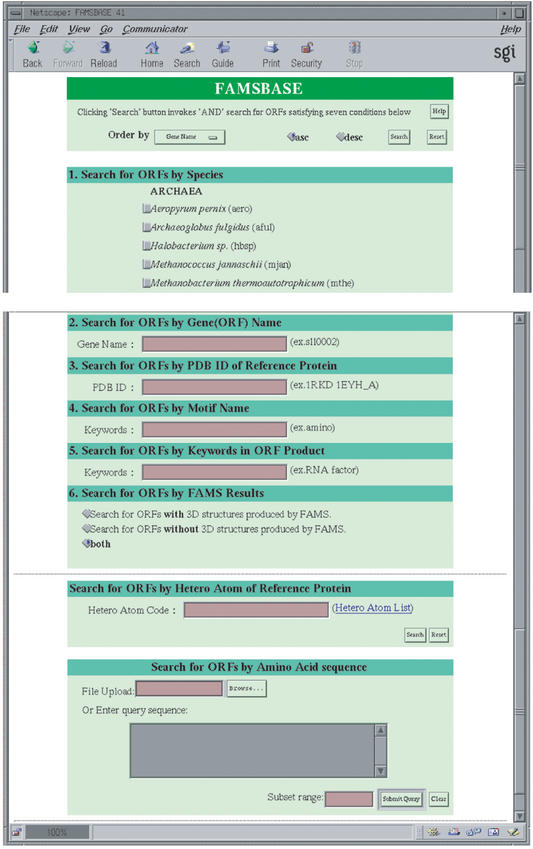
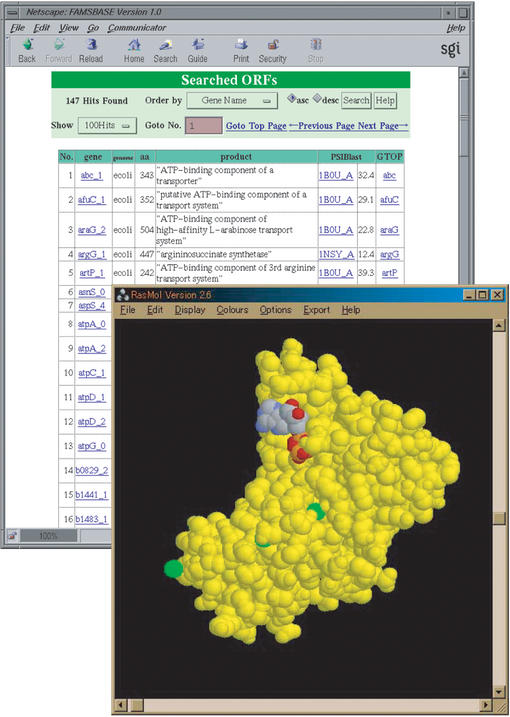
Enlarged FAMSBASE is located at http://famsbase.bio.nagoya-u.ac.jp/famsbase/ and freely accessible from academic sites. For accesses from a company, restrictions have been imposed. In enlarged FAMSBASE, one can find a protein 3D structure of a certain ORF by gene name, PDB ID of the template, or keywords, or alternatively, one can also search the modeled structure using FASTA sequence search tool (14) (Fig. 1). In enlarged FAMSBASE a search can also be performed using names of PDB heterogen atoms. Protein 3D structures are often determined with non-protein molecules, such as ATP, DNA and heme. When template structures for modeling include heterogen molecules, the modeled proteins may also bind similar molecules. In enlarged FAMSBASE, given a name of a heterogen molecule, one can find ORFs whose 3D structure templates have heterogen molecules, such as an ATP molecule on a transporter (Fig. 2). This information may suggest functionally important sites of the protein encoded by the ORFs. Other analyses, such as checking for conserved amino acid residues at the putative heterogen-binding sites and calculating binding energy should also be performed for rigorous binding site prediction.
Figure 1.
The FAMSBASE website. Species names whose genome sequences are available are listed at the top page. Search tools are listed at the bottom of the page.
Figure 2.
Predicted interactions of modeled structure and ATP. The enlarged FAMSBASE can be searched by names of heterogen molecules attached to template structures. When enlarged FAMSBASE is searched by ‘ATP’, ORFs whose template 3D structures were solved with ATP are listed. The 3D structure can be shown with the heterogen atoms. Note that the location of heterogen atoms was not optimized using the modeled 3D structures. A model structure is shown in yellow and ATP is shown in colors that clarify differences of atoms.
STATISTICS IN FAMSBASE
Enlarged FAMSBASE contains protein 3D structure models for whole genomes of 41 species (Table 1). The number of ORFs with 3D structure is now 51 430. This number consists of about 42% of whole ORFs of 41 species (Table 1). A percentage of 3D structures against the number of ORFs in the bacteriophage T4 genome is relatively small compared to that of other genomes. This is due to the sequence diversity of proteins encoded by the bacteriophage genome, and may reflect distinct evolution of this organism. In enlarged FAMSBASE, each ORF has at most five 3D structure models. The five models were created based on the top five hits using PSI-BLAST against PDB, as shown in GTOP. When the number of hits was less than five, all the hits were used as the template. The average number of models for each ORF was three. A user can compare the five models for a single ORF and assume a reliable 3D structure. When the modeled structures are completely different from one another, even though the models are supposed to be of the same domain, then the modeled structure is unreliable. The number of models in the current FAMSBASE is 183 805.
Table 1. Species and proportion of protein 3D structures in enlarged FAMSBASE.
| Organism | # model | # ORF | # modeled ORF (%) |
|---|---|---|---|
| Aeropyrum pernix (aero) | 2177 | 2694 | 620 (23.0) |
| Archaeoglobus fulgidus (aful) | 3530 | 2407 | 996 (41.4) |
| Halobacterium sp. (hbsp) | 2845 | 2058 | 843 (41.0) |
| Methanococcus jannaschii (mjan) | 2471 | 1715 | 698 (40.7) |
| Methanobacterium thermoautotrophicum (mthe) | 2789 | 1869 | 798 (42.7) |
| Pyrococcus abyssi (pabys) | 2818 | 1765 | 807 (45.7) |
| Pyrococcus horikoshii (pyro) | 2524 | 2061 | 734 (35.6) |
| Thermoplasma acidophilum (tacid) | 2469 | 1478 | 713 (48.2) |
| Aquifex aeolicus (aqua) | 2574 | 2694 | 749 (27.8) |
| Borrelia burgdorferi (bbur) | 1467 | 1255 | 451 (35.9) |
| Bacillus halodurans (bhal) | 6314 | 4066 | 1768 (43.5) |
| Bacillus subtilis (bsub) | 6346 | 4100 | 1794 (43.8) |
| Buchnera sp. APS (buch) | 1208 | 574 | 372 (64.8) |
| Campylobacter jejuni (cjej) | 2715 | 1634 | 793 (48.5) |
| Chlamydophila pneumoniae (cpneu) | 1442 | 1052 | 434 (41.3) |
| Chlamydia trachomatis (ctra) | 1378 | 894 | 405 (45.3) |
| Chlamydia muridarum (ctraM) | 1406 | 909 | 422 (46.4) |
| Deinococcus radiodurans (drad) | 4454 | 3102 | 1282 (41.3) |
| Escherichia coli (ecoli) | 6922 | 4289 | 1997 (46.6) |
| Escherichia coli O157:H7 (ecoli_O157) | 7557 | 5349 | 2228 (41.7) |
| Haemophilus influenzae (hinf) | 2886 | 1709 | 860 (50.3) |
| Helicobacter pylori (hpyl) | 2211 | 1566 | 643 (41.1) |
| Lactococcus lactis (llact) | 3733 | 2266 | 1088 (48.0) |
| Mycoplasma genitalium (mgen) | 834 | 480 | 252 (52.5) |
| Mycoplasma pneumoniae (mpneu) | 944 | 688 | 283 (41.1) |
| Mycobacterium tuberculosis (mtub) | 6033 | 4066 | 1722 (42.4) |
| Neisseria meningitidis (nmen) | 2951 | 2025 | 853 (42.1) |
| Pseudomonas aeruginosa (paer) | 9238 | 5565 | 2659 (47.8) |
| Pasteurella multocida (pmul) | 3557 | 2014 | 1045 (51.9) |
| Rickettsia prowazekii (rpxx) | 1389 | 834 | 413 (49.5) |
| Synechocystis sp. PCC6803 (syne) | 4876 | 3167 | 1364 (43.1) |
| Thermotoga maritima (tmar) | 2998 | 1864 | 866 (46.5) |
| Treponema pallidum (tpal) | 1410 | 1031 | 402 (39.0) |
| Ureaplasma urealyticum (uure) | 947 | 611 | 290 (47.5) |
| Vibrio cholerae (vcho) | 5655 | 3828 | 1634 (42.7) |
| Xylella fastidiosa (xfas) | 3328 | 2831 | 971 (34.0) |
| Caenorhabditis elegans (cele) | 27 297 | 19 730 | 7408 (37.6) |
| Drosophila melanogaster (dmel) | 25 011 | 14 335 | 6345 (44.3) |
| Homo sapiens (huge) | 3760 | 1771 | 930 (52.5) |
| Saccharomyces cerevisiae (yst) | 9230 | 6305 | 2453 (38.9) |
| Bacteriophage T4 (t4) | 111 | 275 | 4 (16.4) |
| Total | 183 805 | 122 926 | 51 430 (41.8) |
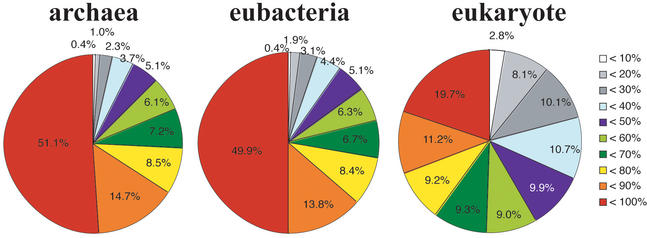
When each 3D structure of ORFs is checked in detail, one will find that only a few ORFs are fully modeled. Most 3D structure models are of parts of the ORFs, which are supposed to represent domains (Fig. 3). This situation is, however, different among superkingdoms. In archaea and eubacteria genomes, more than 50% of all ORFs have 3D structures for a more than 80% portion of their ORFs. On average, 71% of each ORF in archaea and 68% of each ORF in eubacteria are modeled. In eukaryotic genomes, however, less than 40% of ORFs have 3D structures for a more than 80% portion of their ORFs. On average, a 39% portion of each ORF is modeled. This is a consequence of the multi-domain structure of proteins in eukaryotes (15). Furthermore, it indicates that our knowledge of eukaryotic proteins is not sufficient to understand the whole structure of single proteins in eukaryotes. Knowledge of domain–domain interactions within single ORFs in eukaryotic proteins will be required soon. Even with X-ray crystallography, structural determination of an entire eukaryotic protein is a difficult task because of its large mass.
Figure 3.
Percentage of modeled portions of each ORF. Difference in coverage of ORFs by 3D structure is shown in different colors, as explained in the right side of the figure. White means less than 10% of an amino acid sequence, light gray means more than 10% but less than 20%, dark gray means more than 20% but less than 30% of an amino acid sequence, and likewise. In archaeal and eubacterial genomes, more than half of the ORFs are modeled at a more than 90% portion of the sequences. In eukaryotic genomes, however, less than 30% of the ORFs are modeled at a more than 90% portion of the sequences. This is because eukaryotic proteins have long amino acid sequences and multi-domain organization (15).
The superfamilies of modeled structures differ among the three superkingdoms (Table 2). The structures are classified based on the SCOP category (16). The most common model in all three superkingdoms is a P-loop protein. After the P-loop, the most common folds differ among each superkingdom. In eukaryotes, protein kinase, homeodomain and EGF/Laminin nuclear receptor models are included in the top ten entries, and all of these domains are known to diverge in eukaryotic genomes (17). This distribution is similar to that reported based on the whole genome protein fold assignment by Koonin et al. (18). Enlarged FAMSBASE provides coordinates of each protein within the superfamily and provides a chance to analyze the differences among proteins of the same superfamily.
Table 2. Top 10 most common 3D structures among the three superkingdoms of life.
| No. of models | Superfamily name |
|---|---|
| Archaea | |
| 2960 | P-loop containing nucleotide triphosphate hydrolases |
| 913 | 4Fe–4S ferredoxins |
| 828 | S-adenosyl-L-methionine-dependent methyltransferases |
| 699 | PLP-dependent transferases |
| 566 | NAD(P)-binding Rossmann-fold domains |
| 547 | Metallo-hydrolase/oxidoreductase |
| 433 | FAD/NAD-linked reductases, dimerisation (C-terminal) domain |
| 404 | Class II aaRS and biotin synthetases |
| 343 | Nucleotidylyl transferase |
| 339 | Nucleotide-diphospho-sugar transferases |
| Eubacteria | |
| 11 387 | P-loop containing nucleotide triphosphate hydrolases |
| 3718 | NAD(P)-binding Rossmann-fold domains |
| 2837 | CheY-like |
| 2805 | S-adenosyl-L-methionine-dependent methyltransferases |
| 2699 | PLP-dependent transferases |
| 2066 | Periplasmic binding protein-like II |
| 1790 | Thioredoxin-like |
| 1639 | alpha/beta-Hydrolases |
| 1553 | FAD/NAD-linked reductases, dimerisation (C-terminal) domain |
| 1414 | Class II aaRS and biotin synthetases |
| Eukaryote | |
| 5203 | P-loop containing nucleotide triphosphate hydrolases |
| 4601 | Protein kinase-like (PK-like) |
| 2910 | C2H2 and C2HC zinc fingers |
| 1842 | EGF/Laminin |
| 1487 | alpha/beta-Hydrolases |
| 1418 | RNA-binding domain, RBD |
| 1365 | NAD(P)-binding Rossmann-fold domains |
| 1312 | Thioredoxin-like |
| 1303 | Nuclear receptor ligand-binding domain |
| 1149 | Homeodomain-like |
ACCURACY OF THE MODELS
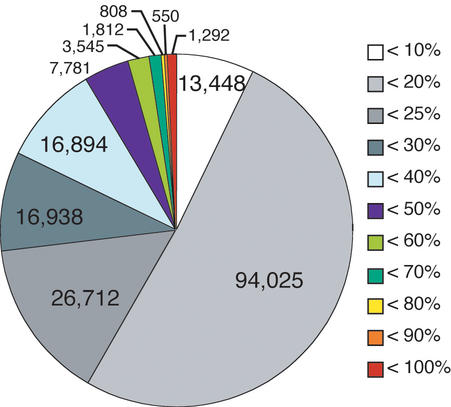
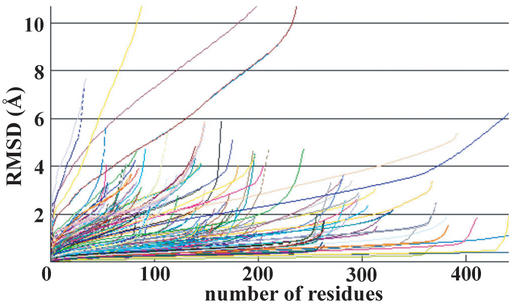
The accuracy of modeled structures is known to depend on the level of sequence identity between target and modeled proteins (19). The distribution of sequence identities in enlarged FAMSBASE is given in Figure 4. About a quarter of all models have more than 25% sequence identity. The reliability of the models is expressed by Hubbard plots (20) (Fig. 5). Since building the current enlarged FAMSBASE, the 3D structures of some target proteins have been determined. Comparison of the models in enlarged FAMSBASE with the real 3D structures is, therefore, a good blind test. When sequence identity is more than 25%, the model is reasonably good, with the exception of a few cases. Of the 212 tested models, 181 (85%) have RMSD (root mean square deviation) less than 3.0 Å through at least 90% of the entire structure.
Figure 4.
Identity distribution between target and template sequences in enlarged FAMSBASE. Sequence identities are shown by color, as explained on the right side of the figure. White means template and target sequences have less than 10% sequence identity, light gray means between 10 and 20%, and likewise. Models with less than 20% sequence identity occupy about half of the database. Structural genomics projects are expected to provide better templates for genome-wide comparative modeling.
Figure 5.
Hubbard plots of 212 modeled 3D structures and real structures with sequence identity of more than 25%. The 3D structures of 212 proteins were determined after building enlarged FAMSBASE. The horizontal axis is the number of superimposed residues and the vertical axis is the best root mean square deviation given by the number of superimposed residues. A precise 3D model has a small RMSD for superimposition of many residues. An unreliable 3D model has a large RMSD for superimposition of a few residues. See reference 20 for detail.
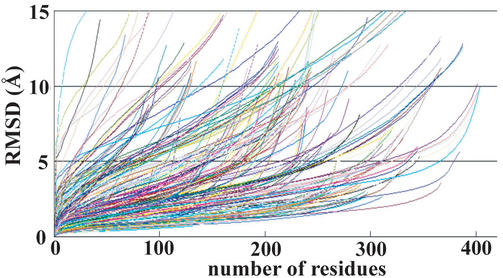
About 75% of the models in enlarged FAMSBASE have less than 25% sequence identity. Even with models based on low sequence identity, appropriate analysis can be performed (19,21). In one case, a homology model based on an alignment of less than 18% sequence identity yielded a significant biological result (22). Hubbard plots between the modeled protein 3D structures in enlarged FAMSBASE and the real target 3D structures, reported after building FAMSBASE and showing less than 25% sequence identity, are shown in Figure 6. Of 237 examined models, 73 (31%) have RMSD less than 3.0 Å through at least 90% of the entire structure. The blind test suggests that at least 31% of the modeled structures with sequence identity less than 25%, that is 37 428 out of 120 737 modeled structures, were reasonably accurate.
Figure 6.
Hubbard plots of modeled 3D structures and real structures with sequence identity less than 25%. The 3D structures of 237 proteins were determined after building enlarged FAMSBASE.
Even with FAMS, protein 3D structures derived from only about 42% of ORFs were modeled. To generate protein 3D models of the entire ORF encoded in a genome, two efforts are underway. One is to let structural genomics projects solve protein structures that can be used as templates for a wide range of proteins. The other is to further improve the method of homology modeling to enable researchers to build highly reliable model structures based on a template of less than 20% sequence identity. With both efforts, the information from genome sequences will begin to be used for biologically important issues, such as functional site analyses, ligand docking and protein–protein interactions.
FUTURE DIRECTIONS
FAMSBASE will be expanded by increasing the number of genomes with protein 3D structures.
Acknowledgments
ACKNOWLEDGEMENTS
This work was supported by a Grant-in-Aid for Scientific Research on Priority Area (C), Genome Information Science from the Ministry of Education, Culture, Sports, Science and Technology of Japan. The authors are grateful to Dr. Ken Nishikawa of NIG for the gift of genome sequence information of 41 species processed through PSI-BLAST analysis against amino acid sequences of proteins in PDB.
REFERENCES
- 1.Nierman W.C., Eisen,J.A., Fleischmann,R.D. and Fraser,C.M. (2000) Genome data: what do we learn? Curr. Opin. Struct. Biol., 10, 343–348. [DOI] [PubMed] [Google Scholar]
- 2.Kim S.-H. (2000) Structural genomics of microbes: an objective. Curr. Opin. Struct. Biol., 10, 380–383. [DOI] [PubMed] [Google Scholar]
- 3.Searls D.B. (2000) Bioinformatics tools for whole genomes. Annu. Rev. Genomics Hum. Genet., 1, 251–279. [DOI] [PubMed] [Google Scholar]
- 4.Domingues F.S., Koppensteiner,W.A. and Sippl,M.J. (2000) The role of protein structure in genomics. FEBS Lett., 476, 98–102. [DOI] [PubMed] [Google Scholar]
- 5.Brenner S.E. (2001) A tour of structural genomics. Nature Rev. Genet., 2, 801–809. [DOI] [PubMed] [Google Scholar]
- 6.Ebisawa K., Iwadate,M., Takeda-Shitaka,M., Kurihara,Y., Ishii,T., Ota, M., Kawabata,T., Nishikawa,K., Mitsuhashi,M., Oyama,A., Asogawa,M., Yanagida,S., Okumura,C., Sugio,S., Matsuzaki,T., Takahashi,M., Suzuki,E., Tanimura,R., Aoki,T., Saito,S. and Umeyama,H. (2000) 3D–1D modeling of all proteins encoded in the genome. Research and Development for Accelerating the Construction of the Infrastructure for Biological Resource Information (Bio-informatics), April 1999 to March 2000. Japan Bio-industry Association Foundation, Tokyo, Japan, pp. 633–666.
- 7.Ebisawa K., Iwadate,M., Takeda-Shitaka,M., Kurihara,Y., Ishii,T., Ota,M., Kawabata,T., Nishikawa,K., Mitsuhashi,M., Oyama,A., Asogawa,M., Yanagida,S., Okumura,C., Sugio,S., Matsuzaki,T., Takahashi,M., Suzuki,E., Tanimura,R., Aoki,T., Saito,S. and Umeyama,H. (2000) FAMSBASE: construction of model data base by homology analysis and full automatic comparative modeling for all ORFs of Escherichia coli and Bacillus subtilis. 28th Symposium on Structure–Activity Relationships, Pharmaceutical Society of Japan. October 26–27, Kyoto, Japan, pp. 222–225, 343.
- 8.Kawabata T., Fukuchi,S., Homma,K., Ota,M., Araki,J., Ito,T., Ichiyoshi,N. and Nishikawa,K. (2002) GTOP: a database of protein structures predicted from genome sequences. Nucleic Acids Res., 30, 294–298. [DOI] [PMC free article] [PubMed] [Google Scholar]
- 9.Altschul S.F., Madden,T.L., Schaffer,A.A., Zhang,J., Zhang,Z., Miller,W. and Lipman,D.J. (1997) Gapped BLAST and PSI-BLAST: a new generation of protein database search programs. Nucleic Acids Res., 25, 3389–3402. [DOI] [PMC free article] [PubMed] [Google Scholar]
- 10.Berman H.M., Westbrook,J., Feng,Z., Gilliland,G., Bhat,T.N., Weissig,H., Shindyalov,I.N. and Bourne,P.E. (2000) The Protein Data Bank. Nucleic Acids Res., 28, 235–242. [DOI] [PMC free article] [PubMed] [Google Scholar]
- 11.Ogata K. and Umeyama,H. (2000) An automatic homology modeling method consisting of database searches and simulated annealing. J. Mol. Graph. Model., 18, 258–272. [DOI] [PubMed] [Google Scholar]
- 12.Iwadate M., Ebisawa,K. and Umeyama,H. (2001) Comparative Modeling of CAFASP2 competition. Chem-Bio Informatics J., 1, 136–148. [Google Scholar]
- 13.Fischer D., Elofsson,A., Rychlewski,L., Pazos,F., Valencia,A., Rost,B., Ortiz,A.R. and Dunbrack,R.L.Jr (2001) CAFASP2: The second critical assessment of fully automated structure prediction methods. Proteins, 5 (Suppl.), 171–183. [DOI] [PubMed] [Google Scholar]
- 14.Pearson W.R. and Lipman,D.J. (1988) Improved tools for biological sequence comparison. Proc. Natl Acad. Sci. USA, 85, 2444–2448. [DOI] [PMC free article] [PubMed] [Google Scholar]
- 15.International Human Genome Sequencing Consortium (2001) Initial sequencing and analysis of the human genome. Nature, 409, 860–921. [DOI] [PubMed] [Google Scholar]
- 16.Lo Conte L., Brenner,S.E., Hubbard,T.J., Chothia,C. and Murzin,A.G. (2002) SCOP database in 2002: refinements accommodate structural genomics. Nucleic Acids Res., 30, 264–267. [DOI] [PMC free article] [PubMed] [Google Scholar]
- 17.Ponting C.P., Schultz,J.,Copley,R.R., Andrade,M.A. and Bork,P. (2000) Evolution of domain families. Adv. Protein Chem., 54, 185–244. [DOI] [PubMed] [Google Scholar]
- 18.Koonin E.V., Wolf,Y.I. and Aravind,L. (2000) Protein Fold recognition using sequence profiles and its application in structural genomics. Adv. Protein Chem., 54, 245–275. [DOI] [PubMed] [Google Scholar]
- 19.Baker D. and Sali,A. (2001) Protein structure prediction and structural genomics. Science, 294, 93–96. [DOI] [PubMed] [Google Scholar]
- 20.Hubbard T.J. (1999) RMS/coverage graphs: a qualitative method for comparing three-dimensional protein structure predictions. Proteins: Struct. Func. Genet., 3 (Suppl.), 15–21. [DOI] [PubMed] [Google Scholar]
- 21.Irving J.A., Whisstock,J.C. and Lesk,A.M. (2001) Protein structural alignments and functional genomics. Proteins, 42, 378–382. [DOI] [PubMed] [Google Scholar]
- 22.Smith B.J., Lawrence,M.C. and Colman,P.M. (2002) Modelling the structure of the fusion protein from human respiratory syncytial virus. Protein Eng., 15, 365–371. [DOI] [PubMed] [Google Scholar]


