Abstract
It is generally accepted that living jawless vertebrates (lampreys and hagfishes) lack the capability of mounting an adaptive immune response. At the same time, however, there are reports describing histological evidence for the presence in agnathan tissues of lymphocytes, the key players in adaptive immunity. The question therefore arises whether the cells identified morphologically as lymphocytes are true lymphocytes in terms of their genetic developmental program. In this study, evidence is provided that the lampreys express a member of the purine box 1 (PU.1)/spleen focus-forming virus integration B (Spi-B) gene family known to be critically and specifically involved in the differentiation of lymphocytes in jawed vertebrates. The lamprey gene is expressed in the lymphocyte-like cells of the digestive tract and inexplicably also in the ovary.
The immune response of vertebrates has two arms, the adaptive and the nonadaptive (1). The adaptive response is effected by lymphocytes that express antigen-specific receptors on their surfaces, either the B cell (Ig) or the T cell receptors. The latter recognize peptides presented to them by molecules encoded in the MHC genes. Ig, T cell receptors, and MHC molecules are known only from jawed vertebrates (Gnathostomata); all efforts to isolate them or clone the encoding genes in jawless vertebrates (Agnatha), the lampreys and the hagfish, have failed (2). On the strength of this negative evidence, it is generally accepted that jawless vertebrates lack an adaptive immune system. However, this conclusion seems to be contradicted by the presence of cells in both the lamprey and the hagfish that morphologically resemble lymphocytes of jawed vertebrates (3–5). The agnathan lymphocyte-like cells are mainly accumulated in the subepithelial layers of the digestive tract and in the branchial arches (3–5). In the lamprey, the branchial accumulations of lymphocyte-like cells have even been referred to as the “thymus,” a designation otherwise reserved for the organ of gnathostome T lymphocyte development (6, 7). The question therefore arises: Are the lymphocyte-like cells of the agnathans genetically related to lymphocytes or is the morphological similarity the result of evolutionary convergence?
Gnathostome lymphocytes are known to arise from pluripotential hemopoietic stem cells in a genetically programmed sequence of transformations, each step involving a specific combination of transcription factors (8). Some of the transcription factors are also involved in the differentiation of other cell types, whereas others appear to be restricted largely to the lymphocyte differentiation pathway (9). Prominent in the latter category are three related transcription factors, Spi-1 (=PU.1; refs. 10 and 11), Spi-B (12), and Spi-C (13). All three factors are members of the E26 transformation-specific (Ets) family of ∼45 proteins characterized by the possession of the Ets DNA-binding domain in the C-terminal part of the molecule (14). The ≈85 residues of the domain interact with DNA sequences containing the purine-rich core motif 5′-GAGGAA-3′, the PU box. The Spi-1 and Spi-B proteins show low sequence similarity to each other throughout their entire length (12), whereas the Spi-C protein has significant sequence similarity to the Spi-1 and Spi-B proteins (as well as to other members of the Ets family) in the DNA-binding domain, but not outside of this region (13). The Spi-1 and Spi-B proteins share two other domains, the glutamine-rich domain in the N-terminal half and the PEST (proline, glutamic acid, serine, and threonine-rich) domain in the center. The glutamine-rich domain and several acidic residues in the N-terminal half of the protein are necessary for trans-activation (15), whereas the PEST domain is involved in protein–protein interaction (16).
The expression of Spi-1 is relatively widespread in hemopoietic cells and includes progenitor cells as well as myeloid (granulocyte, monocyte, and osteoclast) and lymphoid (B and immature T lymphocyte) lineages (11, 12, 17–20). The expression of Spi-B appears to be restricted to lymphoid cells with high levels found in B cells and low levels in T cell progenitors (12, 18, 19). A high level of the Spi-C protein has been found in mature B cells and lower levels in macrophages (13). The Spi genes appeared therefore to be good markers for testing whether the agnathan lymphocyte-like cells are genetically related to gnathostome lymphocytes. The aim of the present study was to determine whether homologs of these genes are present in the lamprey and, if so, in what cells they are expressed. To obtain a better understanding of their evolution, Spi genes of a bony fish, an amphibian, and a reptile were also characterized.
Materials and Methods
Animals and RNA/DNA Sources.
Two species of lamprey were used, ammocoetes larvae and adults of the sea lamprey, Petromyzon marinus, from Lakes Huron and Champlain in the United States, and juveniles of freshwater lampreys, Lampetra fluviatilis, from the Rhine River near Karlsruhe, Germany. For comparison, one bony fish and two tetrapod species were also included in the study, the cichlid Aulonocara hansbaenschi, the smooth-fronted caiman, Paleosuchus palpebrosus, and the African clawed toad, Xenopus laevis. Four cDNA libraries were used. The total RNA for their construction was isolated from the gut of P. marinus larva (21), the spleen and hepatopancreas of a cichlid fish (22), the whole jaws of a 3-day-old caiman (23), and the jaws of the clawed toad (23). Genomic DNAs were isolated from the liver of P. marinus and L. fluviatilis by the phenol-chloroform extraction method.
PCR Amplification.
Conditions of the PCR were described in an earlier publication (24). Partial coding sequences were obtained from the cDNA libraries using primers based on conserved regions of Spi genes in combination with vector anchor primers. The complete coding sequences could then be obtained using primers based on the partial fragments. The lamprey Spi primer was PU-G6 (5′-AACTGGTAGGTBAGCTTCTTCTT-3′); the fish Spi-1 and Spi-C primers were PS-G3 (5′-GNGCCAKCTTCTGATAGGTCAT-3′) and SB-G1 (5′-CTTGCGGTTSCCCTTCTGCTG-3′), respectively; the toad Spi-B primer was PS-G1 (5′-TTCCAGTTCTCSTCSAAGCACAA-3′); and the caiman Spi-1 and Spi-B primers were PU-G2 (5′-ATGTCCAGVAGGAACTGRTACAG-3′) and SPB-T2 (5′-TTTTCTGGTAGGTCATTTTCTTGC-3′), respectively. Cloning and sequencing were carried out as described earlier (24).
In Situ Hybridization.
The animals were killed and cut at ≈1-cm intervals. The tissue blocks thus obtained were fixed in 4% paraformaldehyde in PBS and embedded in paraffin. Tissue blocks were cut transversally and mounted on glass slides coated with chrome alum (Serva) or on SuperFrost Plus slides (Schutt Labortechnik). A 35S-labeled antisense RNA probe was generated by using T7 RNA polymerase according to the manufacturer's (Roche Molecular Biochemicals) specifications. For the probe preparation, the 393-bp lamprey Spi cDNA insert, covering exons 1, 2, 3, and part of exon 4, was used. For control experiments, sense RNA was generated from the same cDNA insert by using SP6 RNA polymerase. Prehybridization, hybridization, and washing procedures were as described previously (25). For autoradiography, slides were dipped into the NTB-2 emulsion (Kodak). Sections were exposed for up to 4 wk, developed in D-19 solution (Kodak), and stained with Giemsa. Photomicrographs were taken with a Zeiss microscope using bright-field and phase-contrast optics with a polarizing filter. In parallel experiments, paraffin sections were stained with hematoxylin and eosin by standard methods.
Data Analysis.
Nucleotide and protein sequences were aligned with the aid of the SeqPup (ref. 26: University of Indiana, Bloomington, http://iubio.bio.indiana.edu/soft/molbio), the GenDoc (ref. 27: Pittsburg Supercomputing Center, Pittsburg, www.cris.com/~ketchup/genedoc.shtml), or the Clustal W (28) computer programs. blast searches (29) of protein databases were used to identify the most closely related outgroup sequence, the human ELF5 (E74-like factor 5) transcription factor. Phylogenetic reconstructions were made using the neighbor-joining method (30) of the mega program (31) based on distances derived from the proportion of identical amino acids following omission of gapped sites.
Results and Discussion
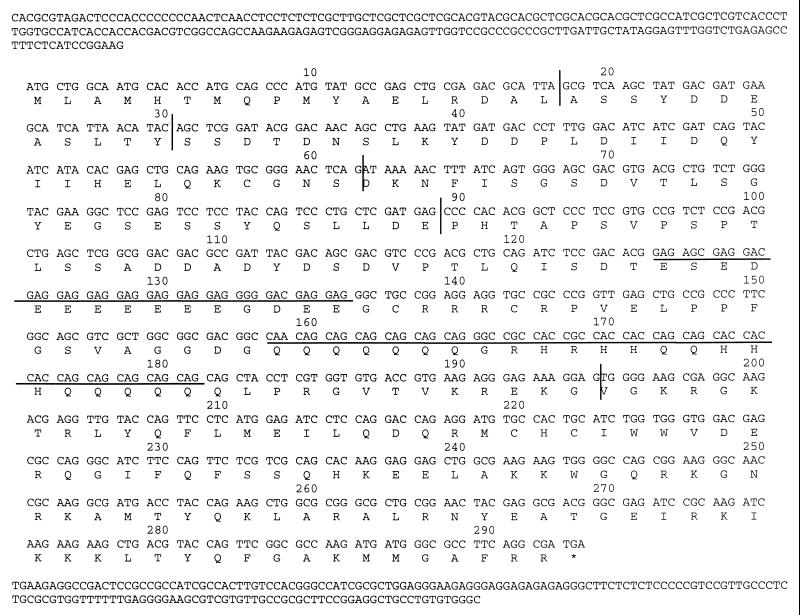
The lamprey cDNA sequence is 1,272 bp long and contains an ORF for 293 amino acid residues (AAR) beginning with the translation start site at 224 bp (Fig. 1). The stop codon at 1,105 bp is followed by a 3′ untranslated region (UTR) of 167 bp, which however seems to lack the polyadenylation signal. The cichlid Spi-1 cDNA sequence is 2,663 bp long and contains an ORF for 264 AAR beginning with the translation start site at 303 bp. The stop codon at 1,095 bp is followed by a 3′ UTR of 1,566 bp with the putative polyadenylation signal AATAAA at 2,655 bp. The cichlid Spi-C cDNA sequence is 1,723 bp long and contains an ORF for 264 AAR. The stop codon at 794 bp is followed by a 3′ UTR of 927 bp; however, this clone seems to lack the translation start site and the putative polyadenylation signal. The toad Spi-B cDNA sequence is 1,446 bp long and contains an ORF for 281 AAR beginning with the translation start site at 49 bp. The stop codon at 892 bp is followed by a 3′ UTR of 552 bp, which seems to lack a polyadenylation signal, however. The caiman Spi-1 cDNA sequence is 1,497 bp long and contains an ORF for 266 AAR beginning with the translation start site at 207 bp. The stop codon at 1,005 bp is followed by a 3′ UTR of 490 bp with the putative polyadenylation signal AATAAA at 1,485 bp. The caiman Spi-B cDNA sequence is 1,563 bp long and contains an ORF for 266 AAR beginning with the translation start site at 40 bp. The stop codon at 835 bp is followed by a 3′ UTR of 726 bp with the putative polyadenylation signal AATAAA at 1,540 bp.
Figure 1.
Nucleotide sequence of the lamprey Spi gene. Numbering shows codon positions. The coding region is displayed by codons and its translation is given in the single-letter amino acid code. The underlined nucleotide regions show the two repeats, one consisting of glutamic acid and the other of glutamine and histidine residues. Vertical lines indicate exon borders.
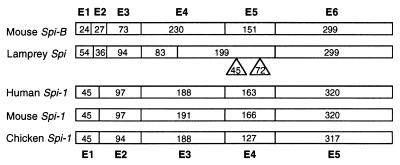
To determine the exon–intron organization of the lamprey Spi gene, a series of primer pairs corresponding to stretches spaced at short intervals along the cDNA sequence was used. The products obtained by PCR amplification of lamprey genomic DNA with these primers were partially sequenced and the exon–intron borders assigned by comparison with the cDNA sequence (Fig. 1). Like the mouse and human Spi-B genes (32, 33), the lamprey homolog has six exons separated by five introns (Fig. 2). Of these, however, only exon 6 has the same length in the three species. Lamprey exon 4 is much shorter and lamprey exon 5 is longer than the corresponding mouse and human elements; the remaining three lamprey exons are longer than their mouse and human counterparts. The phases of introns 1 through 5 of the lamprey gene are the same as those of the mammalian Spi-B genes (0, 0, 1, 0, 1, respectively).
Figure 2.
Comparison of the exon-intron organization of lamprey, human (32), mouse (33, 44), and fowl (chicken; ref. 45) Spi genes. Boxed regions show exons (E) and numbers inside the boxes exon sizes in bp. The inserts in the lamprey Spi sequence indicate two repeat regions, one consisting of glutamic acid and the other of glutamine and histidine residues.
A unique feature of the lamprey gene is the presence of two repetitive sequences in exon 5. One sequence is 45 bp long and consists of 11 glutamic acid GAG codons interspersed with glycine GGC, aspartic acid GAC, and serine AGC codons. The second sequence lies 66 bp downstream, is 72 bp long, and consists of 15 glutamine CAG codons interspersed with 6 histidine CAC and some arginine CGC and glycine GGC codons. Both repeats may be microsatellite derived. Structural predictions suggest that the peptide specified by both repeats forms an α-helix. The function of the repeats is unclear, but since similar sequences are also present in a related species (L. fluviatilis, data not shown) and in unrelated genes of other metazoans (34–36), they do not seem to be without function. Possibly the glutamine-rich repeat is analogous to a glutamine-rich region found in exon 3 of Spi-1 genes and used in transactivation of Spi-1 (37).
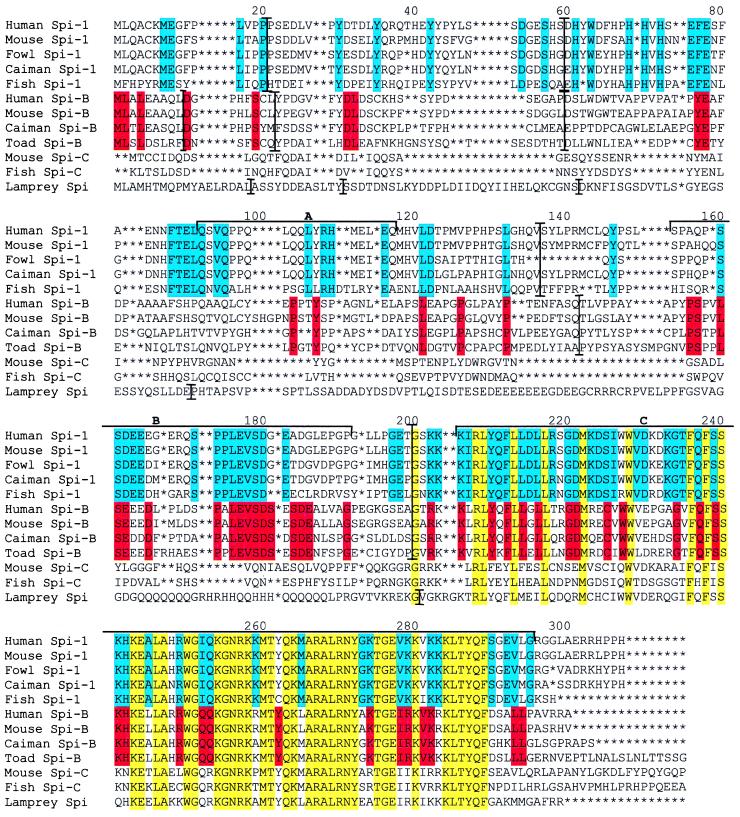
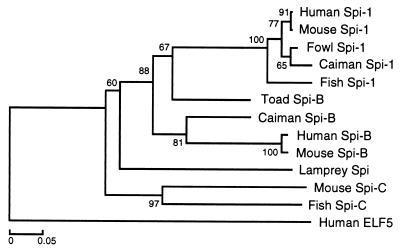
Sequence similarity of the lamprey Spi to mammalian Spi-B and Spi-1 proteins is limited to the Ets domain encoded in the last exon of the gene (Fig. 3). The dissimilarity of the non-Ets part could mean either that the cloned gene is not Spi or that the gene's upstream part evolves under low selection pressure and at a rapid evolutionary rate. It was the desire to test this latter possibility that led us to extend the study to Spi sequences of species from other vertebrate classes. If the non-Ets part is evolving rapidly, clear evidence for an increased evolutionary rate should be found by comparing Spi sequences from classes separated by progressively longer divergence times. This expectation has indeed been borne out by the comparison of the mammalian, reptilian, amphibian, and bony fish sequences. The human-mouse, mammalian-reptile, and amphibian-tetrapod Spi-B protein sequences are 78%, 44%, and 38% identical, respectively. Dramatic decrease in Spi-B sequence similarity is also reflected in the number of insertion/deletions (indels) required for optimal alignments. The human-mouse, caiman-mammal, and toad-mammal comparisons require the introduction of 2, 10, and 15 indels into the alignments, respectively. All of the 15 indels are in the non-Ets part. Given the considerably longer divergence times of agnathans from tetrapods in comparison to divergence times within tetrapods, the low similarity levels found (10%) are to be expected. The rapid divergence of the non-Ets part appears to be a characteristic of the Spi-B proteins; the Spi-1 sequences, by contrast, retain much of their similarity over long evolutionary periods. The human-mouse, mammal-caiman, and fish-tetrapod sequences are 85%, 74%, and 41% identical, respectively. Similarly, only four indels are required to align all of the tetrapod sequences used. The Spi-C sequences, however, are only 28% identical between fish and mouse in the non-Ets region. The rapid evolution of the Spi-B protein is also reflected in the phylogenetic tree in Fig. 4, in which the branch lengths within the Spi-1 cluster are shorter than those within the Spi-B cluster. The difference in evolutionary rates probably influences the placement of the lamprey and toad sequences and is responsible for the difficulty in rooting the divergence between the Spi-1 and Spi-B lineages.
Figure 3.
Amino acid alignment (GenBank accession codes) of human (X66079), mouse (U87614-20), caiman (AF247364), and toad (AF247365) Spi-B sequences, human (X52056), mouse (M32370), fowl (Y12225), caiman (AF247363), and fish (AF247366) Spi-1 sequences, as well as the sea lamprey (AF247362) Spi, and the mouse (AF098863) and fish (AF247367) Spi-C sequences. An asterisk indicates an alignment gap. The mouse and fish Spi-C sequences have an extended carboxyl terminus; the final AAR (numbering 22 and 45, respectively) are not shown. The coloring groups AAR conserved in Spi-1 (blue), Spi-B (red), or all sequences (yellow). Numbers indicate alignment positions. The relationship found in the conserved final exon was used as a guide tree for the clustal alignment of the complete sequence. The location of known domains within the mouse Spi-1 sequence are indicated with solid horizontal lines: A is the glutamine-rich transactivation domain; B is the PEST domain; and C is the Ets domain.
Figure 4.
Phylogenetic tree of sequences shown in Fig. 3. The tree is based on the alignment of the conserved DNA-binding domain encoded by the last exon of the Spi sequences. Genetic distances were measured from the proportion of amino acid identity of the aligned sequences and the tree was drawn by using the neighbor-joining method of Saitou and Nei (30). The human ELF5 sequence is taken as an outgroup. Numbers above each node indicate the percentage recovery of that node in 500 bootstrap replications.
Although the non-Ets part is not highly conserved, there are some conserved residues that are shared between the lamprey protein and other Spi-family members. At position 22 of the alignment (Fig. 3), Spi-B and -C family members have a Y or F, the lamprey sequence a Y, whereas the Spi-1 group has S or T residues. At position 24, all Spi sequences have a D or E (D in lamprey) and again at position 33, D or E is found (except for Spi-C sequences which contain an indel). At position 68, a conserved H is found in Spi-1, an A or G in Spi-B (G in the lamprey), whereas Spi-C has none of these residues. At position 77, F is found in Spi-1 sequences and Y in Spi-B and Spi-C (lamprey has Y). A P residue is found in all Spi-B sequences and in lamprey at position 104. At position 121, the lamprey protein shares an L residue with all Spi-1 and Spi-B sequences.
The lamprey Spi sequence also contains regions in the non-Ets part that may be equivalent functionally to the domains of the mammalian proteins. Thus, there are serine residues at positions 20, 21, 27, 31, 32, 107, 108, 116, and 124 in the lamprey sequence, some of which may represent the phosphorylation sites for kinases, corresponding to those in the mammalian Spi proteins (38). Similarly, although no PEST domain (16) as such can be identified in the lamprey sequence, a region rich in glutamic acid residues is present at positions 126–141. Finally, the inserted repeat at positions 164–188 contains numerous glutamine residues which may carry out a function equivalent to that of the glutamine-rich domain in the mammalian Spi proteins (15).
The lamprey Ets domain shows the highest (and approximately equal) sequence similarity with the corresponding gnathostome Spi-1 and Spi-B domains. Its similarity to the human Spi-1 (12) and Spi-B (32) sequences is 62.2% and 64.3%, respectively. Similarly, phylogenetic analysis places the lamprey sequence in a cluster of the gnathostome Spi-1 and Spi-B sequences apart from all of the other members of the Ets family (Fig. 4). In the cluster, the lamprey sequence assumes an outgroup position.
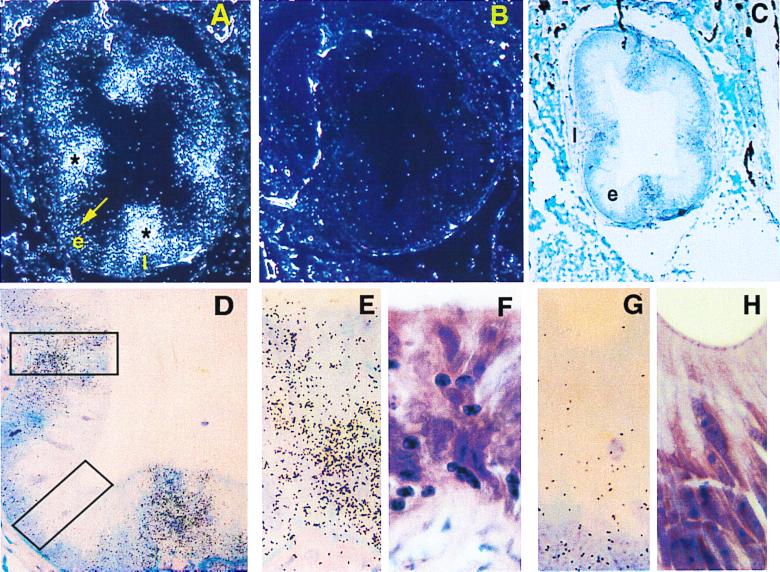
To identify the main sites of expression of the lamprey Spi gene, a series of paraffin sections was prepared from different body parts of premetamorphosing ammocoetes in stage III (sea lamprey) or stage IV (freshwater lamprey) of development in the classification of Ardavin et al. (39). The sections were then subjected to in situ hybridization with a lamprey antisense Spi probe. Strong expression of the Spi gene was observed in the gut epithelium, particularly in the parts overlaying and opposite to the typhlosole (“spiral valve,” Fig. 5), and in the ovary (data not shown). Weaker expression was detected in the skin epithelium and the opisthonephros. The signal in the gut epithelium was particularly strong in the pharyngeal region (the epi- and hypopharyngeal folds), the esophagus, and the intestinal region. It emanated from cells which on hematoxylin/eosin-stained preparations had lymphocyte morphology (Fig. 5). They presumably represent lymphocyte-like cells invading the epithelia. In the ovary, the signal appears to originate in the cytoplasm of the oocytes and in some preparations also from the surrounding cells. Shared expression between hemopoietic tissue and gonads has been reported for several genes (e.g., refs. 40–42); its significance is obscure.
Figure 5.
Transverse section through the esophageal region of P. marinus larva. Strong hybridization signals (asterisks) are seen inside the esophageal epithelium (e) in the area of lamina propria (l) folds. Weaker hybridization signals (arrow) are seen in other areas of the esophageal epithelium. (A) Dark-field (original magnification ×100). (B) Dark-field, negative control (original magnification ×100). (C and D) Bright-field illumination (original magnifications ×100 and ×400, respectively). Dark spots represent hybridization signals. Areas of strong hybridization signals under bright-field illumination (E) colocalize with areas of high lymphocyte densities under hematoxylin and eosin staining (F and upper rectangle in D). Areas of weak hybridization signals (G) colocalize with areas of low lymphocyte densities (H and lower rectangle in D). (Original magnification: E–H, ×1000.)
The Ets is a large family of genes of which only three members (Spi-1, Spi-B, and Spi-C) are known to be involved in lymphopoiesis (8, 9, 14). For the purpose of the present study, it is therefore critical to establish that the lamprey gene is Spi rather than some other member of the family. Four observations support the Spi identity of the lamprey gene. First, exon 6, which is the only part of the gene conserved among the Ets family members, has the highest sequence similarity with the mammalian Spi-1, Spi-B pair, and on phylogenetic analysis, the exon 6-encoded domain of the lamprey protein clusters with the corresponding gnathostome Spi-encoded domains (Fig. 4). Second, the exon–intron organization of the lamprey gene resembles most closely that of the Spi-1 and Spi-B genes of all of the Ets members (Fig. 2). (The other members generally have eight, nine, or more exons.) Third, the conserved exon 6 has a size within the variation found in Spi-1 and Spi-B; more marked variation (up to 20 residues) in exon 6 length occurs among the other Ets family members. (It can also be argued that the expression pattern of the lamprey Spi gene is additional evidence for its identity, but there would be certain circularity in such a reasoning.) Fourth, Southern blot analysis indicates that the lamprey Ets domain-encoding segment hybridizes with only two or three restriction fragments and hence that it is not promiscuously associated with multiple loci (data not shown).
The expression of the lamprey Spi gene in the lymphocyte-like cells supports the notion that these cells, previously identified only by their morphological appearance, are indeed related to the lymphocytes of jawed vertebrates ontogenetically. Further support for this notion is provided by the observation that two other transcription factors, members of the Ikaros family primarily involved in lymphopoiesis (43), are also present in the lamprey and show a similar expression pattern to the Spi gene (W. E. Mayer, J.T., C.O., and M.S.-B., in preparation). These observations reopen the issue of the presence or absence of adaptive immune response in jawless vertebrates.
Acknowledgments
We thank Ms. Jane Kraushaar for editorial and Ms. Asja Miletic for technical assistance; John Gershmehl of the U.S. Fish and Wildlife Service (Essex Junction, Vermont), as well as Dr. James G. Seeley and his team from the U.S. Fish and Wildlife Service (Hammond Bay Biological Station, Millesburg, MI) for samples of P. marinus from Lakes Champlain and Huron, respectively; and Jürgen Hirt from the Naturkunde Museum (Karlsruhe, Germany) for samples of L. fluviatilis.
Abbreviations
- Ets
E26 transformation specific
- AAR
amino acid residue
- indel
insertion/deletion
- PU
purine box
- Spi
spleen focus-forming virus integration (site)
- UTR
untranslated region
Footnotes
This paper was submitted directly (Track II) to the PNAS office.
See commentary on page 6924.
Article published online before print: Proc. Natl. Acad. Sci. USA, 10.1073/pnas.110505597.
Article and publication date are at www.pnas.org/cgi/doi/10.1073/pnas.110505597
References
- 1.Klein J, Hořejší V. Immunology. 2nd Ed. Oxford: Blackwell Scientific; 1998. [Google Scholar]
- 2.Klein J, Sato A, Mayer W E. In: The Major Histocompatibility Complex: Evolution, Structure, and Function. Kasahara M, editor. Tokyo: Springer; 1999. pp. 3–26. [Google Scholar]
- 3.Cohen N. In: The Lymphocyte Structure and Function. Marchalonis J J, editor. New York: Marcel Dekker; 1977. pp. 149–202. [Google Scholar]
- 4.Marchalonis J J. Immunity in Evolution. London: Arnold; 1977. [Google Scholar]
- 5.Kampmeier O F. Evolution and Comparative Morphology of the Lymphatic System. Springfield, IL: Thomas; 1969. [Google Scholar]
- 6.Finstad, J., Papermaster, B. & Good, R. A. Lab. Invest.13, 490–512. [PubMed]
- 7.Good R A, Finstad J, Litman J. In: The Biology of Lampreys. Hardisty M W, Potter I C, editors. Vol. 2. London: Academic; 1972. pp. 405–432. [Google Scholar]
- 8.Bonifer C, Faust N, Geiger H, Müller A M. Immunol Today. 1998;236:236–241. doi: 10.1016/s0167-5699(98)01259-6. [DOI] [PubMed] [Google Scholar]
- 9.Clevers H C, Grosschedl R. Immunol Today. 1996;17:336–343. doi: 10.1016/0167-5699(96)10019-0. [DOI] [PubMed] [Google Scholar]
- 10.Moreau-Gachelin F, Tavitian A, Tamobourin P. Nature (London) 1988;331:277–280. doi: 10.1038/331277a0. [DOI] [PubMed] [Google Scholar]
- 11.Klemsz M J, McKercher S R, Celada A, Van Beveren C, Maki R A. Cell. 1990;61:113–124. doi: 10.1016/0092-8674(90)90219-5. [DOI] [PubMed] [Google Scholar]
- 12.Ray D, Bosselut R, Ghysdael J, Mattei M-G, Tavitian A, Moreau-Gachelin F. Mol Cell Biol. 1992;12:4297–4304. doi: 10.1128/mcb.12.10.4297. [DOI] [PMC free article] [PubMed] [Google Scholar]
- 13.Bemark M, Martensson A, Liberg D, Leanderson T. J Biol Chem. 1999;274:10259–10267. doi: 10.1074/jbc.274.15.10259. [DOI] [PubMed] [Google Scholar]
- 14.Sharrocks A D, Brown A L, Ling Y, Yates P R. Int J Biochem Cell Biol. 1997;29:1371–1387. doi: 10.1016/s1357-2725(97)00086-1. [DOI] [PubMed] [Google Scholar]
- 15.Klemsz M J, Maki R A. Mol Cell Biol. 1996;16:390–397. doi: 10.1128/mcb.16.1.390. [DOI] [PMC free article] [PubMed] [Google Scholar]
- 16.Pongubala J M R, Van Beveran C, Nagulapalli S, Klemsz M J, McKercher S R, Maki R A, Atchison M L. Science. 1993;259:1622–1625. doi: 10.1126/science.8456286. [DOI] [PubMed] [Google Scholar]
- 17.Voso M T, Burn T C, Wulf G, Lim B, Leone G, Tenen D G. Proc Natl Acad Sci USA. 1994;91:7932–7936. doi: 10.1073/pnas.91.17.7932. [DOI] [PMC free article] [PubMed] [Google Scholar]
- 18.Chen H, Ray-Gallet D, Zhang P, Hetherington C J, Gonzalez D A, Zhang D E, Moreau-Gachelin F, Tenen D G. Oncogene. 1995;11:1549–1560. [PubMed] [Google Scholar]
- 19.Su G H, Ip H S, Cobb B S, Lu M-M, Chen H-M, Simon M C. J Exp Med. 1996;184:203–214. doi: 10.1084/jem.184.1.203. [DOI] [PMC free article] [PubMed] [Google Scholar]
- 20.Tondravi M M, McKercher S R, Anderson K, Erdmann J M, Quiroz M, Maki R, Teitelbaum S L. Nature (London) 1997;386:81–84. doi: 10.1038/386081a0. [DOI] [PubMed] [Google Scholar]
- 21.Mayer W E, Tichy H. Gene. 1995;164:267–271. doi: 10.1016/0378-1119(95)94092-z. [DOI] [PubMed] [Google Scholar]
- 22.Klein D, Ono H, O'hUigin C, Vincek V, Goldschmidt T, Klein J. Nature (London) 1993;364:330–334. doi: 10.1038/364330a0. [DOI] [PubMed] [Google Scholar]
- 23.Toyosawa S, O'hUigin C, Figueroa F, Tichy H, Klein J. Proc Natl Acad Sci USA. 1998;95:13056–13061. doi: 10.1073/pnas.95.22.13056. [DOI] [PMC free article] [PubMed] [Google Scholar]
- 24.Shintani S, O'hUigin C, Toyosawa S, Michalová V, Klein J. Genetics. 1999;152:743–754. doi: 10.1093/genetics/152.2.743. [DOI] [PMC free article] [PubMed] [Google Scholar]
- 25.Terzic J, Muller C, Gajovic S, Saraga-Babic M. Int J Dev Biol. 1998;42:701–707. [PubMed] [Google Scholar]
- 26.Gilbert D G. seqpup version 0.4j: a biosequence editor and analysis application. 1995. [Google Scholar]
- 27.Nicholas K B, Nicholas H B. gendoc: A tool for editing and annotating multiple sequence alignments, version 2.5. 1997. [Google Scholar]
- 28.Thompson J D, Higgins D G, Gibson T J. Nucleic Acids Res. 1994;22:4673–4680. doi: 10.1093/nar/22.22.4673. [DOI] [PMC free article] [PubMed] [Google Scholar]
- 29.Altschul S F, Gish W, Miller W, Myers E W, Lipman D J. J Mol Biol. 1990;215:403–410. doi: 10.1016/S0022-2836(05)80360-2. [DOI] [PubMed] [Google Scholar]
- 30.Saitou N, Nei M. Mol Biol Evol. 1987;4:406–425. doi: 10.1093/oxfordjournals.molbev.a040454. [DOI] [PubMed] [Google Scholar]
- 31.Kumar S, Tamura K, Nei M. mega: Molecular Evolutionary Genetic Analysis, version 1.01. University Park, PA: Pennsylvania State Univ.; 1993. [Google Scholar]
- 32.Ray D, Culine S, Tavitian A, Moreau-Gachelin F. Oncogene. 1990;5:663–667. [PubMed] [Google Scholar]
- 33.Chen H-M, Gonzalez D A, Radomska H S, Voso M T, Sun Z, Zhang P, Zhang D-E, Tenen D G. Gene. 1998;207:209–218. doi: 10.1016/s0378-1119(97)00629-x. [DOI] [PubMed] [Google Scholar]
- 34.Delaney S J, Hayward D C, Barleben F, Fischbach K-F, Miklos G L G. Proc Natl Acad Sci USA. 1991;88:7214–7218. doi: 10.1073/pnas.88.16.7214. [DOI] [PMC free article] [PubMed] [Google Scholar]
- 35.Albrecht K H, Eicher E M. Genetics. 1997;147:1267–1277. doi: 10.1093/genetics/147.3.1267. [DOI] [PMC free article] [PubMed] [Google Scholar]
- 36.Jun S, Wallen R V, Goriely A, Kalionis B, Desplan C. Proc Natl Acad Sci USA. 1998;95:13720–13725. doi: 10.1073/pnas.95.23.13720. [DOI] [PMC free article] [PubMed] [Google Scholar]
- 37.Lloberas J, Soler C, Celada A. Immunol Today. 1999;20:184–189. doi: 10.1016/s0167-5699(99)01442-5. [DOI] [PubMed] [Google Scholar]
- 38.Mao C, Ray-Gallet D, Tavitian A, Moreau-Gachelin F. Oncogene. 1996;12:863–873. [PubMed] [Google Scholar]
- 39.Ardavin C F, Gomariz R P, Barrutia M G, Fonfria J, Zapata A. Acta Zool (Stockholm) 1984;65:1–15. [Google Scholar]
- 40.Moroni E, Cairns L, Ottolenghi S, Giglioni G, Ashihara E, Migliaccio G, Migliaccio A R. Biochem Biophys Res Commun. 1997;231:299–304. doi: 10.1006/bbrc.1997.6088. [DOI] [PubMed] [Google Scholar]
- 41.Galson D L, Hesold J Q, Bishop T R, Schalling M, D'Andrea A D, Jones C, Auron P E, Housman D E. Mol Cell Biol. 1993;13:2929–2941. doi: 10.1128/mcb.13.5.2929. [DOI] [PMC free article] [PubMed] [Google Scholar]
- 42.Heikinheimo M, Ermolaeva M, Bielinska M, Rahman N A, Narita N, Huhtaniemi I T, Tapanainen J S, Wilson D B. Endocrinology. 1997;138:3505–3514. doi: 10.1210/endo.138.8.5350. [DOI] [PubMed] [Google Scholar]
- 43.Georgopolous K, Winandy S, Avitahl N. Annu Rev Immunol. 1997;15:155–176. doi: 10.1146/annurev.immunol.15.1.155. [DOI] [PubMed] [Google Scholar]
- 44.Moreau-Gachelin F, Ray D, Mattei M G, Tambourin P, Tavitian A. Oncogene. 1989;4:1449–1456. [PubMed] [Google Scholar]
- 45.Kherrouche Z, Beuscart A, Huguet C, Flourens A, Moreau-Gachelin F, Stehelin D, Coll J. Oncogene. 1998;16:1357–1367. doi: 10.1038/sj.onc.1201650. [DOI] [PubMed] [Google Scholar]


