

Abstract
HU and IHF are members of a family of prokaryotic proteins that interact with the DNA minor groove in a sequence-specific (IHF) or non-specific (HU) manner to induce and/or stabilize DNA bending. HU plays architectural roles in replication initiation, transcription regulation and site-specific recombination, and is associated with bacterial nucleoids. Cocrystal structures of Anabaena HU bound to DNA (1P71, 1P78, 1P51) reveal that while underlying proline intercalation and asymmetric charge neutralization mechanisms of DNA bending are similar for IHF and HU, HU stabilizes different DNA bend angles (∼105–140°). The two bend angles within a single HU complex are not coplanar, and the resulting dihedral angle is consistent with negative supercoiling. Comparison of HU–DNA and IHF–DNA structures suggests that sharper bending is correlated with longer DNA binding sites and smaller dihedral angles. An HU-induced bend may be better modeled as a hinge, not a rigid bend. The ability to induce or stabilize varying bend angles is consistent with HU’s role as an architectural cofactor in many different systems that may require differing geometries.
Keywords: Anabaena/DNA bending protein/negative supercoiling/non-specific DNA binding
Introduction
Recombination, initiation of replication and transcription are often dependent upon the proper assembly of oligomeric proteins and multiple DNA binding sites. In vivo, members of the IHF/HU family (sometimes called ‘DNABII’) of small hetero- or homodimeric DNA binding proteins can facilitate, and are often critical for, bringing required components together by bending or stabilizing bent DNA (reviewed by Nash, 1996; Rice, 1997). In this architectural role, they are functionally reminiscent of the HMG-box proteins of eukaryotes (Bianchi, 1994; Thomas and Travers, 2001). Some family members, such as IHF, Tf1 and the recently discovered Hbb (Kobryn et al., 2000), bind DNA with considerable sequence specificity, but HU displays little or no sequence preference. As HU is abundant, highly basic and contributes to chromosomal compaction and the maintenance of negative supercoiling, it is often referred to as a histone-like protein, although the nature of its involvement in nucleoid structure is under debate (reviewed by Dame and Goosen, 2002; Li et al., 1999). Despite functional similarities, IHF and HU show no structural relationship to either histones or HMGs. All prokaryotes appear to encode at least one member of this family. Some species, such as Escherichia coli, produce both a heterodimeric IHF and a heterodimeric HU, whereas others produce only a single homodimeric protein that is often more homologous to E. coli HU than to IHF. Despite 30–40% sequence identity between IHF and HU, many of the reported properties of HU cannot be fully explained by a model based on the known structure of an IHF–DNA complex.
Structural studies of HU proteins in the absence of DNA (Tanaka et al., 1984; White et al., 1989, 1999; Boelens et al., 1996; Christodoulou and Vorgias, 1998) and the crystal structure of an IHF–DNA complex (Rice et al., 1996) show that these proteins share a common fold, composed of a largely α-helical ‘body’ with two protruding β-ribbon ‘arms’. In the IHF structure, the arms wrap around the DNA and the 35 bp DNA wraps around the protein body, inducing a bend of >160°. The idea of a mutual induced fit between the protein and DNA is also supported by other studies: in crystal structures of HU from Bacillus stearothermophilus and Thermotoga maritima in the absence of DNA, the ends of the β-ribbon arms are disordered (Christodoulou and Vorgias, 1998; White et al., 1999); while NMR studies of HU and the related phage protein TF1 indicate that the arms are important in DNA binding and become less mobile in its presence (Sayre and Geiduschek, 1990; Boelens et al., 1996; Jia et al., 1996; Saitoh et al., 1999). However, as discussed below, the extensive wrapping of DNA around the IHF body requires a binding site considerably longer than the 9 bp often estimated for an HU dimer. Furthermore, the IHF–DNA structure does not fully explain the ability of HU to restrain negative supercoils in DNA (Broyles and Pettijohn, 1986; Shindo et al., 1992; Tanaka et al., 1995; Kobryn et al., 1999). Thus, it has been unclear whether or not the IHF–DNA complex provides a reasonable template for modeling HU–DNA interactions, despite 30–40% sequence identity between the proteins.
Although HU shows very little sequence specificity, it does bind preferentially to supercoiled DNA and shows strong preferences for structural distortions in DNA, such as nicks and three- or four-way junctions (Pontiggia et al., 1993; Castaing et al., 1995; Kamashev et al., 1999; Kamashev and Rouviere-Yaniv, 2000; Balandina et al., 2002). Estimates of Kd for undistorted duplex DNA vary from 200 to 2500 nM (depending on the ionic strength and experimental method), whereas Kd for distorted substrates can be as low as 2 nM (Kamashev and Rouviere-Yaniv, 2000). The homodimeric HU homolog from the cyanobacterium Anabaena PCC7120 (Nagaraja and Haselkorn, 1994), whose structure we report here, also binds weakly to undistorted DNA, but tightly (Kd = 3.5 nM) to substrates with mismatched bases spaced 9 bp apart (Grove et al., 1996). Tight binding to such lesions may reflect a role for HU in DNA repair. Effects of disruption of HU genes include enhanced radiation sensitivity (Boubrik and Rouviere-Yaniv, 1995), and genetic analysis suggests that HU plays a role in homologous recombination-mediated DNA repair (Li and Waters, 1998). IHF, in contrast, binds tightly to specific DNA sequences, but Kd is not significantly affected by a nick in its binding site (Lorenz et al., 2002), and it binds more weakly than HU to DNA of random sequence (Kd = 20–30 µM) (Yang and Nash, 1995).
Another difference between IHF and HU is the predicted binding site size and bend angle. HU, being a non-specific DNA binding protein, has been more difficult to study. In the IHF case, the hydroxyl radical footprint of >30 bp and the large bend angle observed by FRET in solution agree with the crystal structure (Yang and Nash, 1989; Lorenz et al., 2002). The binding site size estimated by gel mobility shift experiments for HU is variable. The mesophilic HUs from E.coli and Anabaena are predicted by gel mobility shift analyses to bind from 6 to 10 bp per dimer (Broyles and Pettijohn, 1986; Bonnefoy and Rouviere-Yaniv, 1991; Cann et al., 1995). The tighter binding HU from T.maritima shifts a 37 bp fragment as a single discrete band in a similar assay (Grove and Lim, 2001), while an ∼9 bp site is deduced for the same protein from a surface plasmon resonance assay (Esser et al., 1999). Mukerji and co-workers found that gel shift experiments with E.coli HU produced more bands than allowed by the stoichiometry derived from analytical ultracentrifugation and fluorescence anisotropy, implying that some shifted bands may have identical stoichiometry but different conformations (Wojtuszewski et al., 2001). A larger bend and longer binding site are estimated by other experiments, such as DNA cyclization (Hodges-Garcia et al., 1989; Paull et al., 1993) or cleavage by chemically modified HU proteins bound in a DNA loop (Aki and Adhya, 1997; Lavoie et al., 1996). When tightly bound to nicked DNA, E.coli HU also induces and/or stabilizes a considerable bend, and gel mobility shift assays with a nicked 40 bp substrate yield only one shifted band rather than the four seen with an unnicked 40mer (Kamashev et al., 1999).
We have solved three related HU–DNA crystal structures revealing the flexible nature of this complex.
Results and discussion
Crystallization and structure determination
Anabaena HU (A.HU) was co-crystallized with the binding sites shown in Table I. The discovery that diffracting cocrystals could be grown with such oligonucleotides was a fortuitous result of initial crystallization trials with longer binding sites that had been assembled from four separate oligonucleotides to create a doubly nicked IHF binding site (Figure 1A). Such complexes crystallized readily but diffracted poorly. However, a different crystal form appeared sporadically. This form, which diffracts nicely, contains only one of the original four oligonucleotides (TR3), base-paired as shown in Figure 1B. After it became obvious that the remaining three oligonucleotides were not in the complex, we found that crystal growth was more reproducible if they were omitted from the crystallization mix.
Table I. A subset of oligonucleotides used to try to attain HU–DNA cocrystals.
| Base pairsa | Crystals | ||
|---|---|---|---|
| TR3 | 5′ TGCTTATCAATTTGTTGCACC | 17 | Yes |
| AHU2 | 5′ TGCATATCAATTTGTTGCACC | 17 | Yes |
| AHU3 | 5′ TGCAATCAATTTGTTGCACC | 17 | No |
| AHU4 | 5′ TGCATACAATTTGTTGCACC | 17 | No |
| AHU5 | 5′ TGCAACAATTTGTTGCACC | 17 | No |
| AHU6 | 5′ *GCATATCAATTTGTTGCAT | 17 | Yes |
| AHU7 | 5′ *GCAATCAATTTGTTGCAT | 17 | No |
| AHU8 | 5′ *GCATACAATTTGTTGCAT | 17 | No |
aNumber of base pairs in expected duplex.
The asterisks indicate 5′ phosphates.
T, mismatched in duplex; T, unpaired and flipped; T, unpaired but stacked.

Fig. 1. DNA oligonucleotides used for crystallization. (A) DNA used in initial crystallizations. The sequence is the same as that in the IHF–DNA cocrystals but the nicks (indicated by arrows) are placed 9 bp apart in an effort to phase otherwise non-specific binding by HU. The IHF-binding consensus sequence is underlined and the four individual oligonucleotides are labeled TL (top left), BR (bottom right), etc. Crystals containing this duplex diffract poorly. (B) Oligonucleotide TR3 forms a pseudo-self-complementary duplex with three T:T mismatches and four unpaired Ts.
This structure was solved by molecular replacement using as a search model the structure of T.maritima HU, which shares 49% sequence identity with A.HU and was determined in the absence of DNA (Christodoulou et al., 2003). Initial electron density maps calculated with phases from this incomplete model showed density for phosphate groups near the body of the protein but lacked interpretable density for the rest of the DNA. The map was then improved by cycles of density modification and model building using the IHF–DNA structure as a guide (see Table II; Materials and methods). The resulting map showed two unpaired nucleotides on each strand, and was of sufficiently high quality to deduce the sequence of the DNA in the crystal (Figure 2A). Simulated-annealing (SA) composite omit maps were calculated to minimize model bias and assess model quality (Figure 2C).
Table II. Data and refinement statistics.
| TR3a | AHU2b | AHU6a | |
|---|---|---|---|
| Binding sitec | 5′ TGCTTATCAATTTG-T-TGCACC 3′ CCACGT-T-GTTTAACTATTCGT | 5′ TGCATATCAATTTG-T-TGCACC 3′ CCACGT-T-GTTTAACTATACGT | 5′ pGCATATCAATTTG-T-TGCAT 3′ TACGT-T-GTTTAACTATACGp< |
| Space group | P212121 | P212121 | P21 |
| Asymmetric unit contents | 1 HU homodimer, 1 DNA duplex | 1 HU homodimer, 1 DNA duplex | 2 HU homodimers, 2 DNA duplexes |
| Unit cell dimensions (Å) | 37.4 × 93.1 × 100.3 | 37.4 × 91.8 × 100.7 | 37.6 × 107.8 × 83.5 |
| Angles (°) | α = β = γ = 90 | α = β = γ = 90 | α = γ = 90, β = 92.2 |
| Wavelength (Å) | 1.00 | 1.08 | 0.90 |
| Rmerge | 0.04 | 0.05 | 0.11 |
| Resolution limits (Å)d | 25–1.9, 2.5, 2.0 | 25–2.4, 2.8, 2.3 | 25–2.5, 2.5, 2.8 |
| Completeness of data used in refinement (%) | 91 (inside ellipsoid) | 85 | 91 (inside ellipsoid) |
| R | 24.4% | 23.9% | 28.6% |
| Rfree (% of data) | 28.8% (5) | 27.6% (5) | 33.8% (10) |
| R.m.s.d. from ideal | |||
| Bonds (Å) | 0.015 | 0.013 | 0.005 |
| Angles (°) | 1.745 | 1.625 | 0.927 |
| Residues in most preferred region of Ramachandran plot | 92%, no outliers | 91%, no outliers | 95%, no outliers |
| Solvent corrections | |||
| k (e/Å3) | 0.47 | 0.50 | 0.75 |
| B (Å2) | 89 | 93 | 50 |
| Non-H atoms in model | |||
| Protein | 1409 | 1382 | 2767 |
| DNA | 791 | 812 | 1556 |
| H2O | 196 | 94 | 72 |
| PDBID | 1P71 | 1P78 | 1P51 |
aData collected at BioCARS 14BMC beamline at the Advanced Photon Source.
bData collected at SBC ID19 beamline at the Advanced Photon Source.
cp represents the 5′ phosphate group.
dFor refinement, the TR3 and AHU6 data were truncated to an ellipsoid with these principal axes (see Materials and methods for details). AHU2 was refined against all data to 2.3 Å.

Fig. 2. Electron density. (A) and (B) show the same σa weighted 2Fo – Fc map contoured at 1σ and 5σ. Phases for this map were calculated from the incorrect IHF-based model shown in (A), but clear density was visible for the extra nucleotides in the correct model (B). Energy minimization of the incorrect model in (A) placed the proline in density belonging to the stacked unpaired T (asterisk). The high quality of these preliminary data allowed identification of the correct DNA substrate by visible inspection of the map. (C) Composite simulated-annealing omit map of the final TR3 structure contoured at 1.3σ and 5σ (see Supplementary data for a larger image and similar maps of AHU2 and AHU6).
Oligonucleotide AHU2 was designed to explore the effects of the T:T mismatches in TR3, and further improved the reproducibility of crystal growth. AHU6 was designed to improve crystal packing by removing the two overhanging 3′ Cs and replacing the blunt-ended DNA stacking of the first form with two base pairs. It crystallized in a different but related crystal form: the crystal packing contacts are as designed, but the DNA bending has changed slightly, rendering two of the original 21 screw axes non-crystallographic.
A series of less distorted DNA variants were also tested for their ability to yield crystals. Removal of either or both T7 (the flipped out thymine) or T5 (the unpaired stacked thymine) abolished crystal growth.
Overall structure of the HU–DNA complex
The structure of A.HU bound to the TR3 DNA substrate is shown in Figure 3A and B. The asymmetric unit contains one protein dimer and a single DNA duplex. As in IHF–DNA cocrystals, DNA in neighboring complexes packs end to end, forming a pseudocontinuous helix (Figure 4A). The overall structure bears many similarities to the IHF–DNA complex structure: the β-ribbon arms wrap around the minor groove of the DNA and, at the tip of each arm, the conserved proline residue intercalates between base pairs, creating and/or stabilizing two kinks in the DNA (Figure 3C).

Fig. 3. HU–DNA and IHF–DNA cocrystal structures. (A) Ribbon diagram of the HU–DNA complex (TR3). The protein homodimer is in gold and orange, with intercalating prolines in yellow. Nucleotides are colored as described in (D). (B) The HU–DNA complex viewed from the ‘top’. (C) Structure of IHF bound to the H′ site from phage λ (Rice et al., 1996). The α subunit is white, the β subunit is pink and the intercalating prolines are yellow. The DNA is blue except for the consensus sequence, which is green. (D) The sequence of the DNA substrate in TR3 with the three T:T mismatches in pink and four unpaired Ts in gray and green. The gray Ts are flipped out of the duplex and make crystal packing contacts in the structure, while the green Ts remain stacked. The yellow diamonds indicate sites of proline intercalation. The light blue Cs are partially disordered in the TR3 structure.

Fig. 4. Crystal packing. Three asymmetric units from (A) the HU- TR3 DNA crystals and (B) the IHF–DNA cocrystals are shown. The DNA duplexes stack end to end to form a pseudocontinuous helix. Yellow circles highlight a conserved interaction between the N-terminal dipole of helix 3 and the DNA backbone. In the IHF structure, this interaction occurs within a single complex, while in the HU structures it occurs between protein and DNA partners from neighboring complexes. The shorter DNA in the HU cocrystals prevents formation of contacts between the N-termini of helices 1 and 2 and the DNA backbone, as seen in the IHF structure (gray circle). (C) Close-up view of the conserved interaction. HU-bound (blue) and IHF-bound (green) DNA superimpose well only near the phosphate that interacts with the N-terminus of helix 3 (orange polyglycine model for HU; pink for IHF). (D) Packing of two asymmetric units from the AHU6 structure, each containing two complexes.
All of the HU–DNA complexes are asymmetric, despite the fact that both the protein and the DNA duplexes are homodimeric. The magnitude of the bend on each side of the protein varies within a single complex as well as between crystal forms. This may reflect the flexible nature of this complex in solution (discussed further below).
The DNA-bound HU structures presented here represent the first structural characterization of a mesophilic HU. Previous work has shown that the identity of residue 15 in the turn between helices 1 and 2 is important in deter mining the thermostability of HU proteins (Kawamura et al., 1996; Christodoulou and Vorgias, 2002). Thermo philes typically have a Gly in this position. Ser15 in our structures is one of only two non-Gly residues in the left-handed helix region of the Ramachandran plot. The other residue in the left-handed region, Asn66, is typically a Gly in bacteria that live at lower temperatures, while it is a Lys or Arg in thermophiles. While the overall effect on stability is unclear, we observe that A.HU folds around a large central cavity (∼110 Å3). Such a cavity is missing in the thermophilic B.stearothermophilus HU structure (White et al., 1999), but HU from T.maritima (Christodoulou and Vorgias, 1998), another thermophile, contains a slighter larger cavity (∼137 Å3). In the B.stearothermophilus HU structure, the hole is largely filled by the substitution of Phe for Leu at position 29, in concert with small shifts of the polypeptide backbone.
Effects of DNA distortions on the overall complex
Since A.HU crystallized with an unintended pseudo-self-complementary duplex (Figure 1B), the resulting DNA substrates have two extra Ts on each strand and either one (AHU2 and AHU6) or three (TR3) T:T mismatches. However, the base-pair step parameters in the vicinity of the kink are surprisingly similar for IHF- and HU-bound DNA (Figures 5 and 6). The T:T mismatches bring the phosphate backbones slightly closer together, but this effect is localized to the vicinity of the mismatched base pair, as seen by the superposition of the AHU2 and TR3 structures (Figure 7A and B). The central T:T mismatch that remains in all three structures may narrow the minor groove. However, in the IHF–DNA structure, the minor groove at this position was even narrower despite being fully base-paired (Rice et al., 1996).

Fig. 5. Stereo views of (A) the HU and (B) the IHF α-subunit arms at the site of DNA kinking. The DNA step parameters are remarkably similar for analogous base pairs despite the differences in sequence and the extra two unpaired Ts in the HU structure. Colors are the same as in Figure 3.

Fig. 6. Base-pair step parameters. Rise, tilt and roll are plotted for the 15 centermost base pairs of each complex. The sharp spikes in each parameter correspond to the kinks. The IHF line is broken due to a nick and two non-canonical base pairs in the DNA near the tip of the β-subunit arm. Unpaired bases were not included in these calculations.
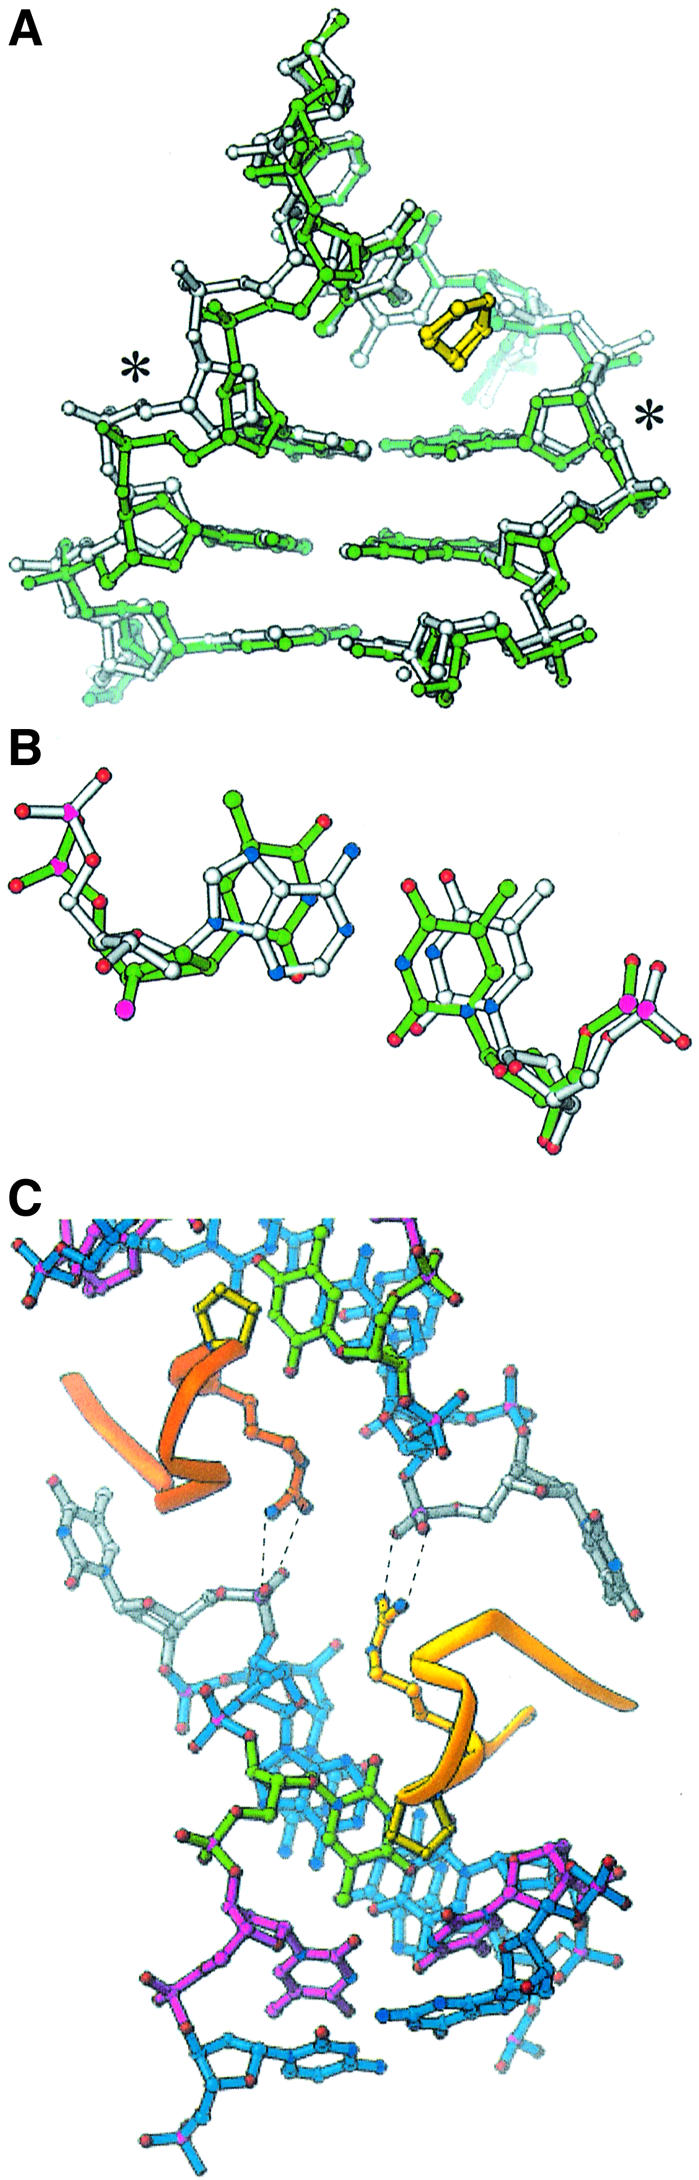
Fig. 7. Effects of DNA distortions on the HU–DNA structure. (A) Minor groove view of the TR3 model (green) superimposed on the AHU2 model (white). The base pair marked with asterisks is T4:T16 in TR3 and A4:T16 in AHU2. Significant peaks in the Fobs AHU2 – Fcalc TR3 map were confined to this region and to the Cs at the 3′ ends, which were more ordered in AHU2 and lie in the major groove. (B) Superposition of the T:T (green) and A:T (white) base pairs. (C) Arg 61 in these structures (TR3 model shown here) makes bidentate hydrogen bonds to the 5′ phosphate of the flipped out T7 of a neighboring complex.
The unpaired Ts were required for crystal formation. The unpaired T7 on each strand flips out of the duplex, and its 5′ phosphate makes a crystal packing contact with the Arg61 side chain of a neighboring complex (Figure 7C). This Arg residue is conserved in both IHF and HU proteins, and the analogous Arg63 in IHF makes hydrogen bonds to DNA that are theoretically possible in the HU–DNA structures. The bases flanking T7 stack normally (Figure 5), and the phosphate backbone connects without distortion if T7 is removed from the model.
The unpaired T5 is stacked in the duplex adjacent to the intercalated proline and may cause a small displacement of the proline. Unlike T7, whose position seems to be dictated by crystal packing forces, the position of T5 may be relevant to the solution behavior of HU because, like other structural distortions that HU binds preferentially, it may facilitate bending. The two copies of T5 in the duplex are fortuitously spaced 9 bp apart, thus matching the spacing of the kinks. This may phase HU’s otherwise non-specific binding, allowing formation of an ordered crystal. The bases that flank T5 and the intercalated proline are slightly farther apart than the bases that flank the kink in the published IHF structure. However, the first IHF–DNA cocrystals were grown with DNA that was nicked at the same position as T5. In that structure, the bases on either side of the nick were sprung apart to positions similar to those adopted by the flanking base pairs in the A.HU structure (Rice et al., 1996). This implies that the kink imposes strain on the phosphodiester backbone that can be relieved by breaking a covalent bond or by inserting an extra nucleotide.
Binding site size
The length of DNA contacted in these crystals ranges from 14 to 19 bp, and sites from 9 to 37 bp in solution can be supported by these structures. The overall ratio of DNA to protein in the crystals is 17 bp/HU dimer. However, the DNA in these crystals packs to form a pseudocontinuous helix, and each dimer also contacts the DNA bound to neighboring complexes (Figure 4A). Thus, to estimate the binding site size in these crystals, DNA from the neighboring complexes must be considered. As in the IHF–DNA complex, there are nine base pairs between intercalating prolines and the β-ribbon arms interact extensively with the minor groove in this region. In most cases, 5 bp beyond the proline, a phosphate from the neighboring duplex interacts with the N-terminus of helix 3 (yellow circle in Figure 4A). A very similar contact is present in the IHF–DNA structure, but occurs within a single complex (Figure 4B and C). Taking this contact into account, the maximum binding site size estimated from these HU–DNA structures is 19 bp/dimer. However, not all complexes are identical. Both complexes in the asymmetric unit of the P21 crystal form exhibit this type of interaction on each side of the dimer, but in one instance there are only 4 bp rather than 5 bp between the proline and the helix 3–phosphate contact (Figure 4D). The single complex in the P212121 form is more asymmetric and only one side of the dimer forms such a contact (Figure 4A).
HU is probably capable of contacting a longer binding site in solution. Electrostatic surface representations of HU and IHF (Figure 8) show that a similar positively charged DNA-binding surface extends entirely down the sides of both proteins. This ‘positive stripe’ includes the N-termini of all three helices as well as many positively charged side chains. In the IHF–DNA cocrystals, the N-terminus of each helix interacts with a phosphate group: helices 1 and 3 contact the DNA at the sides of the protein, and helix 2 contacts symmetry-related DNA at the very bottom of the protein (Figure 4B, gray circle). If all these contacts are considered, the binding site could be as large as 37 bp/dimer. Crystal packing in the HU case may have artificially shortened the DNA binding site. IHF prefers a narrow minor groove where the DNA faces the side of the protein, but in the HU structure the minor groove of the analogous region of DNA is widened by the presence of the neighboring HU arm.

Fig. 8. Side view of electrostatic surface representations of (A) HU (TR3) and (B) IHF. The DNA is shown in yellow. The distribution and magnitude of positive (blue) and negative (red) potential are similar for both proteins. Notably, the positive stripe running entirely down the side of both proteins implies that HU has a DNA binding surface capable of interacting with longer substrates.
The variability of the contacts seen between the sides of the HU protein and the DNA in the crystals suggests that this complex is quite flexible in solution as well. The favorable electrostatics of these ‘side’ contacts may be balanced by a free-energy penalty for increasing the bend angle at the kinks, resulting in a complex where the 9 bp between kinks are tightly bound across the top of the protein, but the DNA outside the kinks ‘flaps’ against the sides of the protein. This balance could easily be affected by other factors, such as DNA damage or the presence of other proteins like Gal repressor.
Grove and co-workers implicated the conserved Lys3 and the presence or absence of an internal salt bridge partner at position 26 as a determinant for binding site length in different HU-like proteins (Grove and Saavedra, 2002). In the absence of an internal binding partner, Lys3, which is near the N-terminus of helix 1, would interact more readily with DNA bound to the side of the protein. In our structures, Lys3 is hydrogen bonded to Thr26. However, if the DNA did go straight down the side of the protein, it is likely that Lys3 in A.HU would interact with the phosphate backbone at least some of the time. DNA binding to IHF is coupled to the disruption of surface salt bridges (Holbrook et al., 2001). Having an alternate interaction partner may make contact with the DNA less energetically favorable.
HU-induced DNA bend angle
As in the IHF–DNA structure, the DNA in the HU structure is comprised of three roughly straight B-form helices separated by two regions with large positive roll angles between base pairs at the sites of proline intercalation (HU, TR3: 56° and 57°; IHF: 59°) (Figure 6). Table III indicates the degree of bending induced separately by each arm as well as the overall bend angle for each complex (see Materials and methods). The two bend angles in any given complex are not coplanar, resulting in dihedral angles of 40–73°. These angles result principally from large tilt angles (HU, TR3: 22° and 38°) at the site of kinking. The smaller tilt angle (∼5°) seen in the IHF-bound DNA reflects a smaller (15°) dihedral angle. The overall bend in these structures ranges from ∼105 to 140°. This variability is readily apparent when the β-sheet portions of the protein bodies are superimposed (Figure 9).
Table III. Individual and overall bend angles and dihedral anglesa.
| Angle 1 (°) | Angle 2 (°) | Overall bend (°)b | Dihedral (°) | |
|---|---|---|---|---|
| TR3 | 74 | 84 | 106 | 72 |
| AHU2 | 77 | 82 | 105 | 73 |
| AHU6a | 91 | 85 | 130 | 50 |
| AHU6b | 89 | 82 | 139 | 40 |
| IHF | 93 | 87 | 163 | 15 |
aAngles calculated as described in Material and methods.
bBecause there is an out-of-plane component to bending, the overall bend is not simply a sum of the angles 1 and 2.

Fig. 9. Flexibility of the bend angles in HU-bound DNA. (A) Superposition of HU–DNA structures TR3 and AHU6 (both dimers). AHU2 was omitted because it overlaps with TR3. Each structure is superimposed about its own protein 2-fold axis so that a total of six structures are displayed. The complexes were overlaid using a least-squares fit of the two central β-sheets at the top of the protein bodies. (B) Superposition of the best-fit lines calculated for the ‘top’ and ‘side’ DNA segments for each structure (see Materials and methods for details). Top panel: same view as in (A); bottom panel: rotated ∼90° about a vertical axis.
HU stabilizes negatively supercoiled DNA
In agreement with HU’s ability to restrain negative supercoils, our structures show that HU introduces both underwinding and negative writhe. The average twist in the HU-bound DNA is 31°/bp, compared with 34°/bp for the IHF-bound DNA and ∼34.3°/bp for relaxed B-form DNA. The difference between HU and IHF results from different contacts to the sides of the protein. In both complexes, undertwisting of the DNA near the kinks is partially compensated by overtwisting of the DNA between the kinks. However, in the IHF–DNA structure, the DNA is also overtwisted on each side where the minor groove is bound by the body of the protein. If the IHF DNA is truncated to the same length as the HU DNA, the overall twist is also 31°/bp. Even if HU-bound DNA in solution is flexing and leading to a variable binding site length, the average overall twist will be less than that of B-form DNA. Also, the two bends within a single HU complex are not coplanar and the sign of the resulting dihedral angle is consistent with negative writhe. Interestingly, HU’s dihedral angles are two to four times larger than those of IHF. The largest dihedral angles correspond to the structures lacking one of the helix 3–phosphate contacts and thus displaying the smallest overall bend angles (Table III). Thus, a shorter binding site may correspond to a smaller bend but a more negative writhe.
Flexibility of the HU–DNA complex
The structures presented here are static snapshots of the HU–DNA complex. Nevertheless, several structural clues suggest that HU–DNA complexes might be flexible in solution. Figure 9 shows that when the central β-sheets are superimposed, the bodies of the HU proteins in different complexes overlap tightly. However, the β-ribbon arms and the path of the DNA along the sides of the protein show a large degree of variability. The degree to which the protein accommodates a range of DNA bend and dihedral angles (Table III) has not been shown structurally until now, although it has previously been postulated that HU may have multiple binding modes (Grove and Lim, 2001; Wojtuszewski et al., 2001; Dame and Goosen, 2002). These observations and the fact that HU has a similar electrostatic surface to IHF suggest that the variability in published HU binding site lengths may be a reflection of the truly flexible nature of the HU–DNA complex.
What is the result of this structural flexibility? Practically, it may complicate measurements of binding site length and bend angles in solution, as experimental conditions may stabilize one extreme over another. More importantly, it may allow HU to play a wide variety of roles in vivo, consistent with the pleiotropic phenotypes of cells lacking functional HU (Huisman et al., 1989; Khudyakov and Wolk, 1996). HU acts as an architectural factor in many different systems, such as transcription regulation, replication initiation and site-specific recombination, which may require differing geometries (reviewed by Nash, 1996; Rice, 1997). It also plays another broader role in the maintenance of negative supercoiling and chromosomal compaction. Bacterial chromatin is more fluid and loosely organized than that of eukaryotes (Li et al., 1999). While there is not enough HU present in exponentially growing cells [∼1 dimer per 300–400 bp (Azam et al., 1999)] to coat the chromosome, by introducing numerous flexible kinks in the DNA, HU may help to reduce the persistence length of chromosomal DNA without forming rigid static structures.
In summary, we have solved the crystal structures of A.HU bound to three variants of a DNA substrate in two different crystal forms. One crystal form contained two copies of the complex in the asymmetric unit so that we have been able to examine three independent determinations of the HU–DNA complex. The underlying mechanism of DNA bending is quite similar for IHF and HU, and close similarities in base-pair step parameters in the vicinity of the kinks strongly support the idea that these proteins recognize their targets by indirect readout of DNA distortability (either sequence-dependent in the IHF case, or structure-dependent in the HU case). Our results also show that HU is capable of inducing and/or stabilizing different DNA bend angles ranging at least from ∼105 to 140°. This variability reflects extensive DNA contacts between ∼9 bp pairs of DNA and the β-ribbon arms, and variable contacts between additional DNA and the body of the protein. We propose that the DNA bend induced and/or stabilized by HU in solution could vary through an even larger range of angles, depending on the presence of such factors as DNA damage, supercoiling and other proteins. These structures also help to explain HU’s propensity for binding to negatively supercoiled DNA. The dihedral angle describing the non-planarity of the two bend angles within a single complex is two to four times larger in the HU–DNA structures than in the IHF structures, although the direction of the dihedral angle is in all cases consistent with negatively supercoiled DNA. The HU-bound DNA is also underwound (31°/bp) compared with the IHF-bound DNA (34°/bp). Our work suggests that an HU-induced bend may be better understood and modeled as a hinge rather than a rigid bend.
Materials and methods
Cloning HU from Anabaena genomic DNA
HU was cloned from Anabaena PCC7120 genomic DNA (a gift from K.Jones and R.Haselkorn) using PCR primers 5′-GCACGTAAGCAT ATGAACAAAGGTGAATTGGTTGATG (N-terminal) and 5′-CGGGG TACCTTATGCTTTTGGGGGTGCTACTTTTTCT (C-terminal) (Operon). The PCR product was digested with NdeI and KpnI, and ligated into a derivative of pRSETb (also cut with NdeI and KpnI) to create pPR301. To improve expression, the AHU gene was later subcloned into pET21a (creating pETAHU) using the NdeI and KpnI restriction sites. The cloned nucleotide sequence differs from the published one at two positions (T at position 33 and A at 75), but the resulting amino acid sequence is identical.
Sample preparation
Escherichia coli strain RJ1878 (a gift from R.Johnson), a derivative of BL21(DE3) that lacks functional chromosomal HU genes, was used for protein expression. Transformed cells were grown at 37°C in Luria–Bertani medium containing 100 µg/ml ampicillin and induced with 0.5 mM ispropyl-β-d-thiogalactopyranoside (IPTG) at an optical density of 0.7 (600 nm). Cells were harvested 2 h after induction and frozen at –20°C. Cells were thawed and resuspended in lysis buffer A [50 mM Tris pH 8.0, 10% sucrose, 2.5 mM dithiothreitol (DTT), 12.5 mM EDTA; 60 ml/75 g cells]. Lysis buffer B (200 mM Tris pH 8.0, 200 mM spermidine Cl, 1 M NaCl, 50% saturated ammonium sulfate) was added to the cell suspension (15 ml/75 g cells). Cells were treated with 200 µg/ml lysozyme (Roche Molecular Biochemicals) in the presence of protease inhibitor cocktail tablets (1 tablet/50 ml cell suspension; Boehringer Complete) for 30 min at 4°C and then at 37°C for 1–2 min. Cell debris was removed by centrifugation at ∼7000 g for 40 min at 4°C. Ammonium sulfate was added to the supernatant in two steps. After each addition, precipitated proteins were spun down at ∼7000 g for 40 min at 4°C. HU was in the supernatant at 50% saturation and in the precipitate at 80% saturation. Further purification was achieved by affinity chromatography on a heparin column (Amersham Pharmacia), followed by ion exchange on a Mono-S column (Amersham Pharmacia). The low-salt chromatography buffer was 25 mM HEPES pH 7.0, 5% glycerol, 0.1 mM EDTA, 0.1 M NaCl (the high-salt buffer contained 2 M NaCl). The protein elutes at ∼1 M NaCl. The total yield was ∼1 mg per liter of cell culture. The resulting protein ran as a single 10 kDa band on a 15% SDS–PAGE gel. The possibility of nuclease contamination was excluded by incubating the protein with supercoiled plasmid and 10 mM MgCl2 at 37°C for 2 h. A.HU has no Tyr or Trp residues, and thus no absorbance at 280 nm. Therefore, protein concentration was estimated by Bradford assay using IHF as a standard. IHF concentration was determined using a theoretical ε280 of 5800/M·cm. DNA oligonucleotides for crystallization were purchased from the HHMI Biopolymer/Keck Biotechnology Research Foundation at Yale and were further purified by high-pressure liquid chromatography (HPLC) or by preparative PAGE.
Cocrystallization
Crystals were grown by vapor diffusion using the hanging-drop method. Drops contained 1 µl of well solution and 1 µl of complex (1:1.8 molar ratio of protein:DNA). The well solutions contained 50 mM KCl, 10% glycerol, 50 mM Tris pH 7.5 or pH 8.0, 0.02% NaN3, 1% Jeffamine pH 7.0, 12–22.5% PEG 5000 monomethyl ether and 10–20 mM CaCl2. The crystals that produced structures TR3 and AHU2 were grown in 20 mM CaCl2, while the AHU6 crystal was grown in 10 mM CaCl2. Crystals were transferred to cryoprotectant prior to freezing. Cryoprotectant solutions contained the same components as the well solutions with an increase of 3% in PEG5KMMe and an increase in glycerol concentration to 20%. Mother liquor was removed and replaced with cryoprotectant in which the glycerol concentration was gradually increased in steps of 5%. Crystals were flash frozen in liquid propane on mounted cryoloops (Hampton Research). The propane was then frozen in liquid nitrogen.
Data collection
Data sets were collected at 100 K on the BioCARS 14BM-C (TR3 and AHU6) or Structural Biology Center CAT ID19 (AHU2) beamlines at the Advanced Photon Source and processed with the HKL suite (Otwinowski and Minor, 1997). Because the datasets were anisotropic, resolution limits were determined by evaluating where <I/σI> fell below 2 in cones around each reciprocal space axis. Data and refinement statistics for all three structures are summarized in Table II. Data for the TR3 and AHU6 structures were truncated to an ellipsoid with principal axes of the anisotropic resolution limits determined as above. Reflections were deleted if: h2/hmax2 + k2/kmax2 + l2/lmax2 > 1, where hmax = (amax a*)–1, kmax = (bmax b*)–1, lmax = (cmax c*)–1, and amax, bmax and cmax are the resolution limits along the three axes. Note that this expression is only valid if the unit cell is orthorhombic or very nearly so. This was done to avoid the problem of the overall anisotropic B correction applied to Fobs during refinement scaling up noise along the worst-diffracting direction to match the overall intensity of real reflections in the best direction.
Structure determination
For the TR3 structure, phases were determined using molecular replacement (EPMR; Kissinger et al., 1999) with a modified version of the T.maritima HU crystal structure (1B8Z; Christodoulou et al., 2003) as a search model. Side chains on 1B8Z were pruned until only atoms present in both Thermotoga and Anabaena HU remained. A single solution consistently appeared above all others. The correlation coefficient (CC) for this solution (CC = 0.274) was 7σ above the mean CC of 0.201 for 40 solutions and 5σ above the next best solution. σa weighted (Read, 1986) 2Fo – Fc maps made using these phases showed clear density for a phenylalanine that had been removed from the search model and for a few phosphate groups near the protein, but lacked interpretable density for the rest of the DNA. A mask was drawn around the density for the protein and the region where DNA density was expected to be based on the E.coli IHF cocrystal using MAMA from the RAVE program suite (Kleywegt and Jones, 1996). Multiple cycles of solvent flattening using this mask together with phase extension starting at 5 Å and going out to 3 Å in 50 steps improved the phases enough to see crude density for nucleic acid (CNS; Brunger et al., 1998). A short duplex from the IHF structure was then added to the model. After energy minimization, the true DNA sequence could be built by examining σa weighted 2Fo – Fc and Fo – Fc electron density maps (Figure 2). The true phosphate positions were remarkably clear in these maps despite model bias from the incorrect DNA model. Cycles of model building using O (Jones et al., 1991) were alternated by refinement using CNS (Table II).
Initial phases for the AHU2 structure were provided by the nearly isomorphous TR3 model. The same reflections were reserved for calculating Rfree. The AHU6 structure was solved by molecular replacement (EPMR) using the TR3 structure as a model. Two-fold non-crystallographic symmetry (NCS) restraints were applied to the first and second helices (and the turn between them) during refinement of the AHU2 structure. Similar restraints were used for the AHU6 in addition to restraints on the β-ribbon arms and β-sheets, and DNA. Decisions about which atoms to restrain (and whether to choose 2- or 4-fold restraints for AHU6) were based on the comparison of differences between real-space Rs with and without restraints while monitoring the effect on R and Rfree. In addition, comparison of energy minimizations with and without sugar pucker restraints was performed for each structure in order to determine which sugars could be safely restrained. The accuracy of each structure was verified by examination of composite SA omit maps (Figure 2C; see also Supplementary data available at The EMBO Journal Online) and by PROCHECK (Laskowski et al., 1993) analysis. All three structures were subjected to final refinement with Refmac5 using the TLS procedure (CCP4, 1994; Winn et al., 2001) to account better for the anisotropic flexibility of these complexes. Four TLS groups were refined for TR3: one for the body of the protein, one for each arm and one for the DNA. TLS on AHU2 was more beneficial when the DNA was further partitioned into three groups: the ‘inner’ segment of DNA between the two kinks, and one for each ‘outer’ segment of DNA for a total of six groups. AHU6 was most successfully refined with 12 TLS groups (analogous to the AHU2 groups but including a set for each complex in the asymmetric unit). This treatment did not significantly change the final coordinates (as the diagonal weighting term was kept low) but reduced the R factors by 1–3%. Statistics of the final models are summarized in Table II. A sample diffraction image for AHU6 is provided in the Supplementary data. This crystal, while nearly yet not completely single, was the best obtained for a complex with this DNA substrate. The image shows that the data and refinement statistics for this structure reflect poor primary data as opposed to an inaccurate model.
DNA base-pair step parameters were analyzed using the program 3DNA (Lu and Olson, 2000), and figures were generated using Ribbons (Carson, 1991) and Grasp (Nicholls et al., 1991) (for electrostatic surface representations).
Cavity volumes were calculated as the region that could be occupied by a probe of radius 1.4 Å using VOIDOO and the library ms_cavity.lib (Kleywegt and Jones, 1994). Slightly larger volumes were obtained with the default library.
Bend angle determination
The DNA is essentially three straight helices with two sites of bending. Each helix is represented by a single line (lines a and c for helices along the sides of the protein, and line b for the helix along the top of the protein between the β-ribbon arms). Each base pair was reduced to a single point by averaging the positions of N9 (purines) and C6 (pyrimidines). Three best-fit lines were calculated by minimizing the distance of each point to the appropriate line. Line b was fit to a set of five base pairs centered around the central T:T mismatch. Lines a and c were calculated using the first four (P212121 structures) or five (P21 structures) base pairs adjacent to the prolines. Bend angles 1 and 2 (Table III) were calculated between lines a and b and lines c and b, respectively. The overall bend angle could not be represented by the simple sum of bend angles 1 and 2 because of the non-planarity of the two bends. The overall bend angle is calculated between lines a and c. Bend angles α were calculated from the formula below for two lines (l1 and l2) and do not require that the lines intersect at a single point. To calculate dihedral angles, the cross-products between line a and line b and between line c and line b were used in the formula below. The dihedral angle is calculated between lines a and c when looking down b:
→→→→
α = cos–1{(l1 · l2)/(|l1| |l2|)}
Angles were determined for DNA from the IHF complex using the method described here, and the results (Table III) are the same as those published previously (Rice et al., 1996).
Supplementary data
Supplementary data are available at The EMBO Journal Online.
Acknowledgments
Acknowledgements
We thank Kathryn Jones and Robert Haselkorn for Anabaena PCC7120 genomic DNA and Reid Johnson for E.coli strain RJ1878. We are grateful to Adam Kalai for assistance in angle calculations and Sarah Bagby for considerable efforts in the early stages of this project. We thank the staff at the SBC and Biocars beamlines for help with data collection and Adam Conway, Tom Lynch and Yu Chen for assistance in data collection and helpful comments on the manuscript. Use of the Argonne National Laboratory Structural Biology Center beamlines and the BioCARS Sector 14 beamlines at Advanced Photon Source was supported by the U.S. Department of Energy, Basic Energy Sciences, Office of Science, under Contract No. W-31-109-Eng-38. Use of the BioCARS Sector 14 was supported by the National Institutes of Health, National Center for Research Resources, under grant number RR07707. This study was supported by NIH grant GM66011 to P.A.R. and an NIH predoctoral training grant NIT32 GM07183H for K.K.S.
References
- Aki T. and Adhya,S. (1997) Repressor induced site-specific binding of HU for transcriptional regulation. EMBO J., 16, 3666–3674. [DOI] [PMC free article] [PubMed] [Google Scholar]
- Azam A.T., Iwata,A., Nishimura,A., Ueda,S. and Ishihama,A. (1999) Growth phase-dependent variation in protein composition of the Escherichia coli nucleoid. J. Bacteriol., 181, 6361–6370. [DOI] [PMC free article] [PubMed] [Google Scholar]
- Balandina A., Kamashev,D. and Rouviere-Yaniv,J. (2002) The bacterial histone-like protein HU specifically recognizes similar structures in all nucleic acids. DNA, RNA and their hybrids. J. Biol. Chem., 277, 27622–27628. [DOI] [PubMed] [Google Scholar]
- Bianchi M.E. (1994) Prokaryotic HU and eukaryotic HMG1: a kinked relationship. Mol. Microbiol., 14, 1–5. [DOI] [PubMed] [Google Scholar]
- Boelens R., Vis,H., Vorgias,C.E., Wilson,K.S. and Kaptein,R. (1996) Structure and dynamics of the DNA binding protein HU from Bacillus stearothermophilus by NMR spectroscopy. Biopolymers, 40, 553–559. [DOI] [PubMed] [Google Scholar]
- Bonnefoy E. and Rouviere-Yaniv,J. (1991) HU and IHF, two homologous histone-like proteins of Escherichia coli, form different protein–DNA complexes with short DNA fragments. EMBO J., 10, 687–696. [DOI] [PMC free article] [PubMed] [Google Scholar]
- Boubrik F. and Rouviere-Yaniv,J. (1995) Increased sensitivity to gamma irradiation in bacteria lacking protein HU. Proc. Natl Acad. Sci. USA, 92, 3958–3962. [DOI] [PMC free article] [PubMed] [Google Scholar]
- Broyles S.S. and Pettijohn,D.E. (1986) Interaction of the Escherichia coli HU protein with DNA. Evidence for formation of nucleosome-like structures with altered DNA helical pitch. J. Mol. Biol., 187, 47–60. [DOI] [PubMed] [Google Scholar]
- Brunger A.T. et al. (1998) Crystallography and NMR system: a new software suite for macromolecular structure determination. Acta Crystallogr. D, 54, 905–921. [DOI] [PubMed] [Google Scholar]
- Cann J.R., Pfenninger,O. and Pettijohn,D.E. (1995) Theory of the mobility-shift assay of non-specific protein–DNA complexes governed by conditional probabilities: the HU:DNA complex. Electrophoresis, 16, 881–887. [DOI] [PubMed] [Google Scholar]
- Carson M. (1991) Ribbons 2.0. J. Appl. Crystallogr., 24, 958–961. [Google Scholar]
- Castaing B., Zelwer,C., Laval,J. and Boiteux,S. (1995) HU protein of Escherichia coli binds specifically to DNA that contains single-strand breaks or gaps. J. Biol. Chem., 270, 10291–10296. [DOI] [PubMed] [Google Scholar]
- Christodoulou E. and Vorgias,C.E. (1998) Cloning, overproduction, purification and crystallization of the DNA binding protein HU from the hyperthermophilic eubacterium Thermotoga maritima. Acta Crystallogr. D, 54, 1043–1045. [DOI] [PubMed] [Google Scholar]
- Christodoulou E. and Vorgias,C.E. (2002) The thermostability of DNA-binding protein HU from mesophilic, thermophilic and extreme thermophilic bacteria. Extremophiles, 6, 21–31. [DOI] [PubMed] [Google Scholar]
- Christodoulou E., Rypniewski,W.R. and Vorgias,C.R. (2003) High-resolution X-ray structure of the DNA-binding protein HU from the hyper-thermophilic Thermotoga maritima and the determinants of its thermostability. Extremophiles, 7, 111–122. [DOI] [PubMed] [Google Scholar]
- CCP4 (1994) The CCP4 suite: programs for protein crystallography. Acta Crystallogr. D, 50, 760–763. [DOI] [PubMed] [Google Scholar]
- Dame R.T. and Goosen,N. (2002) HU: promoting or counteracting DNA compaction? FEBS Lett., 529, 151–156. [DOI] [PubMed] [Google Scholar]
- Esser D., Rudolph,R., Jaenicke,R. and Bohm,G. (1999) The HU protein from Thermotoga maritima: recombinant expression, purification and physicochemical characterization of an extremely hyperthermophilic DNA-binding protein. J. Mol. Biol., 291, 1135–1146. [DOI] [PubMed] [Google Scholar]
- Grove A. and Lim,L. (2001) High-affinity DNA binding of HU protein from the hyperthermophile Thermotoga maritima. J. Mol. Biol., 311, 491–502. [DOI] [PubMed] [Google Scholar]
- Grove A. and Saavedra,T.C. (2002) The role of surface-exposed lysines in wrapping DNA about the bacterial histone-like protein HU. Biochemistry, 41, 7597–7603. [DOI] [PubMed] [Google Scholar]
- Grove A., Galeone,A., Mayol,L. and Geiduschek,E.P. (1996) Localized DNA flexibility contributes to target site selection by DNA-bending proteins. J. Mol. Biol., 260, 120–125. [DOI] [PubMed] [Google Scholar]
- Hodges-Garcia Y., Hagerman,P.J. and Pettijohn,D.E. (1989) DNA ring closure mediated by protein HU. J. Biol. Chem., 264, 14621–14623. [PubMed] [Google Scholar]
- Holbrook J.A., Tsodikov,O.V., Saecker,R.M. and Record,M.T., Jr. (2001) Specific and non-specific interactions of integration host factor with DNA: thermodynamic evidence for disruption of multiple IHF surface salt-bridges coupled to DNA binding. J. Mol. Biol., 310, 379–401. [DOI] [PubMed] [Google Scholar]
- Huisman O., Faelen,M., Girard,D., Jaffe,A., Toussaint,A. and Rouviere-Yaniv,J. (1989) Multiple defects in Escherichia coli mutants lacking HU protein. J. Bacteriol., 171, 3704–3712. [DOI] [PMC free article] [PubMed] [Google Scholar]
- Jia X., Grove,A., Ivancic,M., Hsu,V.L., Geiduscheck,E.P. and Kearns,D.R. (1996) Structure of the Bacillus subtilis phage SPO1-encoded type II DNA-binding protein TF1 in solution. J. Mol. Biol., 263, 259–268. [DOI] [PubMed] [Google Scholar]
- Jones T., Zou,J., Cowan,S. and Kjelgaard,M. (1991) Improved methods for building protein models in electron density maps and the location of errors in these models. Acta Crystallogr. A, 47, 110. [DOI] [PubMed] [Google Scholar]
- Kamashev D. and Rouviere-Yaniv,J. (2000) The histone-like protein HU binds specifically to DNA recombination and repair intermediates. EMBO J., 19, 6527–6535. [DOI] [PMC free article] [PubMed] [Google Scholar]
- Kamashev D., Balandina,A. and Rouviere-Yaniv,J. (1999) The binding motif recognized by HU on both nicked and cruciform DNA. EMBO J., 18, 5434–5444. [DOI] [PMC free article] [PubMed] [Google Scholar]
- Kawamura S., Kakuta,Y., Tanaka,I., Hikichi,K., Kuhara,S., Yamasaki,N. and Kimura,M. (1996) Glycine-15 in the bend between two alpha-helices can explain the thermostability of DNA binding protein HU from Bacillus stearothermophilus. Biochemistry, 35, 1195–1200. [DOI] [PubMed] [Google Scholar]
- Khudyakov I. and Wolk,C.P. (1996) Evidence that the hanA gene coding for HU protein is essential for heterocyst differentiation in and cyanophage A-4(L) sensitivity of, Anabaena sp. strain PCC 7120. J. Bacteriol., 178, 3572–3577. [DOI] [PMC free article] [PubMed] [Google Scholar]
- Kissinger C.R., Gehlhaar,D.K. and Fogel,D.B. (1999) Rapid automated molecular replacement by evolutionary search. Acta Crystallogr. D, 55, 484–491. [DOI] [PubMed] [Google Scholar]
- Kleywegt G. and Jones,T. (1994) Voidoo. Acta Crystallogr. D, 50, 178–185. [DOI] [PubMed] [Google Scholar]
- Kleywegt G. and Jones,T. (1996) xdlMAPMAN and xdlDATAMAN- programs for reformatting, analysis and manipulation of biomacro molecular electron-density maps and reflection data sets. Acta Crystallogr. D, 52, 826–828. [DOI] [PubMed] [Google Scholar]
- Kobryn K., Lavoie,B.D. and Chaconas,G. (1999) Supercoiling-dependent site-specific binding of HU to naked Mu DNA. J. Mol. Biol., 289, 777–784. [DOI] [PubMed] [Google Scholar]
- Kobryn K., Naigamwalla,D.Z. and Chaconas,G. (2000) Site-specific DNA binding and bending by the Borrelia burgdorferi Hbb protein. Mol. Microbiol., 37, 145–155. [DOI] [PubMed] [Google Scholar]
- Laskowski R., MacArthur,M., Moss,D. and Thornton,J. (1993) PROCHECK: a program to check the stereochemical quality of protein structures. J. Appl. Crystallogr., 26, 283–291. [Google Scholar]
- Lavoie B.D., Shaw,G.S., Millner,A. and Chaconas,G. (1996) Anatomy of a flexer–DNA complex inside a higher-order transposition intermediate. Cell, 85, 761–771. [DOI] [PubMed] [Google Scholar]
- Li J.Y., Arnold-Schulz-Gahmen,B. and Kellenberger,E. (1999) Histones and histone-like DNA-binding proteins: correlations between structural differences, properties and functions. Microbiology, 145, 1–2. [DOI] [PubMed] [Google Scholar]
- Li S. and Waters,R. (1998) Escherichia coli strains lacking protein HU are UV sensitive due to a role for HU in homologous recombination. J. Bacteriol., 180, 3750–3756. [DOI] [PMC free article] [PubMed] [Google Scholar]
- Lorenz M., Hillisch,A. and Diekmann,S. (2002) Fluorescence resonance energy transfer studies of U-shaped DNA molecules. J. Biotechnol., 82, 197–209. [DOI] [PubMed] [Google Scholar]
- Lu X.J. and Olson,W.K. (2000) A-form conformational motifs in ligand-bound DNA structures. J. Mol. Biol., 300, 819–840. [DOI] [PubMed] [Google Scholar]
- Nagaraja R. and Haselkorn,R. (1994) Protein HU from the cyanobacterium Anabaena. Biochimie, 76, 1082–1089. [DOI] [PubMed] [Google Scholar]
- Nash H.A. (1996) The HU and IHF proteins: accessory factors for complex protein–DNA assemblies. In Lin,E.C.C. and Lynch,A.S. (eds), Regulation of Gene Expression in Escherichia coli. R.G.Landes Co., Austin, TX, pp. 150–179. [Google Scholar]
- Nicholls A., Sharp,K. and Honig,B. (1991) Protein folding and association: insights from the interfacial and thermodynamic properties of hydrocarbons. Proteins, 11, 281–296. [DOI] [PubMed] [Google Scholar]
- Otwinowski Z. and Minor,W. (1997) Processing of X-ray data collected in oscillation mode. Methods Enzymol., 276, 307–326. [DOI] [PubMed] [Google Scholar]
- Paull T.T., Haykinson,M.J. and Johnson,R.C. (1993) The nonspecific DNA-binding and -bending proteins HMG1 and HMG2 promote the assembly of complex nucleoprotein structures. Genes Dev., 7, 1521–1534. [DOI] [PubMed] [Google Scholar]
- Pontiggia A., Negri,A., Beltrame,M. and Bianchi,M.E. (1993) Protein HU binds specifically to kinked DNA. Mol. Microbiol., 7, 343–350. [DOI] [PubMed] [Google Scholar]
- Read R.J. (1986) Improved Fourier coefficients for maps using phases from partial structures with errors. Acta Crystallogr. A, 42, 140–149. [Google Scholar]
- Rice P.A. (1997) Making DNA do a U-turn: IHF and related proteins. Curr. Opin. Struct. Biol., 7, 86–93. [DOI] [PubMed] [Google Scholar]
- Rice P.A., Yang,S., Mizuuchi,K. and Nash,H.A. (1996) Crystal structure of an IHF–DNA complex: a protein-induced DNA U-turn. Cell, 87, 1295–1306. [DOI] [PubMed] [Google Scholar]
- Saitoh F., Kawamura,S., Yamasaki,N., Tanaka,I. and Kimura,M. (1999) Arginine-55 in the beta-arm is essential for the activity of DNA-binding protein HU from Bacillus stearothermophilus. Biosci. Biotechnol. Biochem., 63, 2232–2235. [DOI] [PubMed] [Google Scholar]
- Sayre M.H. and Geiduschek,E.P. (1990) Effects of mutations at amino acid 61 in the arm of TF1 on its DNA-binding properties. J. Mol. Biol., 216, 819–833. [DOI] [PubMed] [Google Scholar]
- Shindo H., Furubayashi,A., Shimizu,M., Miyake,M. and Imamoto,F. (1992) Preferential binding of E.coli histone-like protein HU alpha to negatively supercoiled DNA. Nucleic Acids Res., 20, 1553–1558. [DOI] [PMC free article] [PubMed] [Google Scholar]
- Tanaka H., Yasuzawa,K., Kohno,K., Goshima,N., Kano,Y., Saiki,T. and Imamoto,F. (1995) Role of HU proteins in forming and constraining supercoils of chromosomal DNA in Escherichia coli. Mol. Gen. Genet., 248, 518–526. [DOI] [PubMed] [Google Scholar]
- Tanaka I., Appelt,K., Dijk,J., White,S.W. and Wilson,K.S. (1984) 3-Å resolution structure of a protein with histone-like properties in prokaryotes. Nature, 310, 376–381. [DOI] [PubMed] [Google Scholar]
- Thomas J.O. and Travers,A.A. (2001) HMG1 and 2 and related ‘architectural’ DNA-binding proteins. Trends Biochem. Sci., 26, 167–174. [DOI] [PubMed] [Google Scholar]
- White S.W., Appelt,K., Wilson,K.S. and Tanaka,I. (1989) A protein structural motif that bends DNA. Proteins, 5, 281–288. [DOI] [PubMed] [Google Scholar]
- White S.W., Wilson,K.S., Appelt,K. and Tanaka,I. (1999) The high-resolution structure of DNA-binding protein HU from Bacillus stearothermophilus. Acta Crystallogr. D, 55, 801–809. [DOI] [PubMed] [Google Scholar]
- Winn M.D., Isupov,M.N. and Murshudov,G.N. (2001) Use of TLS parameters to model anisotropic displacements in macromolecular refinement. Acta Crystallogr. D, 57, 122–133. [DOI] [PubMed] [Google Scholar]
- Wojtuszewski K., Hawkins,M.E., Cole,J.L. and Mukerji,I. (2001) HU binding to DNA: evidence for multiple complex formation and DNA bending. Biochemistry, 40, 2588–2598. [DOI] [PubMed] [Google Scholar]
- Yang C.C. and Nash,H.A. (1989) The interaction of E.coli IHF protein with its specific binding sites. Cell, 57, 869–880. [DOI] [PubMed] [Google Scholar]
- Yang S.W. and Nash,H.A. (1995) Comparison of protein binding to DNA in vivo and in vitro: defining an effective intracellular target. EMBO J., 14, 6292–6300. [DOI] [PMC free article] [PubMed] [Google Scholar]