Abstract
Chromosome movement is critical for homologous chromosome pairing during meiosis. A prominent and nearly universal meiotic chromosome reorganization is the formation of the bouquet, characterized by the close clustering of chromosome ends at the nuclear envelope. We have used a novel method of in vitro culture of rye anthers combined with fluorescent in situ hybridization (FISH) detection of telomeres to quantitatively study bouquet formation. The three-dimensional distribution of telomeres over time was used to obtain a quantitative profile of bouquet formation intermediates. The bouquet formed through a gradual, continuous tightening of telomeres over ∼6 h. To determine whether the motion of chromosomes was random or directed, we developed a computer simulation of bouquet formation to compare with our observations. We varied the diffusion rate of telomeres and the amount of directional bias in telomere movement. In our models, the bouquet was formed in a manner comparable to what we observed in cultured meiocytes only when the movement of telomeres was actively directed toward the bouquet site, whereas a wide range of diffusion rates were permitted. Directed motion, as opposed to random diffusion, was required to reproduce our observations, implying that an active process moves chromosomes to cause telomere clustering.
INTRODUCTION
Meiosis is a specialized cell division in which diploid cells halve their chromosome number, allowing fertilization to regenerate the diploid number. It is an essential process in all sexually reproducing eukaryotes. Two major aspects of meiosis, the reduction of chromosome number and recombination between parental genomes, are made possible through the pairing of homologous chromosomes during meiotic prophase. Because cells usually begin meiosis with their chromosomes randomly distributed, movement must occur in order for chromosomes to pair. In some organisms, especially those with large genomes, the range of this movement can be on the order of tens of microns. The mechanisms that generate this movement, however, are unknown.
Another reorganization of meiotic chromosomes is bouquet formation, the clustering of chromosome ends at the nuclear envelope (reviewed in Dernburg et al., 1995; Zickler and Kleckner, 1998; Scherthan, 2001). The bouquet coincides with homologous pairing (Bass et al., 2000). It is highly conserved, occurring in most animal, plant, and fungal species studied. Because all chromosome ends are brought into close proximity, the bouquet decreases the minimum expected distance between homologous sequences. The bouquet's universality, timing, and effects on chromosome organization strongly suggest that it plays a central role in bringing homologous chromosomes together.
The mechanism of bouquet formation is unknown. Numerous studies (Thompson-Coffe and Zickler, 1994; Bass et al., 1997; Jin et al., 1998; Carlton and Cande, 2002; Cowan et al., 2002) have shown that bouquet formation is independent of preexisting chromosome organization. The bouquet appears to form in a two-step process: telomeres first attach to the nuclear envelope and subsequently cluster (Zickler, 1977; Rasmussen and Holm, 1978; Scherthan et al., 1996; Bass et al., 1997, 2000). An interesting question is whether directed movement is required or whether random diffusion of chromosomes suffices to cluster telomeres. In vivo observations in budding yeast (Marshall et al., 1997; Heun et al., 2001) and Drosophila (Marshall et al., 1997; Vazquez et al., 2001) suggest that diffusion is the only contribution to interphase chromosome movement. Diffusional motion also appears to cause the approach of homologous loci during somatic chromosome pairing in Drosophila embryonic nuclei (Fung et al., 1998).
Two observations suggest mechanisms that might allow bouquet formation by diffusion: First, small clusters of telomeres are seen before complete bouquet formation, indicating that telomeres can aggregate (Cowan and Cande, 2002a; Golubovskaya et al., 2002). Second, in animal (Moens, 1969) and fungal (Chikashige et al., 1994) cells, the bouquet is located next to the centrosome or spindle pole body, whereas in plants the bouquet is polarized with respect to plastids (Hiraoka, 1949) and is located opposite the major concentration of microtubules (Cowan et al., 2002), suggesting that a region of the nucleus becomes specialized to recruit telomeres. A bouquet could theoretically arise from diffusional motion with these constraints, telomere aggregation, and/or a predetermined bouquet site, in operation.
We analyzed bouquet formation through quantitative measurements of telomere position over time by culturing rye anthers (Cowan and Cande, 2002a, 2002b). Rye is an ideal system for quantitative studies of bouquet formation: all the meiotic cells progress in synchrony, allowing direct comparison between a large number of nuclei; the chromosomes take on distinct morphologies as prophase progresses, allowing precise staging; and the nuclei are large, minimizing the error in telomere position relative to the nuclear volume.
The time courses were compared with computer simulations of telomere clustering. By modeling both of the above constraints, we determined conditions under which a bouquet could be formed. Random diffusion never reproduced our observation of telomere clustering kinetics; only by introducing directed movement could we observe synchronous clustering in the time dictated by our anther culture experiments. This leads us to conclude that an active bias in the movement of telomeres is a necessary part of bouquet formation.
MATERIALS AND METHODS
Growth of Rye Plants
Rye plants (Secale cereale cv. Blanco) were grown in the greenhouse or outdoors (Berkeley, CA). The time between harvest and culture time 0 was kept to a minimum, always <60 min. Anthers were dissected out of their florets onto dry glass microscope slides. Only the larger, pedicillate floret was used in all experiments.
Anther Culture
Anthers were removed from the floret, and the three anthers were cut longitudinally, giving rise to a total of six anther halves. On bisecting an anther, the two halves were immediately placed into culture medium (described in Cowan and Cande, 2002a, 2002b). For investigating synchronous progression, cultured anthers were derived from a single anther, whereas the time 0 anther was from a second anther of the same floret (see Figure 1A). Synchrony at harvest time was assessed by fixing anthers immediately upon removal from the plant. For time course experiments, one anther half was fixed immediately (0 h), whereas the remaining five halves were cultured and fixed at 2-h intervals (2, 4, 6, 8, and 10 h) or 1-h intervals (1, 2, 3, 4, and 5 h). The anthers were placed randomly into culture wells. No more than 10 individual experiments were performed at one time, in order to minimize time from harvest to culture. Culture plates were placed on a rotary shaker at 80 rpm and covered to keep the dishes dark. After the specified culture time, culture medium was removed and fixation was performed as described below. Anther culture, time 0 fixations, and subsequent cultured anther fixations were performed in flat-bottom, 96-well plates, using 50 μl solution per well and one anther half per well. We have successfully used a variation on this method to determine the effects of various microtubule-depolymerizing drugs on bouquet formation (Cowan and Cande, 2002b). Such experiments indicate that meiotic cells can progress for at least 18 h in culture without defects.
Figure 1.
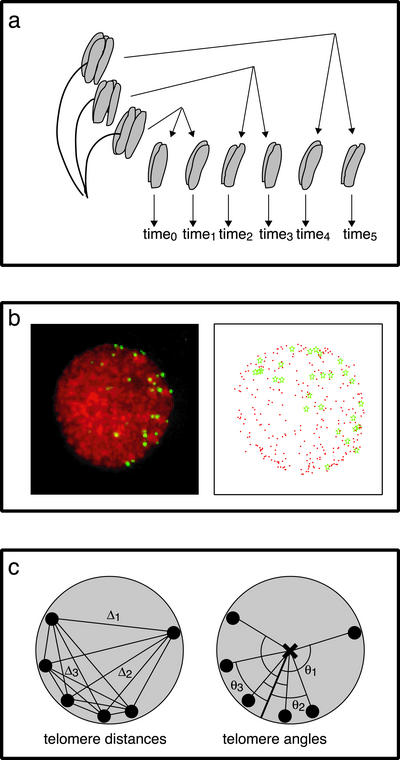
Methods used in quantitative analysis of telomere positions. (a) Anther culture methodology. One anther half was fixed immediately; synchronous anther halves were placed into culture and allowed to progress and then fixed at regular intervals (1 or 2 h). (b) Determining telomere distribution in rye meiotic nuclei. A representative early meiotic nucleus is shown (left). Telomeres (green) were detected by FISH and chromatin (red) was stained with DAPI. A three-dimensional model (right) of the nucleus was created, consisting of xyz coordinates, allowing for telomere distance and angle measurements. (c) Diagram of the measurements used to assess telomere distributions. The telomere distance (left) is the mean of all pairwise telomere–telomere distances in a nucleus. The telomere angle (right) is the mean of the angles created between each individual telomere and the mean telomere position through the center of the nucleus. Telomeres are shown as black circles, the mean telomere position is indicated with a white circle, and the center of the nucleus is marked with an “×.” For clarity, a subset of the 28 rye telomeres is diagrammed. Telomere–telomere distances are indicated by Δ (right); telomere-mean telomere angles are indicated by θ (left).
Fluorescence In Situ Hybridization
Meiocytes and associated cells were embedded in 5% acrylamide polymerized between two coverslips. Fluorescence in situ hybridization (FISH) was carried out based on the protocol used by Bass et al. (1997). The following incubations were performed twice for ∼15 min each: 1× SSC, 1× buffer A, 20% formamide; 2× SSC, 35% formamide; and 2× SSC, 50% formamide. Buffer A consists of 15 mM Pipes-NaOH (pH 6.8), 80 mM KCl, 20 mM NaCl, 0.5 mM EGTA, 2 mM EDTA, 0.15 mM spermine tetra-HCl, 0.05 mM spermidine, and 1 mM DTT (Dernburg et al., 1996). Coverslips were then incubated in hybridization solution (2× SSC, 50% formamide plus 200 ng probe) for 30 min, heated at 95°C for 5.5 min, and transferred to a humid chamber for incubation at RT overnight. Coverslips were washed in 1× PBS. Chromatin was stained with 3 μg/ml 4′,6-diamidino-2-phenylindole (DAPI). Samples were mounted in glycerol. The FISH probe used to detect telomeres was (5′-{CCCTAAA}4-3′) with either 5′ Cy-5 or Texas Red conjugation (Genset, Paris, France).
Microscopy
Images were acquired with an Applied Precision, Inc. (Issaquah, WA) DeltaVision system on an Olympus IX70 inverted microscope (Olympus, Melville, NY). A 40×, 1.35 NA UApo oil immersion lens was used for all experiments. Cells were imaged in three dimensions (x, y, z); z-axis sections were collected at 0.2-μm spacing. Images were deconvolved using a conservative algorithm (Chen et al., 1996) by the decon3d program in the DeltaVision suite. Approximately 50 cells were examined for each time point, although only a subset was used for quantitative analyses (detailed in the text). Meiotic stages were classified based on chromatin appearance, in accordance with classical definitions (Wilson, 1925; Zickler and Kleckner, 1998)
Modeling and Quantitations
Models of nuclei were created using the DeltaVision/softWoRx 3DModel program (Applied Precision, Inc.). The nuclear periphery was modeled by tracing the outer edge of DAPI-stained chromatin. The maximum intensity pixel of 3D FISH signals was picked for telomere positions (Figure 1B). 3DModel data was saved as text and either imported into MATLAB (version 5.1.0.420, The MathWorks, Inc., Natick, MA) or processed by Perl programs (all code available by request) for analysis. Two measurements were calculated to assess the degree of telomere clustering: 1) all pairwise telomere-to-telomere distances, referred to as telomere distances and 2) the angular separation of each telomere from the axis formed by the mean position of all telomeres and the center of the nucleus, referred to as telomere angles (Figure 1C). Distance measurements were normalized to the nuclear radius. Telomere distances and telomere angles are presented as the distribution of means of individual nuclei in a given sample: all possible distances/angles were calculated for a single nucleus: the mean of the distances/angles for a single nucleus was obtained; the mean distances from all nuclei in a sample were combined. It is the distribution (box-whisker plots) or mean (t test) of this data that is plotted. In the box-whisker plots, the horizontal line through the box marks the median value. The lines above and below the boxes extend to the entire range of observed measurements. The box regions above and below the median line contain the measurements 25% above and below the median, respectively. Differences were assessed at 99.9% confidence (p <0.001) using an unequal variance Student's t test, unless indicated otherwise.
Simulation of Telomere Clustering
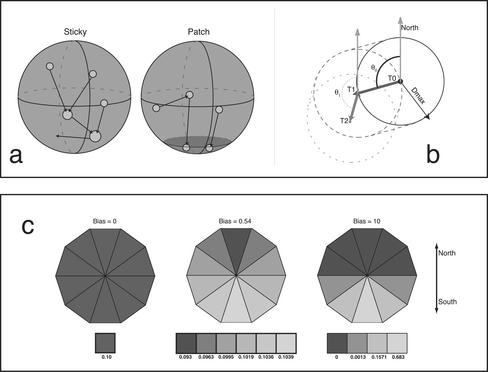
A computer simulation of bouquet formation was programmed in the C language (source code available by request). The simulation calculates the change in position of 28 diffusing points (rye telomeres) on a spherical surface (nuclear envelope) over time. The dimensions of the simulation were specified by setting the simulated nuclear radius to the radius of rye leptotene nuclei (8 μm) and telomere size to the signal width of rye telomeres as detected by FISH (0.3 μm). The telomeres are constrained to always lie at the nuclear surface, because telomeres are always observed at the nuclear periphery in rye meiocytes. (In the course of our experiments, we recorded 7328 telomeres in 264 nuclei; the mean radial distance from the nuclear envelope was 0.81 μm, with an SD of 0.79 μm; the median distance was 0.57 μm.) All telomeres begin in one hemisphere (designated the South pole) as in the Rabl configuration; the initial radial distribution of telomeres around the North–South axis is random. At each time step, each telomere simultaneously moves to a new point on the sphere's surface within a surrounding circle of radius Dmax. Diffusion constants (D) for simulated telomere motion were obtained for each value of Dmax used by solving the equation for two-dimensional random walks relating mean squared displacement to time elapsed (〈d2〉Δt = 4DΔt; Qian et al., 1991; Smith et al., 1999) for a large sample size (10,000 simulated telomeres) and defining one time step to be 1 s.
Two types of model (termed “Sticky” and “Patch”) were simulated, based on two possible constraints on telomere clustering. In the Sticky model, if the distance separating two telomeres becomes less than their combined radii, they coalesce into a single cluster that combines the volumes of both telomeres and is thereafter treated as a single telomere. In the Patch model, telomeres diffuse freely until they encounter a patch of surface at the South pole, representing a hypothetical telomere-recruiting region; after encounter, they remain fixed in position. The size of the patch was chosen to reflect the proportion of the nuclear surface occupied by telomeres at the bouquet stage in rye, roughly 5%. All simulations were run for 43,200 time steps (12 h).
To implement directional bias (b) in the simulations, the direction of motion was chosen at each step from either a uniform distribution (for b = 0, or no bias) or from a Gaussian distribution with a SD of 1/b centered around –90°. An initial random value (A) is picked from the interval {–1... 1}, centered around 0, with SD 1/b. The angle of motion is then given by (A – 1)*90°. An increasing value for b will thus lead to an increasing chance of movement toward the lower (South) nuclear pole (see Figure 5). Directed motion velocities for a given (D, b) combination were obtained by solving the equation 〈d2〉Δt = 4DΔt + v2Δt2 (Qian et al., 1991) for v (the directed velocity) by subtracting the nonbiased profile of 〈d2〉Δt (where v = 0) from the biased 〈d2〉Δt. The slope of the square root of the resulting curve is equal to v. The mean pairwise distance of all telomeres in the nucleus was recorded at each time step. The number of steps required for complete bouquet formation was also recorded for each run. Each simulation was run with identical settings (except for rerandomized telomere starting points) 100 times and the results averaged, to reduce sampling errors.
Figure 5.
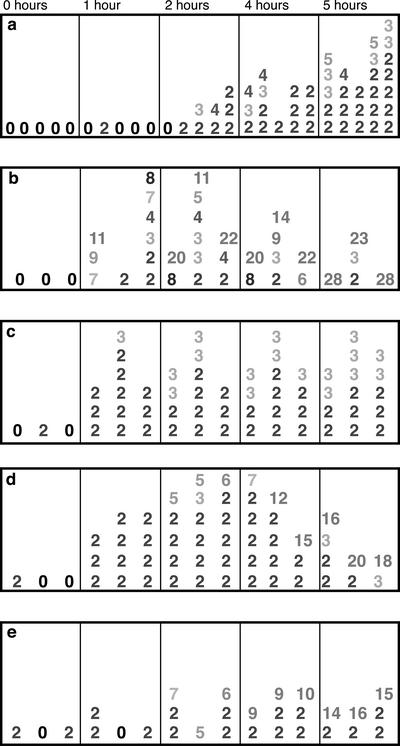
Detection of mini-clusters at 1-h intervals in culture and in simulated nuclei. (a) Frequency and size of observed telomere mini-clusters. Each column represents a single nucleus at the time point indicated. Each number represents a single mini-cluster, and the number indicates how many telomeres were found in the minicluster. Data from five nuclei are shown for each time point. (b–e) Data from simulated nuclei at the same time points are shown for four conditions: (b) D = 4.1 × 10⁻² μm2/s, b = 0; (c) D = 2.4 × 10⁻² μm2/s, b = 0; (d) D = 2.4 × 10⁻⁴ μm2/s, b = 0.58; (e) D = 2.4 × 10⁻⁷ μm2/s, b = 10. Three nuclei were measured in each condition; data from each nucleus is listed in the same column position across the time points.
RESULTS
All Meiocytes in a Rye Floret Proceed Synchronously through Bouquet Formation in Culture
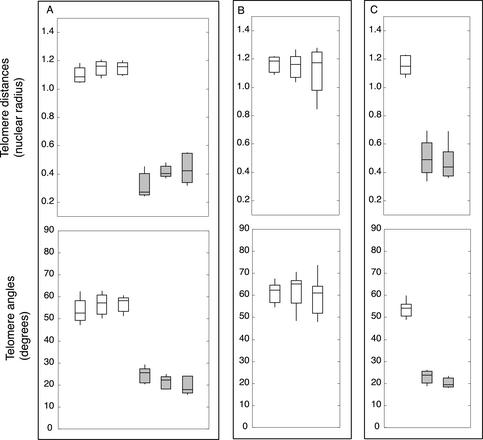
Before investigating the kinetics of telomere clustering, it was necessary to show that meiotic cells in cultured rye anthers were synchronous with respect to telomere distribution. Our method of flower dissection for anther culture is shown in the diagram in Figure 1A, and the parameters we measured to determine synchrony of telomere behavior in culture are shown in Figure 1, B and C. We established that all meiocytes in one anther showed the same distribution of telomere distances and angles and thus could be considered equivalent. A single anther fixed immediately (0 h) and an anther cultured for the duration of a typical time course experiment (10 h) were analyzed. Meiotic nuclei from each anther were arbitrarily partitioned into three groups of five nuclei each. The mean telomere distances and angles from the three groups of nuclei were not significantly different (Figure 2A); uncultured and cultured anthers were similar in this regard.
Figure 2.
Synchrony of meiotic prophase in vivo and in vitro. Synchrony was judged by telomere distances (top) and telomere angles (bottom). Boxes include the 2nd and 3rd quartiles (25th through 75th percentiles), the horizontal line through the box is the median, and whiskers extend to the range. (a) Meiotic nuclei are synchronous throughout a single anther. Three sets of five nuclei were randomly selected from a single anther fixed immediately (0 h, white boxes) and after 10 h in culture (gray boxes). (b) Meiotic nuclei from one floret are synchronous. The three anthers of a single floret were fixed immediately (0 h). Distributions represent 10 nuclei per anther. (c) Dissected anthers progress synchronously in vitro. One anther was fixed immediately (0 h, white box, n = 10); two anther halves were cultured for 10 h (gray boxes, n1 = 9, n2 = 10).
We determined that the three anthers from a single floret were synchronous with each other. Anthers were fixed immediately, and telomere distances and angles were determined for a population of nuclei from each of the anthers. The distribution of mean telomere distances and angles from the anthers were not significantly different (Figure 2B). Our controls thus confirmed that a single rye floret provided a highly synchronous population of meiotic cells.
We also confirmed the ability of the bisected halves of a single anther to remain synchronous with each other when placed into culture. Single anthers were split longitudinally, and the two resulting halves cultured for up to 10 h. To ensure that such anthers progressed through meiotic prophase, an anther from the same floret was fixed immediately (0 h). Telomere distances and angles were determined for 10–15 nuclei from each anther half. There was not a significant difference in distances or angles between the two cultured anther halves, though both differed significantly from the 0 h anther (Figure 2C). Thus, both anther halves progressed at the same rate in culture. In our previous anther culture experiments, we found that the interval from premeiotic interphase to the bouquet, corresponding to leptotene, could be completed in 10–16 h. Importantly, the duration of leptotene that we determined in culture is in agreement with that obtained by Bennett et al. (1971) for the duration of rye meiotic stages in vivo (15.4 h). Anther culture was therefore demonstrated to satisfy requirements for measuring kinetics of telomere clustering in time course experiments: all meiocytes within an anther and between different anther halves from the same floret are directly comparable to each other. This fact underscores that bouquet formation in rye is a highly regulated process.
Time Course Analysis of Bouquet Formation
We investigated telomere distributions in nuclei of cultured anthers with the objective of measuring the kinetic parameters of bouquet formation. Successful time course experiments allowed us to make several observations about the process of telomere clustering.
Meiotic Cells in the Process of Bouquet Formation Display an Increased Range of Telomere Distributions
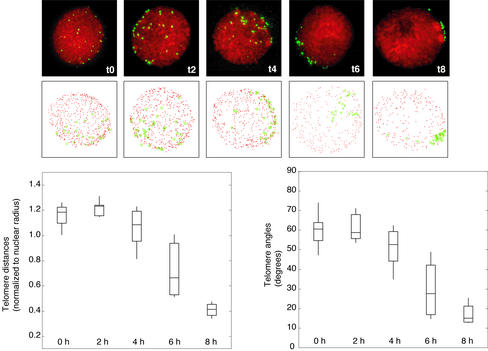
We performed FISH to detect telomere sequences in cultured rye anthers at 1-h time points. Telomere distances and angles remained relatively constant during the first several hours in culture and exhibited a narrow distribution of 1–1.3 nuclear radii or 45–75° (Figure 3), characteristic of random points placed on a hemispheric surface (our unpublished results). As mean telomere distances and angles decreased over time, however, the range of mean distances and angles increased. In anthers with bouquet intermediates, the degree of telomere clustering could vary slightly within the population. However, the start and end points of the process were tightly coordinated, as shown by the lack of outlying observations near the beginning (0 or 2 h) or the end (8 h) of culture. We observed that mean telomere distances and angles increased slightly immediately before evidence of the onset of telomere clustering (indicated by the earliest significantly different telomere distance and angle distributions) in many experiments (see Figure 2B). Telomere distributions at the time point immediately preceding telomere clustering showed the maximum distances and angles for a given time course.
Figure 3.
Kinetics of telomere clustering shown by plotting mean telomere distribution at 2-h intervals. (a) Representative nuclei after 0, 2, 4, 6, and 8 h in culture (top) and three-dimensional models of the nuclei (bottom). Telomeres (green) were detected using an oligonucleotide probe to the telomere repeat; chromatin (red) was stained with DAPI. In the models, red dots indicate the nuclear periphery and green stars show telomere position. (b) Distribution of mean telomere distances (left) and telomere clustering angles (right). Boxes include the 2nd and 3rd quartiles (25th through 75th percentiles), the horizontal line through the box is the median, and vertical lines extend to the range. Distributions represent 10 nuclei per time point.
Bouquet Formation Is Completed in ∼6 h
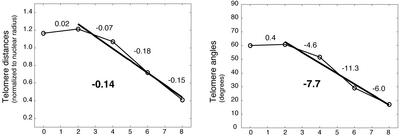
To measure the average rate of telomere clustering, we determined the distribution of mean distances of telomere signals in relation to the time elapsed from 0 h (see MATERIALS AND METHODS). Initiation of telomere clustering could be observed in the transition from constant to decreasing mean telomere distances. The completion of telomere clustering was indicated by the cessation of decreasing telomere distance distributions. A bestfit line was interpolated (using the least-squares method) through the mean telomere distances during clustering (Figure 4). Times corresponding to the maximum (time1) and minimum (time2) distances and angles were used to determine the corresponding time values (x-axis), and the difference between time1 and time2 indicated the time required for bouquet formation. Telomeres were found to progress from an unclustered arrangement to a fully clustered organization in ∼6.3 ± 0.5 h (the mean and SD of four time course experiments). The slope of the best-fit line, an estimate of the rate of decrease in mean pairwise distance, was calculated to be –0.14 nuclear radii (∼1.1 μm) per hour (Figure 4). To estimate a lower bound on individual telomere velocity, we assumed a constant speed and highly constrained telomere movement in a straight path toward the midpoint of the telomere distribution on the nuclear surface. Because the final location of the bouquet is not predicted by the initial location of the telomeres (Cowan et al., 2002), at least some telomeres may have to travel an entire half-circumference of the nucleus. The minimum rate of telomere movement in rye, given these constraints, is 3.75 μm/h.
Figure 4.
The rate of change of telomere distributions during bouquet formation in rye. The rates were determined from Figure 3. Line equations were calculated for the given time intervals based on the mean telomere distance and angle determined for each time point. The slope of the line is given. The clustering interval (bold line) includes only time points that showed a significant difference from the previous and/or following time point, indicating a change in telomere distribution. The clustering interval line equation was used to estimate the duration of telomere clustering (as described in the text). In this time course experiment, telomere clustering was found to occur in 5.9–6.0 h (calculated from distance and angle distributions, respectively).
Characterization of Telomere Subclusters
During early stages of clustering, telomeres were often associated in several small clusters (herein referred to as “mini-clusters”) around the nuclear periphery (Figure 5a; 2 and 4 h). To quantitate the extent of partial clustering observed, we calculated the distances between each telomere and its nearest neighboring telomere; clusters were defined by nearest-neighbor distances <0.125 times the nuclear radius (∼1 μm), based on visual comparisons of nuclei with and without mini-clusters. There was a marked increase in the number of mini-clusters per nucleus over time, although clusters were most frequently composed of only two telomeres. It is unlikely that the mini-clusters are due to sister chromatid separation rather than telomere aggregation, because the total number of telomere FISH signals in the nuclei analyzed for mini-clusters (26–28) was roughly equivalent to the number of chromosome ends (28) in the rye genome (2n = 14). Larger mini-clusters, consisting of 3–6 telomeres, were found as clustering progressed. However, not all telomeres were in mini-clusters at late time points, indicating that at least some telomeres enter the bouquet individually.
Computer Simulations of Bouquet Formation
Drawing from ideas in Dorninger et al. (1995), we used computer simulation to determine what mechanisms could account for our observations. In particular, we were interested to know whether directed motion of telomeres, as opposed to random diffusion, was a requirement for telomere clustering, and if so, what its magnitude would have to be. We simulated two hypothetical possibilities (see Figure 6). In one (the Sticky model), telomeres diffusing at the nuclear periphery form larger and larger subclusters through cumulative aggregation, until finally all the telomeres are in one cluster. In the other (the Patch model), telomeres diffuse around the nuclear periphery until they encounter a predefined area at one pole. We varied two parameters in both models: D, the diffusion constant, which reflects the speed of telomere movement; and b, the degree to which movement is biased toward one nuclear pole, which is toward the predefined bouquet site in the Patch model. Results from the simulations are summarized in Table 1.
Figure 6.
Explanation of the simulation. (a) Cartoon of the two models, Sticky (left) and Patch (right). In the Sticky model, telomeres (circles) collide and coalesce until the bouquet is complete (all telomeres have coalesced into one cluster). In the patch model, telomeres move along the surface until they encounter the bouquet site (shading), at which point they cease motion. (b) Schematic of two steps of a telomere in the simulation. The telomere at T0 takes one step anywhere within the circle defined by the maximum distance (Dmax). The direction of motion is chosen by the angle θ. The probability of choosing a given θ is governed by the bias value (see c below). At T1, the bounding circle has shifted, a new θ is chosen, and another step is taken. (c) Illustration of the effect of increasing bias on the direction of motion of telomeres in the simulation. For ease of illustration the space of possible angles is divided into 10 wedges, and the probability of choosing a step into a given wedge is indicated by shade; the actual probabilities in the simulation are continuous. Probabilities were calculated by simulating 106 total steps for each bias value. With zero bias (left), the probability of choosing any direction is the same. Increasing the bias to 0.54 (center) results in a very slight increase in the probability of motion toward the bouquet pole, but allows normal bouquet completion for D = 2.4 μm2/s. A bias value of 10.0 (right) moves telomeres almost directly toward the South pole and allows timely bouquet completion with much lower diffusion constants.
Table 1.
Statistics from the computer simulation of bouquet formation
|
Sticky
|
Patch
|
|||||||
|---|---|---|---|---|---|---|---|---|
| 1 | 2 | 3 | 4 | 1 | 2 | 3 | 4 | |
| Diffusion Constant (μm2/sec) | 4.1 × 10⁻² | 2.4 × 10⁻⁴ | 2.4 × 10⁻⁴ | 2.4 × 10⁻⁷ | 7.6 × 10⁻² | 2.4 × 10⁻⁴ | 2.4 × 10⁻⁴ | 1.5 × 10⁻⁷ |
| Bias Amount | 0 | 0 | 0.58 | 10 | 0 | 0 | 0.54 | 10 |
| Directed Motion Velocity (μm/sec.) | 0 | 0 | 8.0 × 10⁻⁴ | 9.8 × 10⁻⁴ | 0 | 0 | 8.7 × 10⁻⁴ | 7.9 × 10⁻⁴ |
| Mean Completion Time (Hours) | 6.13 | NF | 6.58 | 6.38 | 6.36 | NF | 6.30 | 6.22 |
| Std.Dev. (Minutes) | 179.9 | 0.00 | 43.2 | 7.8 | 122.5 | 0.00 | 48.2 | 12.7 |
| Clustering Slope (μm/hr.) | -1.6 | ND | -1.5 | -1.5 | -1.1 | ND | -1.2 | -1.0 |
Four diffusion constant/bias combinations were simulated for each model type. The velocity of directed motion, mean time to bouquet completion and slope of pairwise distance over time are shown. NF, not finished (the bouquet did not form in the number of timesteps allowed); ND, not determined.
Models without Directed Motion Do Not Form the Bouquet Correctly
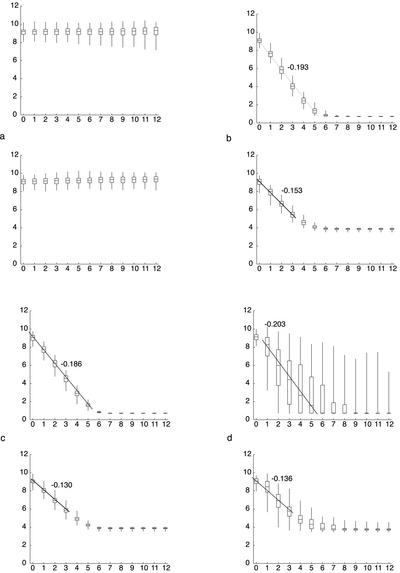
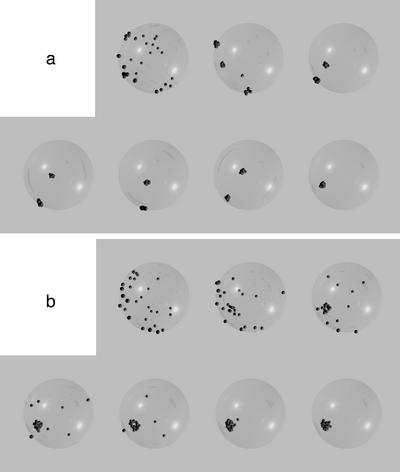
We first asked, for a bias value of 0, if any value for D would allow bouquet formation with a mean finishing time of 6.3 h, as observed in culture. At a diffusion constant previously reported for maize interphase chromatin, D = 2.4 × 10⁻⁴ μm2/s (M. Lowenstein and W. Marshall, personal communication; Marshall et al., 1997), there was no visible progress toward bouquet formation in either the Sticky or the Patch models (Figure 7a). By increasing the value of D, we could obtain values for Sticky (4.1 × 10⁻² μm2/s) and Patch (7.6 × 10⁻² μm2/s), which satisfied the requirement for mean finishing time. However, these values are two orders of magnitude larger than the value for maize interphase chromatin. Furthermore, although the mean time requirement could be satisfied, the standard deviations in finishing time differed significantly from our observations: 3 h for Sticky, and 2 h for Patch, vs. 0.5 h observed in culture. For the Patch simulation, Figure 7d indicates that at 6 h, although the simulations in the lower half of the distribution have completed the bouquet, the upper half still shows a distribution indistinguishable from the middle 50% of the 4-h time step (compare the 8- and 6-h time steps from Figure 7d, bottom). The Sticky simulation shows an even greater disparity (Figure 7d, top): some simulations have completed the bouquet by the 2-h time point, whereas at the 6-h time point, one quarter of the simulations have not progressed at all from the average state at 1 h. Finally, the stages before complete bouquet formation in these models often show one or two telomeres diametrically opposed from the rest of the clustered telomeres (Figure 8), a situation never observed in rye. The mean time to completion can therefore be driven down to 6.3 h by drastically increasing the diffusion constant, but this introduces drastic aberrations of synchrony and telomere organization. Taken together, these results indicate that the bouquet cannot form without directed telomere motion.
Figure 7.
Progression of simulated telomere clustering in the Sticky and Patch models for four conditions. Box-whisker diagrams display the distribution of pairwise distances for 100 simulated nuclei >12 h of simulation. In each pair of graphs, the results for the Sticky model are shown at top, and the Patch model at bottom. The following conditions are used: (a) Sticky, Patch: D = 2.4 × 10⁻⁴ μm2/s, b = 0; (b) Sticky: D = 2.4 × 10⁻⁴ μm2/s, b = 0.58; Patch: D = 2.4 × 10⁻⁴ μm2/s, b = 0.54 (c) Sticky: D = 2.4 × 10⁻⁷ μm2/s, b = 10; Patch: D = 1.5 × 10⁻⁷ μm2/s, b = 10 (d) Sticky: D = 4.1 × 10⁻² μm2/s, b = 0; Patch: D = 7.6 × 10⁻² μm2/s, b = 0.
Figure 8.
Raytraced models of simulation intermediates. (a) Bouquet formation in the Sticky model using D = 2.4 × 10⁻⁴ μm2/s, b = 0.58. (b) Bouquet formation in the Patch model using D = 2.4 × 10⁻⁴ μm2/s, b = 0.54.
Biased Motion Directly toward the Bouquet Pole Requires Slow Diffusion
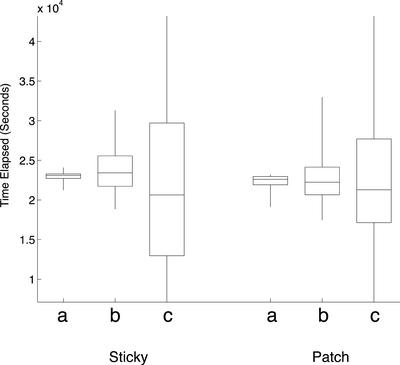
We next asked what the characteristics of telomere motion would need to be if the telomeres were strongly biased toward moving directly toward the bouquet site. We chose b = 10 to represent motion directly toward the bouquet site; the direction probability distribution for this value is shown in Figure 6c, right. To obtain a complete bouquet in 6.3 h, the diffusion constants required were 2.4 × 10⁻⁷ μm2/s for sticky, and 1.5 × 10⁻⁷ μm2/s for patch. These values for D are three orders of magnitude lower than the previously reported maize value. The SD in finishing time seen for these conditions are roughly 8 and 12 min for Sticky and Patch, respectively (Figure 9). Such tight synchrony is not observed in cultured rye anthers, indicating that the velocity of telomeres in rye is likely to be more variable.
Figure 9.
The distribution of time required to complete bouquet formation is displayed as box-whisker plots for the two models. Left: Sticky model; right: Patch model. Only the three conditions that resulted in complete bouquet formation are displayed. Although the median value for finishing time is similar for all conditions, the range increases with D. The conditions shown are, from left to right: Sticky: (a) D = 2.4 × 10⁻⁷ μm2/s, b = 10; (b) D = 2.4 × 10⁻⁴ μm2/s, b = 0.58; (c) D = 4.1 × 10⁻² μm2/s, b = 0; Patch: (a) D = 1.5 × 10⁻⁷ μm2/s, b = 10; (b) D = 2.4 × 10⁻⁴ μm2/s, b = 0.54; (c) D = 7.6 × 10⁻² μm2/s, b = 0.
Experimentally Determined Diffusion Constants Require a Small but Nonzero Bias
Under the diffusion constant of 2.4 × 10⁻⁴ μm2/s reported for maize interphase chromatin, the zero-bias condition did not result in any decrease in mean telomere distance over time; rather, a slight increase akin to that observed in the early period of the time courses was observed. By running the simulation with a variation of bias values, it was found that the relatively low b values of 0.58 (for Sticky), and 0.54 (for Patch), were necessary to cause complete bouquet formation in the required time, with a SD in finishing time of about 45 min (Figure 9). The bias amount represents a 0.46% difference per second in the likelihood of a telomere moving South (toward the bouquet) vs. North (away from the bouquet); the cumulative effect of this small bias value suffices to result in complete bouquet formation.
Both the High-bias, Slow-diffusion Condition and the Low-bias, Middiffusion Condition Represent the Same Directed Velocity of Telomeres
Bias in movement is equivalent to a directed velocity component to motion added on top of a random walk. If the random component of motion is known, the directed component can be calculated (see MATERIALS AND METHODS). To calculate this velocity component, the trajectories of one million simulated telomeres were recorded for each condition. For a given diffusion constant, the mean squared distance profile of nonbiased telomeres was subtracted from that of biased telomeres. The slope of the square root of the resulting curve gives v, the directed velocity component. Values of v for the conditions we simulated are shown in Table 1. The velocities required for both the high-bias, slow-diffusion and the low-bias, middiffusion models are very similar, averaging 3.1 μm/h, in good agreement with the value of 3.75 μm/h determined from the time course under the naive bouquet formation model of direct transit to the bouquet site. Decreases in mean pairwise distance for all simulation conditions were also measured as they were for the time course (Table 1).
Mini-Cluster Formation in the Sticky Models
Because mini-clusters of 2–5 telomeres were observed as a regular feature of bouquet formation in rye, we wanted to see if any of the Sticky models showed a similar profile of minicluster formation. Statistics on the number of telomeres per cluster were recorded for all simulation runs. Typical profiles are shown in Figure 4 for the four D/b permutations used; three separate simulations are shown for each condition. The three conditions that form the bouquet in 6.3 h (high diffusion, zero bias; medium diffusion, low bias; and low diffusion, high bias) show fewer mini-clusters than both the time course data, and the one condition that does not form the bouquet (medium velocity, no bias). None of these three conditions show a steady rise in the number of small mini-clusters, as displayed by the time course nuclei.
DISCUSSION
We have combined an analysis of the kinetics of telomere clustering in rye with computer simulations of telomere movement to determine the nature of the forces responsible for formation of the meiotic bouquet. To our knowledge this is the first quantitative study of bouquet formation intermediates. Our data suggest that telomere clustering requires directionally biased telomere movements.
Anther culture was an effective means of analyzing changes in telomere distributions in vivo. The culture method we have developed allowed normal progression of meiosis with reproducible timing of events. Meiotic cells in very early prophase were repeatedly able to progress to the bouquet stage after 8 h of culture; at time points <8 h, telomere clustering intermediates were observed. All cells in anthers that were split longitudinally and cultured separately remained developmentally synchronous with respect to telomere distribution and meiotic stage.
Transition from the Rabl Configuration to the Bouquet
Rye exhibits a strong Rabl organization (Rabl, 1885) in somatic and premeiotic cells, which results in telomere polarization before the onset of bouquet formation (Fussell, 1987; Cowan et al., 2001). This places telomeres in close proximity to the inner face of the nuclear envelope. Our observations confirmed the close association of telomeres with the nuclear envelope at all meiotic stages (see MATERIALS AND METHODS). Telomere-nuclear envelope associations imposed by the Rabl organization and the bouquet are likely to be mechanistically different, because meiotic cells appear to use axial element extensions to anchor chromosome ends in the membrane (Esponda and Giménez-Martín, 1972). Bouquet formation does not rely on a previous organization of chromosomes: we have previously shown that telomeres of recently created telocentric chromosomes, and interstitial telomeres on a ring chromosome, are both recruited to the bouquet in maize (Carlton and Cande, 2002), suggesting that telomeres act autonomously from the rest of the chromosome. In addition, several organisms do not exhibit any premeiotic Rabl organization yet form the bouquet (Dong and Jiang, 1998).
At time points immediately preceding evidence of telomere clustering (Figure 2, 2 h), we consistently noticed a shift toward slightly greater telomere distances and angles compared with previous time points (Figure 2, B and C). This change suggests a relaxation of the constrained telomere distribution of the Rabl organization and may be the first sign of bouquet-stage nuclear reorganization. After the constraint is released, telomeres would be free to diffuse randomly for an amount of time (<2 h) before the action of the telomere clustering mechanism. This stage also coincides with the clustering of nuclear pores on the nuclear envelope that occurs in many meiocytes during bouquet formation (Scherthan et al., 2000; Cowan et al., 2002).
A factor that may influence the movement of chromosomes in meiosis is the presence of one or more nucleoli. In maize, the nucleolus-organizing region is on one end of chromosome 6; this chromosome end is usually the last to reach the bouquet site (Bass et al., 1997), indicating that it takes longer to move. In simulations of chromosomes undergoing random diffusion, however, the presence or absence of a nucleolus (modeled as a void region of 10% the nuclear volume, which excluded chromosomes) caused no significant difference in the measured diffusion constant of telomeres (our unpublished results). We believe these data indicate that the nucleolus is a passive participant in bouquet formation, and does not appreciably constrain the movement of chromosomes other than those with nucleolus organizing regions.
The Time and Rate of Telomere Clustering: General Parameters
The time course data provided two quantitative measurements: the time taken for complete bouquet formation, and the rate of decrease of telomere distances. We found that the mean time to bouquet formation after the first sign of telomere clustering was 6.3 ± 0.5 h. To bring a telomere from the maximum prebouquet distance (i.e., 180° separated, or 23.6 μm across the nuclear envelope surface) to the bouquet site within 6.3 h, a velocity of 3.7 μm/h is required. In our simulations, we obtained a comparable value for all diffusion/bias combinations that resulted in correct bouquet formation (3.1 ± 0.4 μm/h). The close agreement between the two values gives us good reason to conclude that directed motion suffices for bouquet formation: diffusional motion of telomeres does not play a major role.
The mean pairwise distance between telomeres in the time course decreased at a rate of roughly –1.1 μm/h. As seen in Figure 7 and Table 1, the Sticky model gave results within 50% of this value, and the Patch model was within 12%. Because the measurements of pairwise distance decrease fit between the time course and the simulation, we have good reason to conclude that the directed velocity of telomeres in rye is similar to that in the simulations, about 3 μm/h.
Synchrony vs. Asynchrony during Bouquet Formation
A wider distribution of mean telomere distances and angles was observed for the time during which telomeres were progressively clustering, compared with pre- and postclustering distributions (Figures 2B and 3). The larger distributions suggested that some nonuniformity exists during telomere clustering. It is possible that meiotic nuclei progress asynchronously through bouquet formation; different initiation times for the onset of clustering might exist within a single anther. Alternatively, the disparities could result from differences between cells in the initial orientation of the Rabl axis with respect to the future bouquet axis.
The simulations without directed movement failed to form a bouquet in a manner consistent with our observations of rye. When a diffusion constant equal to or less than that observed in another grass (maize) is chosen for the simulation, there is zero progress made toward forming the bouquet in either model. By increasing the diffusion constant by more than two orders of magnitude, the correct mean finishing time of 6.3 h could be obtained, but this resulted in a loss of synchrony: a range of completion times running from 2 to >12 h was observed (Figure 9). This result was anticipated a priori for the Sticky case due to the self-limiting nature of bouquet formation by stochastic aggregation: as more telomeres join clusters, the likelihood of subsequent encounter between telomere clusters decreases.
Directed Velocity Allows Bouquet Formation under a Wide Range of Diffusion Constants
Under the maize diffusion constant of 2.4 × 10⁻⁴ μm2/s, a relatively small amount of bias was necessary to reproduce the observed behavior for both models. The bias level required in the simulations resulted in less than a 0.5% increase at each time step in the probability of a telomere's moving toward versus away from the bouquet site. At lower diffusion constants, a much greater bias value is required. However, when biased movement is reanalyzed as a directed velocity component added on top of random motion, the magnitude of the directed velocity is approximately the same between the two drastically different bias conditions; i.e., the bias level necessary is just that level which results in a directed velocity of about 3.1 μm/h. This indicates that the primary determinant of successful telomere clustering is likely to be the directed motion itself, and random diffusion is largely irrelevant, in contrast to what simulations have predicted for somatic homologous pairing in Drosophila (Fung et al., 1998).
Telomere Clustering Intermediates and Bouquet Formation
Telomere mini-clusters were observed immediately after the onset of clustering, suggesting that a Sticky-like mechanism is active for at least a limited time. However, runs of the Sticky model in which the bouquet forms on time exhibit larger mini-clusters than those actually observed. This disparity rules out a cumulative aggregation mechanism for bouquet formation. If aggregation between telomeres is a general feature of bouquet formation, then a process that limits the number of telomeres per cluster would be the most obvious way to reconcile the discrepancies between the models and the time course. One explanation could be that mini-clusters are formed by a process that compares homology and is generally limited to two chromosome arms at a time. The simplest interpretation, however, is that the mini-clusters we observe are not functionally involved in bouquet formation.
A Model of Bouquet Formation
Cytoskeleton-based molecular motors have been postulated to move telomeres to the bouquet (Sheldon et al., 1988; Loidl, 1990), although one such motor (Kar3p) required for successful meiosis (Bascom-Slack and Dawson, 1997) is dispensable for bouquet formation (Scherthan et al., 2001) in haploid yeast. We have previously shown that the bouquet is able to form in cultured rye meiocytes despite depolymerization of the cytoplasmic microtubule cytoskeleton induced by the drugs vinblastine or amiprophos methyl (Cowan and Cande, 2002a, 2002b). It is therefore unlikely that the mechanism of bouquet formation involves cytoplasmic microtubules and their associated motors, although the colchicine sensitivity of bouquet formation suggests that a tubulin-like protein may be involved in telomere movement.
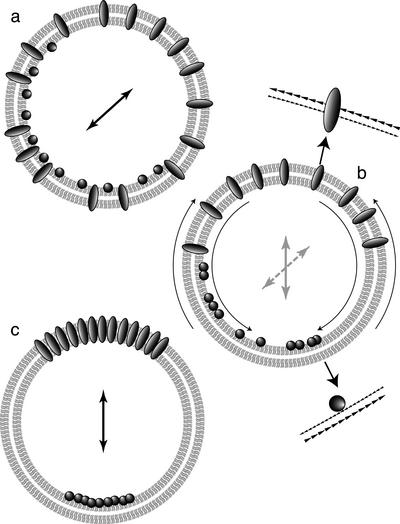
The model we suggest for bouquet formation in rye takes the following form: in the early meiotic nucleus, telomeres are strictly confined to the hemisphere of the nuclear envelope opposite from the centromeres (Figure 10a). In early prophase, a change takes place that allows telomeres to move laterally while retaining close proximity to the nuclear envelope. Homology comparisons between chromosomes encourage the aggregation of telomeres into mini-clusters. As prophase progresses, factors associated with the nuclear envelope undergo polarized movement (Figure 10b). Components at the inner nuclear membrane associate with telomeres and bring them to the future bouquet site, whereas the nuclear pores are deposited on the opposite nuclear hemisphere. This movement forms an axis independent from the original Rabl axis and is responsible for the polarization of the bouquet stage nucleus (Figure 10c). We predict the speed of this movement to be similar to the simulated directed velocity of telomeres, 8.6 ± 1.2 × 10⁻⁴ μm/s. In the absence of directed motion, telomeres would be unable to form the bouquet in a concerted manner, no matter how fast they are diffusing. Existing mutations in telomere maintenance genes that result in bouquet failure, such as taz1 (Cooper et al., 1998), or ndj1 (Trelles-Sticken et al., 2000), the maize meiotic mutant pam1 (Golubovskaya et al., 2002), and the effects of colchicine (Cowan and Cande 2002a, 2002b) may interfere with the connection between the telomere and this motile force. In the cases of pam1 and colchicine treatment, synapsis is abnormal, whereas in ndj1 mutants, homologous pairing is delayed, indicating that defects in bouquet formation affect critical stages later in meiosis. This model makes the prediction that factors associated with the nuclear envelope undergo polarized movement during the bouquet stage, independently of telomeres. A speculative mechanism that might account for this is a transit of membrane components from the inner nuclear membrane to the outer nuclear membrane at sites of telomere association with the nuclear envelope and transit from the outer membrane to the inner membrane at nuclear pores. This hypothesis could be tested by direct fluorescence tagging in vivo of nuclear envelope regions during meiosis.
Figure 10.
A model for bouquet formation in rye. Prebouquet meiosis is shown in (a): telomeres (circles) are polarized to one hemisphere of the nucleus, creating a “Rabl axis.” Nuclear pores (ovals) are distributed uniformly. (b) At the leptotene-zygotene transition, unknown mechanisms polarize both nuclear pores (top arrow) and telomeres (bottom arrow) in opposite directions. If movement of the nuclear envelope causes the difference in polarity between telomeres and nuclear pores, there must be differential movement at each membrane (arrowheads in top and bottom insets). (c) The result is a “bouquet axis” that is independent of the original Rabl axis.
Acknowledgments
We thank Lisa Harper and Alenka Čopič for critical reading of the manuscript. This work was supported by the National Institutes of Health Grant GM R01 46547. W.Z.C. was supported in part by Torrey Mesa Research Institute, Syngenta Research and Technology, San Diego, CA.
Article published online ahead of print. Mol. Biol. Cell 10.1091/mbc.E02–11–0760. Article and publication date are available at www.molbiolcell.org/cgi/doi/10.1091/mbc.E02-11-0760.
Abbreviations used: DAPI, 4′,6-diamidino-2-phenylindole; FISH, fluorescence in situ hybridization.
References
- Bascom-Slack, C.A., and Dawson, D.S. (1997). The yeast motor protein, Kar3p, is essential for meiosis I. J. Cell Biol. 139, 459–467. [DOI] [PMC free article] [PubMed] [Google Scholar]
- Bass, H.W., Marshall, W.F., Sedat, J.W., Agard, D.A., and Cande, W.Z. (1997). Telomeres cluster de novo before the initiation of synapsis: a three-dimensional spatial analysis of telomere positions before and during meiotic prophase. J. Cell Biol. 137, 5–18. [DOI] [PMC free article] [PubMed] [Google Scholar]
- Bass, H.W., Riera-Lizarazu, O., Ananiev, E.V., Bordoli, S.J., Rines, H.W., Phillips, R.L., Sedat, J.W., Agard, D.A., and Cande, W.Z. (2000). Evidence for the coincident initiation of homolog pairing and synapsis during the telomere-clustering (bouquet) stage of meiotic prophase. J. Cell Sci. 113, 1033–1042. [DOI] [PubMed] [Google Scholar]
- Bennett, M.D., Chapman, V., and Riley, R. (1971). The duration of meiosis in pollen mother cells of wheat, rye, and triticale. Proc. R. Soc. Lond. B 178, 259–275. [Google Scholar]
- Carlton, P., and Cande, W.Z. (2002). Telomeres act autonomously in maize to organize the meiotic bouquet from a semipolarized chromosome orientation. J. Cell Biol. 157, 231–242. [DOI] [PMC free article] [PubMed] [Google Scholar]
- Chen, H., Hughes, D.D., Chan, T.-A., Sedat, J.W., and Agard, D.A. (1996). IVE (Image Visualization Environment): a software platform for all three-dimensional microscopy applications. J. Struct. Biol. 116, 56–60. [DOI] [PubMed] [Google Scholar]
- Chikashige, Y., Ding, D.-Q., Funabiki, H., Haraguchi, T., Mashiko, S., Yanagida, M., and Hiraoka, Y. (1994). Telomere-led premeiotic chromosome movement in fission yeast. Science. 264, 270–273. [DOI] [PubMed] [Google Scholar]
- Cooper, J.P., Watanabe, Y., and Nurse, P. (1998). Fission yeast Taz1 protein is required for meiotic telomere clustering and recombination. Nature 392, 828–831. [DOI] [PubMed] [Google Scholar]
- Cowan, C.R., Carlton, P.M., and Cande, W.Z. (2001). The polar arrangement of telomeres in interphase and meiosis. Rabl organization and the bouquet. Plant Physiol. 125, 532–538. [DOI] [PMC free article] [PubMed] [Google Scholar]
- Cowan, C.R., and Cande, W.Z. (2002a). Meiotic telomere clustering is inhibited by colchicine but does not require cytoplasmic microtubules. J. Cell Sci. 115, 3747–3756. [DOI] [PubMed] [Google Scholar]
- Cowan, C.R., and Cande, W.Z. (2002b). Reorganization and polarization of the meiotic bouquet-stage cell can be uncoupled from telomere clustering. J. Cell Sci. 115, 3757–3766. [DOI] [PubMed] [Google Scholar]
- Dernburg, A.F., Sedat, J.W., Cande, W.Z., and Bass, H.W. (1995). Cytology of telomeres. In: Telomeres. ed. E.H. Blackburn and C.W. Grieder, Cold Spring Harbor, NY: Cold Spring Harbor Laboratory Press, 295–338.
- Dernburg, A.F., Sedat, J.W., and Hawley, R.S. (1996). Direct evidence of a role for heterochromatin in meiotic chromosome segregation. Cell 86, 135–146. [DOI] [PubMed] [Google Scholar]
- Dong, F., and Jiang, J. (1998). Non-Rabl patterns of centromere and telomere distribution in the interphase nuclei of plant cells. Chromosome Res. 6, 551–558. [DOI] [PubMed] [Google Scholar]
- Dorninger, D., Karigl, G., and Loidl, J. (1995). Simulation of chromosomal homology searching in meiotic pairing. J. Theor. Biol. 176, 247–260. [DOI] [PubMed] [Google Scholar]
- Esponda, P., and Gimenez-Martín, G. (1972). The attachment of the synaptonemal complex to the nuclear envelope. An ultrastructural and cytochemical analysis. Chromosoma. 38, 405–417. [DOI] [PubMed] [Google Scholar]
- Fung, J.C., Marshall, W.F., Dernburg, A., Agard, D.A., and Sedat, J.W. (1998). Homologous chromosome pairing in Drosophila melanogaster proceeds through multiple independent initiations. J. Cell Biol. 141, 5–20. [DOI] [PMC free article] [PubMed] [Google Scholar]
- Fussell, C.P. (1987). The Rabl orientation: a prelude to synapsis. In: Cell Biology: A Series of Monographs: Meiosis. ed. P.B. Moens, San Diego: Academic Press, 275–300.
- Golubovskaya, I.N., Harper, L.C., Pawlowski, W.P., Schichnes, D., and Cande, W.Z. (2002). The pam1 gene is required for meiotic bouquet formation and efficient homologous synapsis in maize (Zea mays L.). Genetics 162, 1979–1993. [DOI] [PMC free article] [PubMed] [Google Scholar]
- Heun, P., Laroche, T., Shimada, K., Furrer, P., and Gasser, S.M. (2001). Chromosome dynamics in the yeast interphase nucleus. Science 294, 2181–2186. [DOI] [PubMed] [Google Scholar]
- Hiraoka, T. (1949). Observational and experimental studies of meiosis with special reference to the bouquet stage. I. Cell polarity in the bouquet stage as revealed by the behaviour of plastids. Bot. Mag. Tokyo 62, 19–23. [Google Scholar]
- Jin, Q.-W., Trelles-Sticken, E., Scherthan, H., and Loidl, J. (1998). Yeast nuclei display prominent centromere clustering that is reduced in nondividing cells and in meiotic prophase. J. Cell Biol. 141, 21–29. [DOI] [PMC free article] [PubMed] [Google Scholar]
- Loidl, J. (1990). The initiation of meiotic chromosome pairing: the cytological view. Genome 33, 759–778. [DOI] [PubMed] [Google Scholar]
- Marshall, W.F., Straight, A., Marko, J., Swedlow, J., Dernburg, A., Belmont, A., Murray, A.W., Agard, D.A., and Sedat, J.W. (1997). Interphase chromatin undergoes large-scale diffusional motion within nuclei in living cells: the dynamics of nuclear architecture. Mol. Biol. Cell 8, 4A. [Google Scholar]
- Moens, P.B. (1969). The fine structure of meiotic chromosome polarization and pairing in Locusta migratiriaspermatocytes. Chromosoma. 28, 1–25. [DOI] [PubMed] [Google Scholar]
- Qian, H., Sheetz, M.P., and Elson, E.L. (1991). Single particle tracking. Analysis of diffusion and flow in two-dimensional systems. Biophys. J. 60, 910–921. [DOI] [PMC free article] [PubMed] [Google Scholar]
- Rabl, C. 1885. Über Zellteilung. Morphol. Jahrb. 10, 214–330. [Google Scholar]
- Rasmussen, S., and Holm, P. (1978). Human meiosis II: chromosome pairing and recombination nodules in human spermatocytes. Carlsberg Res. Comm. 42, 275–327. [Google Scholar]
- Scherthan, H. (2001). A bouquet makes ends meet. Nat. Rev. Mol. Cell. Biol. 2, 621–627. [DOI] [PubMed] [Google Scholar]
- Scherthan, H., Jerratsch M., Li B., Smith S., Hulten M., Lock T., and de Lange, T. (2000). Mammalian meiotic telomeres: protein composition and redistribution in relation to nuclear pores. Mol. Biol. Cell 11, 4189–4203. [DOI] [PMC free article] [PubMed] [Google Scholar]
- Scherthan, H., Loidl, J., and Trelles-Sticken, E. (2001). Kar3p is not required for bouquet formation in haploid yeast meiosis. In: Society for Experimental Biology Annual Meeting. Canterbury, UK: Oxford University Press.
- Scherthan, H., Weich, S., Schwegler, H., Heyting, C., Haerle, M., and Cremer, T. (1996). Centromere and telomere movements during early meiotic prophase of mouse and man are associated with the onset of chromosome pairing. J. Cell Biol. 134, 1109–1125. [DOI] [PMC free article] [PubMed] [Google Scholar]
- Sheldon, J., Wilson, C., and Dickenson, H. (1988). Interaction between the nucleus and cytoskeleton during the pairing stages of male mieosis in flowering plants. In: Kew Chromosome Conference, Vol. 3. London: Her Majesty's Stationery Office, 27–35. [Google Scholar]
- Smith, P.R., Morrison, I.E.G., Wilson, K.M., Fernández, N., and Cherry, R.J. (1999). Anomalous diffusion of major histocompatibility complex class I molecules on HeLa cells determined by single particle tracking. Biophys. J. 76, 3331–3344. [DOI] [PMC free article] [PubMed] [Google Scholar]
- Thompson-Coffe, C., and Zickler, D. (1994). How the cytoskeleton recognizes and sorts nuclei of opposite mating type during the sexual cycle in filamentous ascomycetes. Dev. Biol. 165, 257–271. [DOI] [PubMed] [Google Scholar]
- Trelles-Sticken, E., Dresser, M.E., and Scherthan, H. (2000). Meiotic telomere protein Ndj1p is required for meiosis-specific telomere distribution, bouquet formation and efficient homologue pairing. J. Cell Biol. 151, 95–106. [DOI] [PMC free article] [PubMed] [Google Scholar]
- Vazquez, J., Belmont, A.S., and Sedat, J.W. (2001). Multiple regimes of constrained chromosome motion are regulated in the interphase Drosophila nucleus. Curr. Biol. 11, 1227–39. [DOI] [PubMed] [Google Scholar]
- Wilson, E.B. (1925). The Cell in Development and Heredity. New York: Macmillan.
- Zickler, D. (1977). Development of the synaptonemal complex and the “recombination nodules” during meiotic prophase in the seven bivalents of the fungus Sordaria macrospora Auersw. Chromosoma 61, 289–316. [DOI] [PubMed] [Google Scholar]
- Zickler, D., and Kleckner, N. (1998). The leptotene-zygotene transition of meiosis. Annu. Rev. Genet. 32, 619–697. [DOI] [PubMed] [Google Scholar]


