

Abstract
CsrA is a global regulator that binds to two sites in the glgCAP leader transcript, thereby blocking ribosome access to the glgC Shine-Dalgarno sequence. The upstream CsrA binding site (GCACACGGAU) was used to search the Escherichia coli genomic sequence for other genes that might be regulated by CsrA. cstA contained an exact match that overlapped its Shine-Dalgarno sequence. cstA was previously shown to be induced by carbon starvation and to encode a peptide transporter. Expression of a cstA′-′lacZ translational fusion in wild-type and csrA mutant strains was examined. Expression levels in the csrA mutant were approximately twofold higher when cells were grown in Luria broth (LB) and 5- to 10-fold higher when LB was supplemented with glucose. It was previously shown that cstA is regulated by the cyclic AMP (cAMP)-cAMP receptor protein complex and transcribed by Εσ70. We investigated the influence of σS on cstA expression and found that a σS deficiency resulted in a threefold increase in cstA expression in wild-type and csrA mutant strains; however, CsrA-dependent regulation was retained. The mechanism of CsrA-mediated cstA regulation was also examined in vitro. Cross-linking studies demonstrated that CsrA is a homodimer. Gel mobility shift results showed that CsrA binds specifically to cstA RNA, while coupled-transcription-translation and toeprint studies demonstrated that CsrA regulates CstA synthesis by inhibiting ribosome binding to cstA transcripts. RNA footprint and boundary analyses revealed three or four CsrA binding sites, one of which overlaps the cstA Shine-Dalgarno sequence, as predicted. These results establish that CsrA regulates translation of cstA by sterically interfering with ribosome binding.
Eubacteria are able to rapidly sense, respond to, and adapt to environmental changes such as nutrient availability. Nutrient limitation in Escherichia coli can lead to the transition from exponential- to stationary-phase growth. Through the action of global regulatory molecules, such as the stationary-phase sigma factor (σS) encoded by rpoS, the induction of numerous E. coli genes assists in stationary-phase cell survival and the development of stress resistance (19, 25, 31, 34). The global carbon storage regulatory system (Csr) is involved in the repression of several stationary-phase processes and in the activation of some exponential-phase functions (reviewed in reference 38). Three major components of Csr include RNA binding protein CsrA and two small untranslated RNA molecules, CsrB and CsrC. CsrA represses gluconeogenesis, glycogen biosynthesis and catabolism, and biofilm formation (23, 40, 41, 51). Conversely, CsrA activates glycolysis, acetate metabolism, and flagellum biosynthesis (41, 47, 48). Both the CsrB and CsrC RNAs function as antagonists of CsrA by sequestering this protein and preventing its action (20, 29, 49). These regulatory RNAs possess similar imperfect repeat sequences (18 in CsrB and 9 in CsrC) that likely serve as CsrA binding sites (29, 49). Previous studies showed that CsrA, CsrB RNA, and CsrC RNA levels accumulate as the culture reaches the stationary phase of growth (20, 49). CsrA activates transcription of csrB and csrC indirectly through the BarA/UvrY two-component signal transduction system (36, 45, 49). The purified UvrY protein was found to stimulate expression of csrB-lacZ and csrC-lacZ transcriptional fusions, indicating that UvrY resides immediately upstream from csrB and csrC in the signaling pathway (45, 49).
CsrA regulates expression of the glycogen biosynthetic gene glgC by binding to two positions in the untranslated leader of the glgCAP operon transcript (4). One of the two binding sites overlaps the glgC Shine-Dalgarno sequence, while the other CsrA target is located 25 nucleotides (nt) upstream from the Shine-Dalgarno sequence within a short hairpin. CsrA binding to these sites regulates GlgC synthesis by preventing ribosome binding (4). Translation inhibition presumably leads to the observed accelerated decay rate of glgCAP mRNA (27, 28). The upstream CsrA binding site in the glgCAP leader transcript closely resembles the repeated elements found in both CsrB and CsrC RNAs (4, 49). We used the upstream CsrA binding sequence in the glgCAP leader transcript to search for other genes that might be regulated by CsrA. A DNA pattern search of the E. coli genomic database identified the carbon starvation gene, cstA, as a potential candidate. The untranslated leader of cstA contained a sequence that matched the glgC sequence at 10 out of 10 positions. Interestingly, this sequence (GCACACGGAU) overlapped the cstA Shine-Dalgarno sequence.
The cst genes are cyclic AMP (cAMP)-dependent carbon starvation response genes that are involved in nutrient scavenging (31, 32, 43). cstA was first identified as a gene with a lacZ insertion mutation that showed a marked increase in activity when the medium was depleted of succinate, glycerol, or glucose or when cells grown in Luria broth (LB) entered the stationary phase (42). The cstA promoter contains a putative cAMP receptor protein (CRP) binding site located approximately 80 nt upstream from the start of transcription (42). It was previously shown that cstA expression was dependent on Eσ70 and the cAMP-CRP complex. All basal and starvation-induced cstA expression was lost in both Δcya and Δcrp mutants, while the addition of antibodies specific for σ70 to an in vitro coupled-transcription-translation system eliminated expression (7). The complete CstA polypeptide consists of 701 amino acids and has a hydrophobicity profile indicative of an integral membrane protein (SWISS-PROT accession no. P15078). Results from previous studies led to the conclusion that CstA is involved in peptide transport that would assist the cell in escaping carbon starvation (42). Interestingly, the Pfam database indicates that CstA is conserved in 20 eubacterial and 2 archaebacterial species (http://www.sanger.ac.uk/cgi-bin/Pfam). Results from the in vivo and in vitro studies reported here establish that CsrA regulates expression of cstA by blocking ribosome access to the cstA Shine-Dalgarno sequence.
MATERIALS AND METHODS
Bacterial strains and plasmids.
All of the E. coli strains used in this study are listed in Table 1. The plasmids pTZ18U (United States Biochemical Corp.) and pKK223-3 (Pharmacia) contain a T7 RNA polymerase promoter and a tac promoter, respectively. The plasmid pMLB1034, used for constructing lacZ translational fusions, has been described (44). Plasmid pPP1 contains the 39-nt cstA leader and the first 64 nt of the coding region (+1 to +103 relative to the start of cstA transcription) cloned into the pTZ18U polylinker. This plasmid was used as a template to generate all of the transcripts used for our in vitro studies. pCSB36 contains a cstA′-′lacZ translational fusion that includes the cstA promoter, the leader, and the first 18 codons of the cstA coding region (−161 to +92 relative to the start of transcription) cloned into pMLB1034. Plasmid pCSB33 contains a cstA′-′lacZ translational fusion driven by the tac promoter in pKK223-3. The cstA sequences included in pCSB33 extend from −3 to +95 relative to the start of transcription. E. coli strains CF7789 [Δ(lacI to lacZ) (MluI)] and TR1-5CF7789 [Δ(lacI to lacZ) (MluI) csrA::Kanr] were transformed with pCSB36 to generate strains PLB703 and PLB704, respectively. The construction of strains containing single-copy gene insertions of the cstA′-′lacZ fusion from pCSB33 or pCSB36 followed a published procedure (9). Strains PLB716 and PLB717 contain single-copy cstA′-′lacZ fusions in the CF7789 and TR1-5CF7789 genetic backgrounds, respectively. Strains PLB714 and PLB715 contain single-copy cstA′-′lacZ translational fusions driven by the tac promoters in strains CF7789 and TR1-5CF7789, respectively. Strains PLB726 and PLB729 were constructed by P1vir transductions. Strain PLB726 [Δ(lacI to lacZ) (MluI) cstA′-′lacZ rpoS::Tn10 Tcr] was generated by using CAG4513 (rpoS:: Tn10 Tcr) as the donor and PLB716 as the recipient strain. Strain PLB729 [Δ(lacI to lacZ) (MluI) csrA::Kanr cstA′-′lacZ rpoS::Tn10 Tcr] was generated by using CAG4513 as the donor and PLB717 as the recipient strain.
TABLE 1.
E. coli strains used in this study
| Strain | Description | Source or reference |
|---|---|---|
| CAG4513 | rpoS::Tn10 Tcr | S. Ades |
| CF7789 | ΔlacI-lacZ (MluI) | M. Cashel |
| PLB714 | CF7789 Δ(att-lom)::bla φ(Ptac-cstA′-′lacZ) 1(Hyb) Apr | This study |
| PLB715 | CF7789 csrA::Kanr Δ(att-lom)::bla φ(Ptac-cstA′-′lacZ)1(Hyb) Apr | This study |
| PLB703 | CF7789/pCSB36 (Apr) | This study |
| PLB704 | CF7789 csrA::Kanr/pCSB36 (Apr) | This study |
| PLB716 | CF7789 Δ(att-lom)::bla φ(cstA′-′lacZ)1(Hyb) Apr | This study |
| PLB717 | CF7789 csrA::Kanr Δ(att-lom)::bla φ(cstA′-′lacZ)1(Hyb) Apr | This study |
| PLB726 | CF7789 rpoS::Tn10 Tcr Δ(att-lom)::bla φ(cstA′-′lacZ)1(Hyb) Apr | This study |
| PLB729 | CF7789 csrA::KanrrpoS::Tn10 Tcr Δ(att-lom)::bla φ(cstA′-′lacZ)1(Hyb) Apr | This study |
| TR1-5BW3414 | csrA::KanrrpoS | 40 |
| TR1-5CF7789 | CF7789 csrA::Kanr | 45 |
Growth studies and β-galactosidase assays.
Bacterial growth at 37°C in LB or LB supplemented with 0.2% glucose was monitored with a Klett-Summerson colorimeter (no. 52 green filter). Culture samples (4 ml) were harvested at various times, washed once with 10 mM Tris-HCl, pH 7.5, and frozen as cell pellets at −80°C. Cell extracts were prepared by suspending frozen cell pellets in 0.35 ml of BugBuster protein extraction reagent (Novagen) and incubating them at 37°C in an air shaker. After 1 h, 0.3 ml of Z buffer (33) containing 0.2 mg of lysozyme per ml was added to each sample and incubation was continued for 30 min at 37°C in an air shaker. Cell debris was removed by centrifugation at 4°C. β-Galactosidase assays were performed as described previously (4, 33) with a Packard SpectraCount plate reader to determine absorbance at 420 nm. The specific β-galactosidase activity was determined. Protein concentrations were determined by the Bio-Rad protein assay.
CsrA cross-linking.
CsrA was purified as previously described (4). Cross-linking experiments with glutaraldehyde were performed by following a previously published procedure (3). Reaction mixtures (final volume, 30 μl) contained 5 mM Tris-HCl, pH 7.5, 5 mM MgCl2, 50 mM KCl, and 0.75% glutaraldehyde. Cross-linking reactions were carried out at 25°C and were started by the addition of 1.4 μg of purified CsrA. After various times one 15-μl aliquot from each reaction mixture was removed and mixed with 15 μl of 2× loading buffer (125 mM Tris-HCl [pH 6.8], 2% sodium dodecyl sulfate, 20% glycerol, 0.02% bromophenol blue). This step was omitted for the other 15-μl aliquot of each reaction mixture. All samples were then immediately heated to 110°C for 5 min. Control samples without glutaraldehyde were treated identically. All samples in loading buffer were fractionated through 4 to 20% gradient denaturing polyacrylamide gels. Protein bands were visualized with Brilliant Blue G colloidal stain (Sigma). The samples not treated with sodium dodecyl sulfate were frozen at −35°C until analyzed by matrix-assisted laser desorption ionization (MALDI-TOF) mass spectrometry.
MALDI-TOF mass spectrometry.
Mass spectra of glutaraldehyde-treated and control protein samples were generated with a Voyager-DE STR MALDI-time of flight mass spectrometer (Perseptive Biosystems, Framingham, Mass.). Aliquots from the cross-linking reactions were removed at different reaction times and frozen at −35°C until MALDI-TOF mass spectrometry analysis. Mass spectra were generated by using alpha-cyano-4-hydroxycinnamic acid as the matrix. Sample aliquots were cocrystallized with the matrix on the MALDI-TOF sample plate at various dilutions, and the dried residues were washed twice with cold 0.1% aqueous trifluoroacetic acid to remove salts and residual glutaraldehyde. A volume of 0.5 μl of 0.1% aqueous octylglucoside was added to each residue, followed by evaporation under ambient laboratory conditions (46), as this was found to improve the mass spectra.
In vitro transcription-translation.
In vitro coupled-transcription-translation experiments followed previously published procedures (27, 39), except that final reaction volumes were each 28 μl. The effect of the purified CsrA protein on cstA′-′lacZ expression from pCSB36 was examined by using S-30 extracts prepared from strain TR1-5BW3414 (csrA::Kanr rpoS) (27). Proteins synthesized in the reactions were labeled by incorporation of [35S]methionine (1,175 Ci/mmol; NEN Life Science Products) and denatured, and equal volumes of all reaction mixtures were fractionated through 9.5% denaturing polyacrylamide gels. Radiolabeled proteins were detected by fluorography using sodium salicylate (10). Modifications to this assay are described below and in the legend for Fig. 3.
FIG. 3.

Effects of CsrA on coupled transcription-translation of the cstA′-′lacZ translational fusion. Reaction mixtures contained pCSB36 (cstA′-′lacZ) or vector only (1.6 μg), as indicated. Reactions were carried out in the presence of various concentrations of purified CsrA in the absence (−) or presence (+) of cAMP (0.1 mM) and CRP (1.6 μg). The position of the full-length CstA-LacZ fusion polypeptide is shown.
Gel mobility shift assays.
Quantitative gel mobility shift assays followed previously published procedures (4, 50). RNA was synthesized in vitro with the Ambion MEGAscript kit and plasmid pPP1, which had been linearized with BamHI as the template. Gel-purified RNA was dephosphorylated with calf intestinal alkaline phosphatase and subsequently 5′ end labeled by using [γ-32P]ATP and polynucleotide kinase as described previously (50). Labeled RNA was gel purified, suspended in TE (10 mM Tris-HCl [pH 8.0], 1 mM EDTA) and renatured by being heated to 85°C and slowly cooled at room temperature. Binding reaction mixtures (10 μl) contained 10 mM Tris-HCl, pH 7.5, 100 mM KCl, 10 mM MgCl2, 32.5 ng of yeast RNA, 10% glycerol, 20 mM dithiothreitol, 4 U of RNase inhibitor (Ambion), 0.5 nM 5′-end labeled cstA RNA, various concentrations of purified CsrA, and 0.1 mg of xylene cyanol/ml. Competition assay mixtures also contained unlabeled RNA competitor (see Results for details). Reaction mixtures were incubated at 37°C for 30 min to allow CsrA-cstA RNA complex formation. Samples were then fractionated on native 12% polyacrylamide gels. Radioactive bands were visualized with a phosphorimager (Molecular Dynamics). Free and bound RNA species were quantified with ImageQuant software (Molecular Dynamics), and the apparent equilibrium binding constant (Kd) and the cooperativity coefficient (n) for CsrA-cstA RNA complex formation were calculated as described previously (50).
Toeprint assay.
Toeprint assays were carried out by modifying published procedures (4, 13, 15, 21). cstA transcripts used in this analysis were synthesized with HindIII-linearized pPP1 as the template. Gel-purified cstA RNA (200 nM) in TE was renatured and hybridized to a DNA oligonucleotide (200 nM) that was complementary to the 3′ end of the transcript and that had been labeled at the 5′ end with 32P by heating to 80°C followed by slow cooling at room temperature. Toeprint assays were carried out with 1 μM CsrA and/or 100 nM 30S ribosomal subunits and 500 nM tRNAfMet. Toeprint reaction mixtures (20 μl) contained 2 μl of the hybridization mixture, 375 μM (each) deoxynucleoside triphosphate, and 10 mM dithiothreitol in toeprint buffer (10 mM Tris-HCl [pH 7.4], 10 mM MgCl2, 60 mM ammonium acetate, 6 mM 2-mercaptoethanol) (21). The reaction mixtures containing CsrA were incubated for 30 min at 37°C to allow CsrA-RNA complex formation. 30S ribosomal subunit toeprint reactions were carried out by incubating RNA, 30S ribosomal subunits, and tRNAfMet in toeprint buffer as described previously (21). Following the addition of 0.6 U of avian myeloblastosis virus reverse transcriptase (Roche) the reaction mixture was further incubated for 15 min at 37°C. Reactions were terminated by adding 12 μl of stop solution (85% formamide, 68 mM EDTA, 0.1× Tris-borate-EDTA, 0.1% xylene cyanol, 0.025% bromophenol blue). Samples were fractionated through a 6% sequencing gel. Sequencing reactions were carried out using pPP1 as the template and the same end-labeled oligonucleotide as a primer.
RNA footprint and structure mapping assays.
5′-end-labeled cstA transcripts were generated as described for the gel shift assays. Titrations of RNase T1 (Roche), RNase T2 (Sigma), and RNase A (Ambion) were performed to optimize the amount of enzyme to prevent multiple cleavages in any one transcript. Binding reaction mixtures (10 μl) containing 2 nM cstA RNA and various concentrations of CsrA were otherwise identical to those described for the gel mobility shift assay. RNase T1 (0.02 U), RNase T2 (0.01 U), or RNase A (0.5 × 10⁻⁶ μg/μl) was added in separate reactions, and the reaction mixtures were further incubated for 15 min at 37°C. Reactions were terminated by adding 10 μl of stop solution (95% formamide, 20 mM EDTA, 0.025% sodium dodecyl sulfate, 0.025% xylene cyanol, 0.025% bromophenol blue). Partial alkaline hydrolysis and RNase T1 digestion ladders were prepared as described previously (5). Samples were fractionated through 10% denaturing polyacrylamide gels.
Boundary analysis.
5′ and 3′ boundary analyses were carried out by modifying previously published procedures (6, 14). To determine the 3′ boundary required for CsrA binding, 5′-end-labeled RNA was generated as described above. To determine the 5′ boundary required for CsrA binding, 3′-end-labeled RNA was prepared by modifying a published procedure (22). Gel-purified cstA RNA (1 μM) was hybridized to a DNA oligonucleotide (10 μM) complementary to the 3′ end of the transcript by heating to 85°C followed by slow cooling such that a 5′ overhang of 2 nt (3′-TC-5′) was generated. The Klenow fragment (Promega; 0.5 U) was used to extend the 3′ end of the RNA by incorporating a single α-32P-labeled dATP (NEN Life Sciences Products) residue by incubating the reaction mixture at 37°C for 2 h. The labeled RNA was gel purified as described above. To generate 5′- and 3′-labeled alkaline hydrolysis ladders, 50-μl RNA samples (10 pmol) were incubated for 4 min at 95°C in alkaline hydrolysis buffer (100 mM NaHCO3-Na2CO3 [pH 9.0], 2 mM EDTA) and then recovered by ethanol precipitation. Hydrolyzed RNAs were mixed with 1 or 3 μM CsrA (20-μl reaction volume) and incubated for 30 min at 37°C to allow CsrA-cstA RNA complex formation. Samples were fractionated through 10% native polyacrylamide gels. Bound and unbound transcripts were visualized by autoradiography, excised from the gel, and subsequently eluted from the gel. RNAs were ethanol precipitated and fractionated through 10% denaturing polyacrylamide gels. RNase T1 and alkali digestion ladders of the same transcript were used as molecular size standards.
RESULTS
CsrA is a dimer of identical subunits.
Initial studies with purified CsrA indicated that the protein existed as either a dimer or trimer in solution (4). Cross-linking experiments were performed to determine which of these two possibilities was correct. Denaturing gel electrophoresis of glutaraldehyde-cross-linked CsrA showed the appearance of a single cross-linked species with the apparent mobility of a dimer (Fig. 1A). MALDI-TOF mass spectrometry of glutaraldehyde-cross-linked CsrA confirmed that CsrA exists as a dimer of identical subunits (Fig. 1B). A minimal signal corresponding to a noncovalent dimer was observed in protein control mass spectra, and a cross-linked dimer was clearly evident in spectra obtained after both 60- and 120-min incubations. No higher oligomers were observed in any MALDI-TOF spectra. Widths of the MALDI-TOF peaks suggest some minor microheterogeneity in both treated and control proteins. All of the molar concentrations used in this study are therefore based on the molecular mass of CsrA as a dimer (13,710 Da).
FIG. 1.

Subunit composition of CsrA. (A) A 4 to 20% gradient sodium dodecyl sulfate-polyacrylamide gel of glutaraldehyde-cross-linked and non-cross-linked CsrA is shown. The absence (−) or presence (+) of the glutaraldehyde cross-linking reagent and the time of the cross-linking reaction are shown at the top of each lane. The positions of the CsrA monomer and dimer are shown. Numbers at the left are kilodaltons. (B) MALDI-TOF mass spectrum of CsrA after cross-linking with glutaraldehyde for 60 min. Monomer and dimer peaks are indicated.
Identification of cstA as a potential CsrA-regulated gene.
A sequence comparison of known and putative CsrA binding sites from E. coli, Pseudomonas fluorescens, and Pseudomonas aeruginosa was recently published (4). The three putative CsrA binding sites from P. fluorescens and P. aeruginosa overlapped the Shine-Dalgarno sequences of genes involved in the biosynthesis of hydrogen cyanide or exoprotease production (8). The DNA pattern search program available on the Colibri website (http://genolist.pasteur.fr/Colibri/) was used to search for other genes containing the GCACACGGAU sequence found in the upstream CsrA binding site in the glgCAP leader transcript. An exact match was identified in cstA, a carbon starvation-induced gene that encodes a putative peptide transporter. Interestingly, this sequence overlapped the cstA Shine-Dalgarno sequence. The position of this putative CsrA binding site led us to investigate cstA as a possible target for posttranscriptional regulation by CsrA.
CsrA regulates expression of cstA.
CsrA-dependent regulation of cstA was examined in vivo by using a cstA′-′lacZ translational fusion. The fusion included the CRP binding site and the three transcription start sites previously described (42). Expression of the fusion, either from a low-copy-number plasmid (Fig. 2A) or as single-copy chromosomal integrates (Fig. 2B and C), was examined throughout the growth curve in both wild-type and csrA mutant backgrounds. When the csrA mutant was grown in LB, a reproducible 1.5- to 2-fold increase in expression in was observed regardless of the copy number of the fusion, although expression was about 10-fold higher when the fusion was carried on the low-copy-number plasmid (Fig. 2A and B). CsrA-dependent regulation was most evident during the transition from exponential- to stationary-phase growth and during early stationary phase. Since cstA is involved in nutrient scavenging under conditions of carbon limitation, we hypothesized that the extent of CsrA-dependent repression would be higher under conditions of carbon excess. Thus, cstA expression was also examined when LB was supplemented with 0.2% glucose. Since cstA expression is dependent on cAMP-CRP (42, 43), lower expression was observed throughout the growth curve in both the wild-type and csrA mutant strains under this growth condition. However, expression in the csrA mutant during exponential- and early-stationary-phase growth was 5- to 10-fold higher than expression in the wild-type strain (Fig. 2C).
FIG. 2.

Effect of csrA and rpoS on expression of a cstA′-′lacZ translational fusion. (A) Effect of csrA on expression of the cstA′-′lacZ fusion carried on a low-copy-number plasmid when cells were grown in LB. (B) Effect of csrA on expression of the cstA′-′lacZ fusion as a single-copy chromosomal integrate when cells were grown in LB. (C) Effect of csrA on expression of the cstA′-′lacZ fusion as a single-copy chromosomal integrate when cells were grown in LB supplemented with 0.2% glucose. (D) Effect of rpoS on expression of the cstA′-′lacZ fusion as a single-copy chromosomal integrate when cells were grown in LB. (E) Effect of rpoS on expression of the cstA′-′lacZ fusion as a single-copy chromosomal integrate when cells were grown in LB supplemented with 0.2% glucose. (F) Effect of replacing the cAMP-CRP-dependent cstA promoter with a tac promoter on CsrA-mediated regulation of the cstA′-′lacZ fusion as a single-copy chromosomal integrate when cells were grown in LB supplemented with 0.2% glucose. Symbols for β-galactosidase activity: wild type, solid squares; csrA strain, open squares; rpoS strain, solid triangles; csrA rpoS strain, open triangles. Symbols for growth: wild type, solid diamonds. Time is hours of cell growth. These experiments were conducted three times with similar results. Results from representative experiments are shown.
The dependence of cstA expression on σ70 was previously examined by using an in vitro coupled-transcription-translation system (7). The addition of an anti-σ70 antibody eliminated cstA expression. While these results suggested that the strongest promoter(s) for cstA was σ70 dependent, they could not rule out the possibility that the stress response sigma factor, σS, also promoted transcription of cstA. Expression of the integrated cstA′-′lacZ translational fusion in isogenic wild-type (PLB716), csrA (PLB717), rpoS (PLB726), and rpoS csrA (PLB729) strains grown in LB was examined to test this possibility. The absence of σS resulted in a 2.5- to 3-fold increase in expression. Compare expression levels in PLB726 with those in PLB716 and compare those in PLB729 with those in PLB717 (Fig. 2D). Expression of the cstA′-′lacZ fusion was also examined when these four strains were grown in LB containing 0.2% glucose. In this growth medium expression in the rpoS strain was fourfold higher than that in the wild-type strain, while expression in the csrA rpoS strain was threefold higher than that in the strain with mutant csrA only (Fig. 2E). These results indicate that EσS does not contribute to cstA transcription. It is important that the CsrA-dependent regulation of cstA expression was maintained in the rpoS mutants. Compare expression in PLB726 with that in PLB729 (Fig. 2D and E). cstA expression in relA and relA spoT mutants was also examined. Expression from both of these strains did not deviate from wild-type levels (data not shown). Thus, it is apparent that expression of cstA is not influenced by ppGpp and the stringent response.
We replaced the native cstA promoter with a tac promoter that does not contain a CRP binding site to examine CsrA-mediated regulation of cstA expression in the absence of the cAMP-CRP effect on transcription (Fig. 2F). Expression from the tac promoter was considerably higher than that from the native promoter in LB medium containing 0.2% glucose (Fig. 2C and F). While the pattern of temporal expression from the tac promoter differed from that from the cstA promoter, CsrA-mediated regulation was retained. Expression from the tac promoter was three- to fourfold higher in the csrA mutant strain than in the wild type.
Since our expression studies indicated that CsrA regulates cstA, coupled-transcription-translation experiments were carried out in S-30 extracts prepared from CsrA-deficient cells to determine if purified CsrA could inhibit CstA synthesis (Fig. 3). Transcription of the cstA′-′lacZ fusion containing the native cstA promoter and CRP binding site was dependent on cAMP and CRP, consistent with previously published results demonstrating that cstA expression is subject to catabolite repression (42, 43). Moreover, the addition of purified CsrA inhibited CstA synthesis. As the concentration of CsrA was gradually increased from 0 to 1 μM, we observed a corresponding decrease in the level of the labeled CstA-LacZ fusion polypeptide (Fig. 3). Note that CsrA did not inhibit the expression of other plasmid-carried genes at these concentrations (data not shown).
CsrA binds specifically to cstA RNA.
The cstA transcript contains a 39-nt untranslated leader. To characterize the interaction of CsrA with cstA RNA, quantitative gel mobility shift assays were performed with a transcript containing nt +1 to +103 relative to the start of cstA transcription. CsrA binding to this transcript was detected as a distinct band in native gels between 10 and 40 nM CsrA. Complete shifting was observed when the concentration of CsrA reached 80 nM (Fig. 4, top). A nonlinear least-squares analysis of these data yielded an estimated Kd value of 40 nM with a cooperativity coefficient (n) of 3.5. The positive cooperativity suggested that the binding of CsrA to one binding site stimulated CsrA interaction with additional binding sites. As the concentration of CsrA was increased further, additional shifted species of higher molecular weights were observed. This gel shift pattern suggested that multiple CsrA molecules were bound to each cstA transcript at these higher CsrA concentrations. Although the stoichiometry of these complexes has not been examined, we presume that the first shifted species contained one cstA transcript and one CsrA dimer and that the additional shifted species contained multiple CsrA molecules. It is possible that the slower-migrating species result from multiple CsrA-RNA and/or CsrA-CsrA interactions.
FIG. 4.

Gel mobility shift analysis of CsrA-cstA RNA interaction. 5′-end-labeled cstA RNA (0.5 nM) was incubated with CsrA at the concentration indicated at the bottom of each lane. Gel shift assays were performed in the absence (top) or presence (bottom) of various competitor RNAs. The concentrations of specific (cstA and glgC) and nonspecific (trpL) competitor RNAs are shown at the bottom of each lane. Positions of free (F) and bound (B) RNAs are shown.
The specificity of the CsrA-cstA RNA interaction was investigated by performing competition experiments with specific (cstA and glgC) and nonspecific (Bacillus subtilis trp leader) unlabeled RNA competitors (Fig. 4, bottom). CsrA was previously shown to bind specifically to glgC RNA with an estimated Kd value of 20 nM (4). Unlabeled cstA and glgC RNAs were effective competitors, whereas the B. subtilis trp leader RNA did not compete with the CsrA-cstA RNA interaction. These results establish that CsrA binds specifically to cstA RNA.
CsrA binding to the cstA transcript inhibits CstA synthesis by preventing ribosome binding.
A toeprint analysis was performed to identify the position(s) of bound CsrA in the cstA transcript. The presence of bound CsrA should stop primer extension by reverse transcriptase, resulting in a toeprint band near the 3′ boundary of CsrA. The results of the toeprint experiments are presented in Fig. 5 and summarized in Fig. 6A. Seven CsrA-dependent toeprint bands were clustered in three segments of the cstA transcript (Fig. 5). Results from footprinting and boundary studies (see below) suggest that the bands at positions C38, U41, A46, A59, and C61 constitute authentic CsrA toeprints. The two bands near the top of the gel (Fig. 5) are located within the first 10 nt of the natural cstA transcript. Since bound CsrA does not protect the cstA transcript upstream of U10 from RNase cleavage (see below), it is unlikely that these bands represent authentic CsrA toeprints. The two prominent bands at the bottom of the gel (Fig. 5) are present in each lane and are not dependent on CsrA. Since RNA secondary structure can inhibit primer extension by reverse transcriptase, these bands appear to be RNA structural toeprints.
FIG. 5.
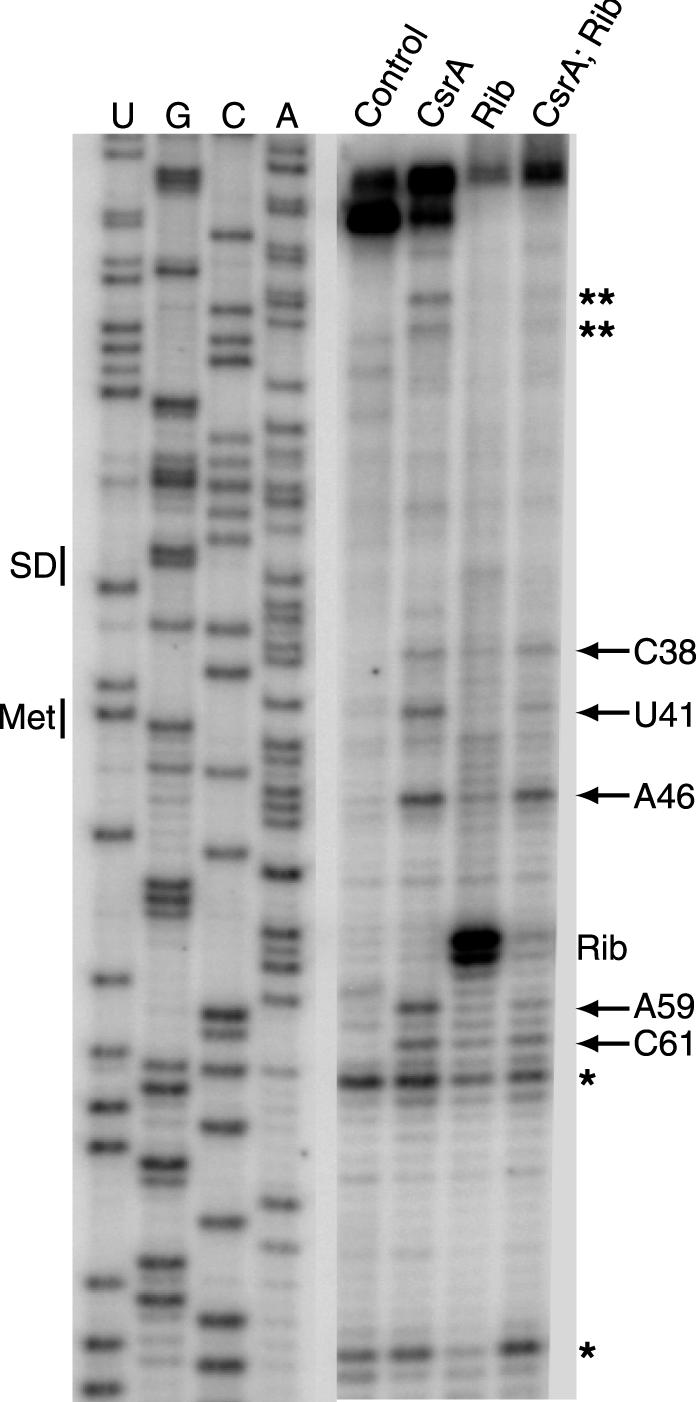
CsrA and 30S ribosomal subunit toeprints of cstA RNA. The presence, as well as the order of addition, of CsrA and/or 30S ribosomal subunits is shown at the top of each lane. Positions of bands corresponding to CsrA (arrows) and 30S ribosomal subunit (Rib) toeprints are shown. Two additional CsrA-dependent toeprints (∗∗) and bands observed in all lanes due to RNA secondary structure (∗) are indicated. The regions of the gel corresponding to the cstA Shine-Dalgarno (SD) sequence and start codon (Met) are shown. Sequencing lanes used to reveal U, G, A, and C residues are marked.
FIG. 6.

Summary of the in vitro results and a comparison of known CsrA binding sites. (A) Summary of the data presented in Fig. 5, 7, and 8. Short arrows, positions of the CsrA (A) and 30S ribosomal subunit (Rib) toeprints. Nucleotides in which bound CsrA increases (+) or decreases (−) cleavage by single-strand-specific ribonucleases are indicated. Long arrows, positions of the 5′ and 3′ boundaries. I to IV, the four CsrA binding sites. Positions of the cstA Shine-Dalgarno (SD) sequence and start codon (Met) are shown. Numbering is from the start of cstA transcription. (B) Sequence comparison of E. coli CsrA binding sites. The CsrA binding sites in the cstA transcript (I to IV) are compared with the CsrB RNA consensus (18 sites), the CsrC RNA consensus (9 sites), and two binding sites in the glgCAP leader transcript. The consensus sequence derived from this comparison is shown at the bottom. See text for details.
Similar toeprint experiments were performed to identify the positions of bound 30S ribosomal subunits. As expected, a prominent tRNAfMet-dependent toeprint band was observed 15 nt downstream from the A of the AUG initiation codon (Fig. 5). Toeprint experiments were also carried out to determine if CsrA could inhibit ribosome binding. When CsrA was bound to the cstA transcript prior to the addition of 30S ribosomes and tRNAfMet, several of the CsrA-dependent toeprint bands were observed, whereas the ribosome toeprint was considerably reduced (Fig. 5). These results demonstrate that bound CsrA inhibits ribosome binding to the cstA transcript. When taken together with the in vivo expression and coupled-transcription-translation results demonstrating that CsrA regulates cstA expression and CstA synthesis, respectively, the toeprint results establish that CsrA regulates translation initiation of cstA by blocking ribosome access to the cstA ribosome binding site.
Identification of the CsrA binding sites in the cstA transcript.
Since the gel shift and toeprint results indicated that multiple molecules of CsrA can bind to the cstA transcript (Fig. 4 and 5), CsrA-cstA RNA footprint experiments were carried out to identify the CsrA binding sites. Three single-strand-specific RNases were used as probes for these studies. The results of the footprint experiments are presented in Fig. 7 and summarized in Fig. 6A. As the concentration of CsrA was increased from 0 to 4 μM, protection of several nucleotides from RNase T1 (G-specific), RNase T2 (A preference), and/or RNase A (C- and U-specific) cleavage was observed (Fig. 7). CsrA protected G17, G18, G29, G30, G52, G53, and G54 from RNase T1 cleavage, whereas cleavage at G42 and G64 was enhanced. For RNase T2, CsrA protected residues U10 to A19, A21, C22, A25, A27 to G29, A31, A34, A51 to G53, and A55, whereas cleavage was enhanced at residues A34, A36, A37, A40, U41, A43, A44, and A59. CsrA also protected residues U14, C21, C23, C26, C28, U32, C50, and C71 from RNase A cleavage, whereas cleavage of U77 was enhanced. Importantly, the sequence identified in silico that overlaps the cstA Shine-Dalgarno sequence was protected from RNase cleavage. The composite footprint indicates that CsrA protected three RNA segments (U10 to C22, A25 to A33, and C50 to A55) in addition to C71 (Fig. 6A).
FIG. 7.

CsrA-cstA RNA footprint and RNA structure mapping. 5′-end-labeled cstA RNA was treated with RNase T1, RNase T2, or RNase A. Reactions were carried out in the absence or presence of CsrA at the concentrations indicated at the top of the lanes. Lanes corresponding to mock-treated RNA (M) and control RNA (C), as well as partial hydrolysis (OH) and RNase T1 digestion (T1) ladders are shown. The RNase T1 ladder was generated under denaturing conditions so that every G residues in the transcript could be visualized. The nucleotides that were protected from RNase cleavage (−), as well as those that were enhanced for cleavage (+), by bound CsrA are shown at the right of each panel. Positions of the cstA Shine-Dalgarno (SD) sequence and start codon (Met) are shown. Numbering is from the start of cstA transcription.
Sequence analysis of the CsrA binding sites in glgC and CsrB RNA suggested that the majority of these sites contained GGA in the loops of short RNA hairpins (4, 29). Computer modeling using MFOLD (30, 53) did not predict any significant secondary structure in the cstA transcript used in this study. The finding that essentially every nucleotide between +5 and +65 was cleaved by at least one of the RNases in the absence of bound CsrA is consistent with the absence of significant RNA secondary structure in this segment of the cstA transcript (Fig. 7).
To more precisely define the CsrA binding sites, we performed a boundary analysis, a technique that is useful for delineating the 3′ and 5′ boundaries of an RNA binding target. Thus, information derived from a boundary experiment differs from the information obtained from a footprint analysis. Whereas a footprint reveals the nucleotides that are protected from enzymatic or chemical probes, boundary experiments separately reveal the 5′ and 3′ nucleotides that are required for binding. Thus, the two techniques complement one another. The results of the boundary analysis are presented in Fig. 8 and summarized in Fig. 6A. RNAs were 5′ or 3′ end labeled, base hydrolyzed, and subsequently incubated in the presence of 1 or 3 μM CsrA. Samples were fractionated through a native gel followed by autoradiography. In each case three diffuse bands, corresponding to CsrA-cstA RNA complexes with different stoichiometries, and a single band for unbound RNA were observed. The RNA from each of these bands was gel purified and subsequently fractionated side by side under denaturing conditions. The cutoffs for the 3′ boundary analysis (5′-end-labeled RNA) were relatively sharp. The experiment carried out with 1 μM CsrA revealed 3′ boundaries at positions G30, G53, and A70 (Fig. 8). An additional 3′ boundary at A19 was observed with 3 μM CsrA, suggesting that CsrA can independently bind to this site only at this higher protein concentration. Thus at a CsrA concentration of 3 μM, transcripts ending between positions 0 and 18 were unbound, while the transcripts ending at positions 19 to 29, 30 to 52, 53 to 69, and 70 to full-length RNA presumably had one, two, three, and four bound CsrA dimers, respectively. Taken together, the 3′ boundary results suggest that four CsrA binding sites are present in the cstA transcript (Fig. 6A and 8). The 5′ boundary analysis (3′-end-labeled RNA) was largely consistent with the 3′ boundary results. With 1 μM CsrA 5′ boundaries at A27 and G42 were observed. 5′ boundaries were also observed in the presence of 3 μM CsrA at U16, A36, and C50 (Fig. 8). As can be seen in Fig. 6A, paired 5′ and 3′ boundaries were observed in three cases. In each case, CsrA protected the residues between these boundary pairs from nucleolytic cleavage, indicating that each of these RNA segments is contained within a distinct CsrA binding site. As discussed below, our data suggest that an additional CsrA binding site is present between positions 65 and 75.
FIG. 8.

3′ and 5′ boundary analysis of CsrA-cstA RNA interaction. Limited alkaline hydrolysis ladders of cstA RNA were incubated with 1 or 3 μM CsrA. CsrA-RNA complexes were separated from unbound RNA on a native gel and subsequently fractionated through a 10% denaturing gel (shown). Lanes corresponding to distinct bound complexes (B1, B2, and B3) and unbound (U) RNA are shown. Lanes corresponding to limited base hydrolysis (OH) and RNase T1 digestion (T1) ladders are indicated. Arrows, positions of the boundaries. Roman numerals correspond to the CsrA binding sites depicted in Fig. 6. Short arrows, positions of 5′ boundaries that do not have corresponding 3′ boundaries. Numbering is from the start of cstA transcription.
DISCUSSION
cstA encodes a 701-amino-acid hydrophobic polypeptide (SWISS-PROT accession no. P15078) that appears to be a peptide permease (42). The cstA promoter and the effect of carbon starvation on its expression have been investigated previously (7, 31, 42, 43). The cst genes including cstA are activated by cAMP-CRP. Primer extension studies revealed three potential cstA transcription start sites, with the upstream site being the strongest. Potential Eσ70 −10 sequences are located upstream from each of these sites. Deletion of an apparent CRP binding target located 80 nt upstream from the 5′-most transcriptional start site eliminated expression from all three of these putative promoters (31). In vitro coupled-transcription-translation studies confirmed that cstA expression was dependent on cAMP and Eσ70 (7). Although there was some basal cstA expression during the exponential phase of cells grown in LB, expression was highest after glucose starvation; glucose depletion resulted in sixfold-higher expression (7).
CsrA of E. coli is a global regulatory RNA binding protein that controls the expression of genes involved in central carbon metabolism, motility, and biofilm development (23, 38, 48). CsrA binds specifically to the glgCAP leader transcript and blocks translation of glgC (4). Inhibition of glgC translation presumably leads to accelerated glgCAP mRNA decay (27, 28, 40). The identification of a potential CsrA binding site (GCACACGGAU) that overlapped the cstA Shine-Dalgarno sequence led us to investigate CsrA-dependent regulation of this gene. Our genetic analysis of the expression of a cstA′-′lacZ translational fusion demonstrates that expression of cstA is repressed by CsrA (Fig. 2). Although the difference in expression levels between wild-type and csrA mutant strains was a modest 1.5- to 2-fold when strains were grown in LB (Fig. 2A and B), there was a 5- to 10-fold difference when the same strains were grown in LB supplemented with 0.2% glucose (Fig. 2C). Results from the coupled-transcription-translation experiments demonstrating that CsrA inhibits CstA-LacZ synthesis (Fig. 3) are consistent with the results of the in vivo expression studies.
We also investigated the effect of rpoS (σS) on expression of cstA and found that transcription of this gene is σS independent. In fact, cstA expression increased two- to sixfold in rpoS mutant strains, although CsrA-dependent regulation was retained (Fig. 2D and E). In a previous study examining the lamB and mglBAD genes, which are responsible for the high-affinity pathway of glucose uptake in E. coli, it was shown that glucose limitation resulted in higher expression of these transporter genes in an rpoS mutant (35). Glucose limitation leads to the hunger response, which results in increased expression of many high-affinity transporter genes that are necessary for survival under low-nutrient conditions (18). It was shown that there is a selective advantage for bacteria when they lose σS under nutrient-limiting conditions (52). It was also reported that competition between σS and other sigma factors leads to reduced expression from non-σS promoters (16, 52). Our results suggest that expression of cstA is influenced by competition between σS and σ70 by a similar mechanism.
While results from the in vivo studies establish that CsrA regulates cstA expression (Fig. 2), the basic mechanism of CsrA-mediated control was revealed by in vitro analyses. Note that the cstA transcript used in these studies contained all three of the putative transcription start sites (discussed above). CsrA is a homodimer (Fig. 1) that binds specifically to the cstA transcript (Fig. 4), thereby inhibiting ribosome binding (Fig. 5). The finding that CsrA-cstA RNA complex formation was cooperative suggested that the transcript used in these studies contained multiple CsrA targets. Footprinting and boundary analyses confirmed the presence of three and possibly four CsrA binding sites in the cstA transcript (Fig. 6 to 8). The gel shift data indicate that interaction of CsrA with the cstA transcript is highly cooperative. Twofold increases in CsrA concentration resulted in the disappearance of one species and the appearance of a slower-migrating species (Fig. 4). This gel shift pattern is similar to what was previously observed for CsrA interaction with glgC, csrB, and csrC transcripts (4, 49). This gel shift pattern indicates that multiple CsrA dimers were bound to each cstA transcript at these higher concentrations. Note that the number of distinct complexes exceeds the number of CsrA binding sites that we identified in the transcript, suggesting that some of the CsrA dimers present in the slower-migrating complexes bind only via protein-protein interactions and not by directly interacting with RNA. Based on the footprinting data, one of the CsrA binding sites (site II) extends from A25 to A33 and overlaps the cstA Shine-Dalgarno sequence. A second site, which is positioned just upstream (site I), extends from U10 to C22 (Fig. 6). The fact that these two CsrA binding sites are adjacent to one another, combined with the finding that the CsrA-cstA interaction is cooperative (Fig. 4), suggests that protein-protein contacts likely contribute to CsrA-cstA RNA complex formation. The third binding site (site III), which extends from C50 to A55, is just downstream from the start of cstA translation and overlaps the position of the ribosome toeprint (Fig. 6A). Thus, CsrA bound to each of these sites would directly interfere with ribosome binding. In addition to these three sites, there is some evidence for a fourth binding site further downstream (site IV). Residue C71 was protected from RNase cleavage, and a 3′ boundary between A70 and C71 was observed. Furthermore, the sequence of this RNA segment is similar to those of other known CsrA targets (see below). However, in this case a corresponding 5′ boundary was not observed. In the 5′ boundary analysis this would be the only remaining binding site in the transcript. Perhaps the affinity of CsrA for this site is relatively weak, and occupancy of this site may require protein-protein contact with another bound CsrA molecule. 5′ boundaries between binding sites II and III were also observed (Fig. 6A). The finding that bound CsrA led to enhanced RNase cleavage in this RNA segment and the absence of corresponding 3′ boundaries suggest that these 5′ boundaries are artifacts. Taken together, our results establish that CsrA binds to three or four sites in the cstA transcript and that bound CsrA inhibits CstA synthesis by sterically interfering with ribosome binding.
Both glgC (glycogen biosynthesis) and cstA (carbon starvation) are involved in carbon metabolism. Interestingly, expression of both genes is activated by cAMP-CRP and repressed by CsrA. Nevertheless, these two regulatory systems do not invariably act antagonistically to regulate gene expression. CsrA and cAMP-CRP both activate motility in E. coli through effects on flhDC expression (48). In addition, the effects of CsrA on glycogen synthesis are mediated independently of crp and cya (40). CsrA regulates gene expression posttranscriptionally, and its steady-state levels accumulate only moderately at the transition to stationary phase (20). Thus, CsrA regulation generally does not determine the temporal pattern of gene expression but is superimposed on it (40).
CsrA was previously shown to regulate glgC expression by a translation control mechanism that is similar to what was found for cstA; however, one key distinction between the two regulatory mechanisms is that CsrA binding to glgCAP leader RNA is not cooperative (4). Two CsrA binding sites in the glgCAP leader transcript were identified. The downstream site overlaps the glgC Shine-Dalgarno sequence and is single stranded (4). In contrast, the upstream binding site has the potential of being partially sequestered in a short RNA hairpin, a situation that is similar to several of the presumed CsrA binding sites in CsrB RNA (4, 29). However, in each of these binding sites the most highly conserved sequence element (GGA) is located in the loop of the putative hairpin. Furthermore, for glgC it was found that the RNA secondary structure is unstable (4). Since the cstA transcript used in our studies did not have any stable secondary structure, it is likely that CsrA binds preferentially to single-stranded RNA. A sequence alignment of the known (glgC and cstA) and presumed (CsrB and CsrC) CsrA binding sites in E. coli is shown in Fig. 6B. From this alignment it is apparent that the GGA in the center of the consensus YANGGANR is the most highly conserved element. Interestingly, the ANGGA residues are conserved in the presumed CsrA binding targets in Pseudomonas species that were identified genetically (8).
Csr systems regulate a variety of important genes and processes in several other organisms as well. In addition to hydrogen cyanide production and exoprotease production in Pseudomonas species (8), control of both of the quorum-sensing systems in P. aeruginosa is by CsrA (RsmA) (37). Furthermore, the CsrA homolog in Erwinia species (RsmA) regulates quorum sensing and a variety of genes involved in soft-rot disease of higher plants (11, 12, 24). In addition, CsrA and CsrB regulate epithelial cell invasion by Salmonella enterica (1, 2), and CsrA (RsmA) affects swarming and other activities of Proteus mirabilis and Legionella pneumophila (17, 26). Despite the importance of Csr as a global regulator of bacterial physiology and pathogenesis, the molecular mechanism(s) of CsrA-mediated gene regulation has been elucidated only for glgC and cstA of E. coli. While it appears that the three genes in Pseudomonas species are regulated by translation control mechanisms similar to those for E. coli glgC and cstA, it is clear that CsrA-mediated positive control (e.g., E. coli flhDC) (48) must occur by a different mechanism.
Acknowledgments
A. K. Dubey and C. S. Baker contributed equally to this work.
We thank Sarah Ades and Mike Cashel for providing bacterial strains and Paul Lovett for E. coli 30S ribosomal subunits. We also thank Alexander Yakhnin and Janell Schaak for technical assistance.
This work was supported by grant GM59969 from the National Institutes of Health. The MALDI-time of flight mass spectrometer was purchased with funds from National Institutes of Health grant RR11318.
REFERENCES
- 1.Allen, C. A., P. J. Fedorka-Cray, A. Vazquez-Torres, M. Suyemoto, C. Altier, L. R. Ryder, F. C. Fang, and S. J. Libby. 2001. In vitro and in vivo assessment of Salmonella enterica serovar Typhimurium DT104 virulence. Infect. Immun. 69:4673-4677. [DOI] [PMC free article] [PubMed] [Google Scholar]
- 2.Altier, C., M. Suyemoto, and S. D. Lawhon. 2000. Regulation of Salmonella enterica serovar Typhimurium invasion genes by csrA. Infect. Immun. 68:6790-6797. [DOI] [PMC free article] [PubMed] [Google Scholar]
- 3.Babitzke, P., J. T. Stults, S. J. Shire, and C. Yanofsky. 1994. TRAP, the trp RNA-binding attenuation protein of Bacillus subtilis, is a multisubunit complex that appears to recognize G/UAG repeats in the trpEDCFBA and trpG transcripts. J. Biol. Chem. 269:16597-16604. [PubMed] [Google Scholar]
- 4.Baker, C. S., I. Morozov, K. Suzuki, T. Romeo, and P. Babitzke. 2002. CsrA regulates glycogen biosynthesis by preventing translation of glgC in Escherichia coli. Mol. Microbiol. 44:1599-1610. [DOI] [PubMed] [Google Scholar]
- 5.Bevilacqua, J. M., and P. C. Bevilacqua. 1998. Thermodynamic analysis of an RNA combinatorial library contained in a short hairpin. Biochemistry 37:15877-15884. [DOI] [PubMed] [Google Scholar]
- 6.Bevilacqua, P. C., C. X. George, C. E. Samuel, and T. R. Cech. 1998. Binding of the protein kinase PKR to RNAs with secondary structure defects: role of the tandem A-G mismatch and noncontiguous helixes. Biochemistry 37:6303-6316. [DOI] [PubMed] [Google Scholar]
- 7.Blum, P. H., S. B. Jovanovich, M. P. McCann, J. E. Schultz, S. A. Lesley, R. R. Burgess, and A. Matin. 1990. Cloning and in vivo and in vitro regulation of cyclic AMP-dependent carbon starvation genes from Escherichia coli. J. Bacteriol. 172:3813-3820. [DOI] [PMC free article] [PubMed] [Google Scholar]
- 8.Blumer, C., S. Heeb, G. Pessi, and D. Haas. 1999. Global GacA-steered control of cyanide and exoprotease production in Pseudomonas fluorescens involves specific ribosome binding sites. Proc. Natl. Acad. Sci. USA 96:14073-14078. [DOI] [PMC free article] [PubMed] [Google Scholar]
- 9.Boyd, D., D. S. Weiss, J. C. Chen, and J. Beckwith. 2000. Towards single-copy gene expression systems making gene cloning physiologically relevant: lambda InCh, a simple Escherichia coli plasmid-chromosome shuttle system. J. Bacteriol. 182:842-847. [DOI] [PMC free article] [PubMed] [Google Scholar]
- 10.Chamberlain, J. P. 1979. Fluorographic detection of radioactivity in polyacrylamide gels with the water-soluble fluor, sodium salicylate. Anal. Biochem. 98:842-847. [DOI] [PubMed] [Google Scholar]
- 11.Cui, Y., A. Chatterjee, Y. Liu, C. K. Dumenyo, and A. K. Chatterjee. 1995. Identification of a global repressor gene, rsmA, of Erwinia carotovora subsp. carotovora that controls extracellular enzymes, N-(3-oxohexanoyl)-l-homoserine lactone, and pathogenicity in soft-rotting Erwinia spp. J. Bacteriol. 177:5108-5115. [DOI] [PMC free article] [PubMed] [Google Scholar]
- 12.Cui, Y., A. Mukherjee, C. K. Dumenyo, Y. Liu, and A. K. Chatterjee. 1999. rsmC of the soft-rotting bacterium Erwinia carotovora subsp. carotovora negatively controls extracellular enzyme and hairpin (Ecc) production and virulence by modulating levels of regulatory RNA (rsmB) and RNA-binding protein (RsmA). J. Bacteriol. 181:6042-6052. [DOI] [PMC free article] [PubMed] [Google Scholar]
- 13.Du, H., and P. Babitzke. 1998. trp RNA-binding attenuation protein-mediated long distance RNA refolding regulates translation of trpE in Bacillus subtilis. J. Biol. Chem. 273:20494-20503. [DOI] [PubMed] [Google Scholar]
- 14.Du, H., A. V. Yakhnin, S. Dharmaraj, and P. Babitzke. 2000. trp RNA-binding attenuation protein (TRAP)-5′ stem-loop RNA interaction is required for proper transcription attenuation control of the Bacillus subtilis trpEDCFBA operon. J. Bacteriol. 182:1819-1827. [DOI] [PMC free article] [PubMed] [Google Scholar]
- 15.Du, H., R. Tarpey, and P. Babitzke. 1997. The trp RNA-binding attenuation protein regulates TrpG synthesis by binding to the trpG ribosome binding site of Bacillus subtilis. J. Bacteriol. 179:2582-2586. [DOI] [PMC free article] [PubMed] [Google Scholar]
- 16.Farewell, A., K. Kvint, and T. Nystrom. 1998. Negative regulation by RpoS: a case of sigma factor competition. Mol. Microbiol. 29:1039-1051. [DOI] [PubMed] [Google Scholar]
- 17.Fettes, P. S., V. Forsbach-Birk, D. Lynch, and R. Marre. 2001. Overexpression of a Legionella pneumophila homologue of the E. coli regulator CsrA affects cell size, flagellation, and pigmentation. Int. J. Med. Microbiol. 291:353-360. [DOI] [PubMed] [Google Scholar]
- 18.Finkel, S. E., E. R. Zinser, and R. Kolter. 2000. Long-term survival and evolution in the stationary phase, p. 231-238. In G. Storz and R. Hengge-Aronis (ed.), Bacterial stress responses. American Society for Microbiology, Washington, D.C.
- 19.Gottesman, S. 1984. Bacterial regulation: global regulatory networks. Annu. Rev. Genet. 18:415-441. [DOI] [PubMed] [Google Scholar]
- 20.Gudapaty, S., K. Suzuki, X. Wang, P. Babitzke, and T. Romeo. 2001. Regulatory interactions of Csr components: the RNA binding protein CsrA activates csrB transcription in Escherichia coli. J. Bacteriol. 183:6017-6027. [DOI] [PMC free article] [PubMed] [Google Scholar]
- 21.Hartz, D., D. S. McPheeters, R. Traut, and L. Gold. 1988. Extension inhibition analysis of translation initiation complexes. Methods Enzymol. 164:419-425. [DOI] [PubMed] [Google Scholar]
- 22.Huang, Z., and J. W. Szostak. 1996. A simple method for 3′-labeling of RNA. Nucleic Acids Res. 24:4360-4361. [DOI] [PMC free article] [PubMed] [Google Scholar]
- 23.Jackson, D. W., K. Suzuki, L. Oakford, J. W. Simecka, M. E. Hart, and T. Romeo. 2002. Biofilm formation and dispersal under the influence of the global regulator CsrA of Escherichia coli. J. Bacteriol. 184:290-301. [DOI] [PMC free article] [PubMed] [Google Scholar]
- 24.Koiv, V., and A. Mae. 2001. Quorum sensing controls the synthesis of virulence factors by modulating rsmA gene expression in Erwinia carotovora subsp. carotovora. Mol. Genet. Genomics 265:287-292. [DOI] [PubMed] [Google Scholar]
- 25.Kolter, R., D. A. Siegele, and A. Tormo. 1993. The stationary phase of the bacterial life cycle. Annu. Rev. Microbiol. 47:855-874. [DOI] [PubMed] [Google Scholar]
- 26.Liaw, S. J., H. C. Lai, S. W. Ho, K. T. Luh, and W. B. Wang. 2003. Role of RsmA in the regulation of swarming motility and virulence factor expression in Proteus mirabilis. J. Med. Microbiol. 52:19-28. [DOI] [PubMed] [Google Scholar]
- 27.Liu, M. Y., and T. Romeo. 1997. The global regulator CsrA of Escherichia coli is a specific mRNA-binding protein. J. Bacteriol. 179:4639-4642. [DOI] [PMC free article] [PubMed] [Google Scholar]
- 28.Liu, M. Y., H. Yang, and T. Romeo. 1995. The product of the pleiotropic Escherichia coli gene csrA modulates glycogen biosynthesis via effects on mRNA stability. J. Bacteriol. 177:2663-2672. [DOI] [PMC free article] [PubMed] [Google Scholar]
- 29.Liu, M. Y., G. Gui, B. Wei, J. F. Preston III, L. Oakford, U. Yuksel, D. P. Giedroc, and T. Romeo. 1997. The RNA molecule CsrB binds to the global regulatory protein CsrA and antagonizes its activity in Escherichia coli. J. Biol. Chem. 272:17502-17510. [DOI] [PubMed] [Google Scholar]
- 30.Mathews, D. H., J. Sabina, M. Zuker, and D. H. Turner. 1999. Expanded sequence dependence of thermodynamic parameters improves prediction of RNA secondary structure. J. Mol. Biol. 288:911-940. [DOI] [PubMed] [Google Scholar]
- 31.Matin, A. 1991. The molecular basis of carbon-starvation-induced general resistance in Escherichia coli. Mol. Microbiol. 5:3-10. [DOI] [PubMed] [Google Scholar]
- 32.Matin, A. 1996. Role of alternate sigma factors in starvation protein synthesis—novel mechanisms of catabolite repression. Res. Microbiol. 147:494-505. [DOI] [PubMed] [Google Scholar]
- 33.Miller, J. H. 1972. Experiments in molecular genetics, p. 352-355. Cold Spring Harbor Laboratory, Cold Spring Harbor, N.Y.
- 34.Niedhardt, F., and M. A. Savageau. 1996. Regulation beyond the operon, p. 1210-1324. In. F. C. Niedhartdt, R. Curtiss III, J. L. Ingraham, E. C. C. Lin, K. B. Low, B. Magasanik, W. S. Reznikoff, M. Riley, M. Schaechter, and H. E. Umbarger (ed.), Escherichia coli and Salmonella: cellular and molecular biology. American Society for Microbiology, Washington, D.C.
- 35.Notley-McRobb, L., T. King, and T. Ferenci. 2002. rpoS mutations and loss of general stress resistance in Escherichia coli populations as a consequence of conflict between competing stress responses. J. Bacteriol. 184:806-811. [DOI] [PMC free article] [PubMed] [Google Scholar]
- 36.Pernestig, A.-K., Ö. Melefors, and D. Georgellis. 2001. Identification of UvrY as the cognate response regulator for the BarA sensor kinase in Escherichia coli. J. Biol. Chem. 276:225-231. [DOI] [PubMed] [Google Scholar]
- 37.Pessi, G., F. Williams, Z. Hindle, K. Heurlier, M. T. Holden, M. Camara, D. Haas, and P. Williams. 2001. The global posttranscriptional regulator RsmA modulates production of virulence determinants and N-acylhomoserine lactones in Pseudomonas aeruginosa. J. Bacteriol. 183:6676-6683. [DOI] [PMC free article] [PubMed] [Google Scholar]
- 38.Romeo, T. 1998. Global regulation by the small RNA-binding protein CsrA and the non-coding RNA molecule CsrB. Mol. Microbiol. 29:1321-1330. [DOI] [PubMed] [Google Scholar]
- 39.Romeo, T., and J. Preiss. 1989. Genetic regulation of glycogen biosynthesis in Escherichia coli: in vitro effects of cyclic AMP and guanosine 5′-diphosphate 3′-diphosphate and analysis of in vivo transcripts. J. Bacteriol. 171:2773-2782. [DOI] [PMC free article] [PubMed] [Google Scholar]
- 40.Romeo, T., M. Gong, M. Y. Liu, and A. M. Brun-Zinkernagel. 1993. Identification and molecular characterization of csrA, a pleiotropic gene from Escherichia coli that affects glycogen biosynthesis, gluconeogenesis, cell size, and surface properties. J. Bacteriol. 175:4744-4755. [DOI] [PMC free article] [PubMed] [Google Scholar]
- 41.Sabnis, N. A., H. Yang, and T. Romeo. 1995. Pleiotropic regulation of central carbohydrate metabolism in Escherichia coli via the gene csrA. J. Biol. Chem. 270:29096-29104. [DOI] [PubMed] [Google Scholar]
- 42.Schultz, J. E., and A. Matin. 1991. Molecular and functional characterization of a carbon starvation gene of Escherichia coli. J. Mol. Biol. 218:129-140. [DOI] [PubMed] [Google Scholar]
- 43.Schultz, J. E., G. I. Latter, and A. Matin. 1988. Differential regulation by cyclic AMP of starvation protein synthesis in Escherichia coli. J. Bacteriol. 170:3903-3909. [DOI] [PMC free article] [PubMed] [Google Scholar]
- 44.Silhavy, T. J., M. L. Berman, and L. W. Enquist. 1984. Experiments with gene fusions. Cold Spring Harbor Laboratory, Cold Spring Harbor, N.Y.
- 45.Suzuki, K., X. Wang, T. Weilbacher, A.-K. Pernestig, Ö. Melefors, D. Georgellis, P. Babitzke, and T. Romeo. 2002. Regulatory circuitry of the CsrA/CsrB and BarA/UvrY systems of Escherichia coli. J. Bacteriol. 184:5130-5140. [DOI] [PMC free article] [PubMed] [Google Scholar]
- 46.van Montfort, B. A., B. Canas, R. Duurkens, J. Godovac-Zimmermann, and G. T. Robillard. 2002. Improved in-gel approaches to generate peptide maps of integral membrane proteins with matrix-assisted laser desorption/ionization time-of-flight mass spectrometry. J. Mass Spectrom. 37:322-330. [DOI] [PubMed] [Google Scholar]
- 47.Wei, B., S. Shin, D. LaPorte, A. J., Wolfe, and T. Romeo. 2000. Global regulatory mutations in csrA and rpoS cause severe central carbon stress in Escherichia coli in the presence of acetate. J. Bacteriol. 182:1632-1640. [DOI] [PMC free article] [PubMed] [Google Scholar]
- 48.Wei, B. L., A. M. Brun-Zinkernagel, J. W. Simecka, B. M. Pruss, P. Babitzke, and T. Romeo. 2001. Positive regulation of motility and flhDC expression by the RNA-binding protein CsrA of Escherichia coli. Mol. Microbiol. 40:245-256. [DOI] [PubMed] [Google Scholar]
- 49.Weilbacher, T., K. Suzuki, A. K. Dubey, X. Wang, S. Gudapaty, I. Morozov, C. S. Baker, D. Georgellis, P. Babitzke, and T. Romeo. 2003. A novel sRNA component of the carbon storage regulatory system of Escherichia coli. Mol. Microbiol. 48:657-670. [DOI] [PubMed] [Google Scholar]
- 50.Yakhnin, A. V., J. J. Trimble, C. R. Chiaro, and P. Babitzke. 2000. Effects of mutations in the L-tryptophan binding pocket of the trp RNA-binding attenuation protein of Bacillus subtilis. J. Biol. Chem. 275:4519-4524. [DOI] [PubMed] [Google Scholar]
- 51.Yang, H., M. Y. Liu, and T. Romeo. 1996. Coordinate genetic regulation of glycogen catabolism and biosynthesis in Escherichia coli via the CsrA gene product. J. Bacteriol. 178:1012-1017. [DOI] [PMC free article] [PubMed] [Google Scholar]
- 52.Zambrano, M. M., D. A. Siegele, M. Almiron, A. Tormo, and R. Kolter. 1993. Microbial competition: Escherichia coli mutants that take over stationary phase cultures. Science 259:1757-1760. [DOI] [PubMed] [Google Scholar]
- 53.Zuker, M., D. H. Mathews, and D. H. Turner. 1999. Algorithms and thermodynamics for RNA secondary structure prediction: a practical guide, p. 11-43. In J. Barciszewski and B. F. C. Clark (ed.), RNA biochemistry and biotechnology. Proceedings of the NATO Advanced Research Workshop on RNA Biochemistry and Biotechnology. NATO ASI series, vol. 70. Kluwer Academic Publishers, Dordrecht, The Netherlands. [Google Scholar]