Abstract
A need exists for technologies that permit the direct quantification of differences in protein and posttranslationally modified protein expression levels. Here we present a strategy for the absolute quantification (termed AQUA) of proteins and their modification states. Peptides are synthesized with incorporated stable isotopes as ideal internal standards to mimic native peptides formed by proteolysis. These synthetic peptides can also be prepared with covalent modifications (e.g., phosphorylation, methylation, acetylation, etc.) that are chemically identical to naturally occurring posttranslational modifications. Such AQUA internal standard peptides are then used to precisely and quantitatively measure the absolute levels of proteins and posttranslationally modified proteins after proteolysis by using a selected reaction monitoring analysis in a tandem mass spectrometer. In the present work, the AQUA strategy was used to (i) quantify low abundance yeast proteins involved in gene silencing, (ii) quantitatively determine the cell cycle-dependent phosphorylation of Ser-1126 of human separase protein, and (iii) identify kinases capable of phosphorylating Ser-1501 of separase in an in vitro kinase assay. The methods described here represent focused, alternative approaches for studying the dynamically changing proteome.
Proteomics is the systematic identification and characterization of proteins for their structure, function, activity, quantity, and molecular interactions. The subfield of quantitative proteomics seeks to provide information about both protein and modified protein expression levels. For >25 years, two-dimensional gel electrophoresis (2DE) has provided the ability to separate and quantify many protein products simultaneously in a single gel (1). Quantification is most commonly achieved in two-dimensional gels by protein staining. Comparative analysis is accomplished by direct comparison of gels representing cells from different states. Proteins from gel spots of interest are identified by MS. Unfortunately, when whole-cell lysates are examined 2DE is highly selective for abundant proteins and does not allow for the detection of regulatory proteins (e.g., protein kinases, transcription factors, etc.) (2, 3).
Alternative strategies to two-dimensional gel electrophoresis for proteome analysis generally are based on increasing levels of protein and peptide separation coupled with amino acid sequence analysis by tandem MS (MS/MS). Currently, several studies report the analysis by MS/MS of >1,000 proteins directly from proteolyzed cell lysates (4–8). In addition, beginning in 1999 these techniques were combined with stable isotope labeling as a means to conduct quantitative studies (9–11). In these experiments, two protein samples are compared in which one is labeled with heavy isotopes (e.g., 2H, 13C, 15N, etc.) either by growing the cells in media enriched in stable isotopes (9) or after protein isolation by alkylation with stable isotope-containing reagents (10, 11). The comparative analysis of posttranslationally modified proteins, however, has proven to be a much more difficult challenge.
In contrast to the relative quantification strategies just described, it is also possible to use synthetic peptides with incorporated stable isotopes to provide absolute protein quantification. In 1996, Barr et al. (12) measured the amount of apolipoprotein A1 in a purified protein reference standard by synthesizing deuterium-labeled peptides corresponding to their native counterparts formed by proteolysis. The analysis was performed by liquid chromatography (LC)–MS with continuous-flow fast atom bombardment for peptide ionization. More recently, the levels of highly expressed rhodopsin protein were determined by synthesizing a deuterium-labeled peptide and performing a directed LC–MS/MS experiment using selected-reaction monitoring (SRM) of a trypsinized membrane preparation (13). In the present work we have significantly extended these ideas in two ways. First, the technique has been expanded to measure the precise amounts of posttranslationally modified (phosphorylated) proteins. Second, the analyses have been performed directly from whole-cell lysates separated by SDS/PAGE.
Materials and Methods
Preparation of Absolute Quantification (AQUA) Internal Standard Peptides. All peptides were synthesized by fluorenylmethoxycarbonyl chemistry on a Rainin Protein Technologies (Woburn, MA) peptide synthesizer. A detailed description of peptide synthesis is contained in Supporting Materials and Methods, which is published as supporting information on the PNAS web site, www.pnas.org.
In-Gel Digestion and Peptide Sample Preparation. In-gel digestion was performed essentially as described (14), with the exception that the ammonium bicarbonate buffer used to dilute trypsin to the final digestion concentration also contained the relevant internal standard peptides. The amount of trypsin added was 25 ng/μl of buffer or ≈1 μg per band. After incubation overnight (12–16 h), gel pieces were centrifuged at 14,000 rpm for 5 min, then extracted twice with 5% formic acid/50% acetonitrile directly into deactivated glass limited volume inserts (Agilent, Palo Alto, CA), dried by vacuum centrifugation, and stored at —20°C until ready for analysis.
On-Line Microcapillary LC–Tandem MS. A detailed description of the analytical setup is contained in Supporting Materials and Methods. MS/MS was performed by using ThermoFinnigan (San Jose, CA) mass spectrometers (LCQ DecaXP ion trap for separase Ser-1126 profiling; TSQ Quantum triple quadrupole for all others). On the DecaXP, parent ions were isolated at 1.6 m/z width, the ion injection time was limited to 150 ms per microscan, with two microscans per peptide averaged, with an AGC setting of 1 × 10⁸; on the Quantum, Q1 was kept at 0.4 and Q3 at 0.8 m/z with a scan time of 200 ms per peptide. On both instruments, analyte and internal standard were analyzed in alternation within a previously known reverse-phase retention window; well-resolved pairs of internal standard and analyte were analyzed in separate retention segments to improve duty cycle. Data were processed by integrating the appropriate peaks in an extracted ion chromatogram (±0.15 m/z from the fragment monitored) for the native and internal standard, followed by calculation of the ratio of peak areas multiplied by the absolute amount of internal standard (e.g., 500 fmol).
Analysis of Myoglobin in a Yeast Background. For linearity, horse heart myoglobin was spiked into a whole yeast background over a concentration range of 5 orders of magnitude (300 amol to 30 pmol/50 μg of protein from whole yeast lysate) and separated on 4–12% SDS/PAGE minigels (Invitrogen) with protein visualization by Coomassie staining. Regions of the gel corresponding to the molecular mass range from 14 to 22 kDa were excised and subjected to in-gel digestion in the presence of 500 fmol of each myoglobin AQUA peptide (LFTGHPETL*EK and ALEL*FR, where L* denotes isotopically enriched leucine). For determining extent of trypsinization, 300 fmol myoglobin was diluted in 50 μg protein from whole yeast lysate and resolved by SDS/PAGE as above. Varying amounts of trypsin from 50 pg to 1 μg were incubated during digestion in the presence of 500 fmol of each internal standard for 6 h, followed by extraction and analysis by LC–SRM. Four SRM transitions were monitored for the two pairs of native and internal standard peptides (in m/z): 636.4 → 716.4 and 639.9 → 723.4 for the LFTGHPETLEK pair, and 374.8 → 564.2 and 378.3 → 571.2 for the ALELFR pair.
Analysis of Yeast Silent Information Regulatory (Sir)2 and Sir4 Proteins. A detailed description of the yeast culture protocol and protein copy number calculation is contained in Supporting Materials and Methods. For each analysis, 4 μl of lysate was mixed with 5 μl of sample buffer, 9 μl of 1.5 M urea, and 2 μl of reducing agent (Invitrogen) and reduced at 57°C for 20 min, of which 10 μl was resolved by SDS/PAGE (4–12% Bis-Tris minigel, Mes running buffer; Invitrogen) and lightly stained with Coomassie. Excised gel regions corresponding to 63.3-kDa Sir2 (55–66 kDa) and 152-kDa Sir4 (120–180 kDa) were digested with trypsin in the presence of 150 fmol of the AQUA peptides IYSPL*HSFIK (Sir2) and QFDSIF*NSNK (Sir4). A more selective fragment ion for Sir4 was obtained by first subjecting the parent ion to in-source collision-induced dissociation, in which 17 Da was lost, followed by LC–SRM on the in situ-derived precursor. The SRM m/z transitions 602.8 → 928.5 and 606.3 → 935.5 were used for Sir2 and 592.5 → 609.1 and 597.5 → 619.1 for Sir4 native and internal standard peptides, respectively.
Human Separase Ser-1126 Phosphorylation Profiling. Isolation of total soluble protein from synchronized HeLa cells has been described (15), followed by separation by SDS/PAGE. Excised gel regions corresponding to full-length (200–250 kDa) and partially cleaved (130–180 kDa) separase were digested with tr ypsin in the presence of the AQUA peptides EPGPIAPSTNSSPVL*K and EPGPIAPSTNS(pS)PVL*K (150 and 100 fmol, respectively), followed by LC–SRM of the entire sample. A detailed description of the analysis of 16 μg of protein from whole HeLa cell lysate is contained in Supporting Materials and Methods.
Human Separase Ser-1501 in Vitro Kinase Assay. A detailed description of cell culture and analytical setup is contained in Supporting Materials and Methods. The selected-ion monitoring m/z values 456.2, 459.7, 560.3, and 563.8 (±0.15 m/z) were monitored to determine the amount of native and internal standard peptides for nonphosphorylated and phosphorylated separase, respectively, at Ser-1501.
Results and Discussion
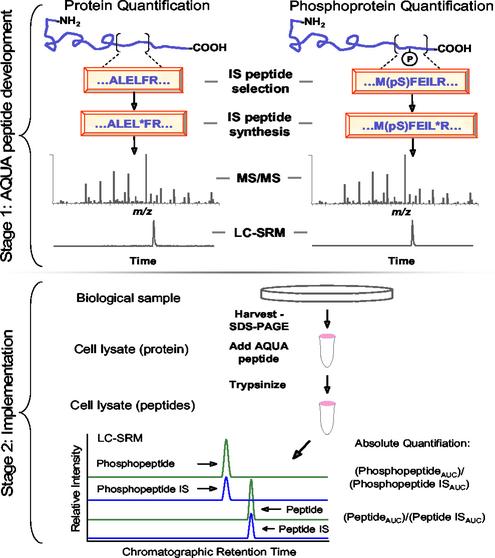
The AQUA Strategy for the Absolute Quantification of Proteins and Phosphoproteins. A scheme depicting the AQUA process for the quantitative determination of the expression levels of a given protein and phosphoprotein is shown in Fig. 1. The strategy has two stages: peptide internal standard selection and validation, and method development and implementation. To develop a suitable internal standard, a peptide (or modified peptide) is chosen based on amino acid sequence and the protease to be used. The peptide is then generated by solid-phase peptide synthesis such that one residue (e.g., a leucine in Fig. 1) is replaced with that same residue containing stable isotopes (e.g., six 13C and one 15N atoms in Fig. 1). The result is a peptide that is chemically identical to its native counterpart formed by proteolysis, but is easily distinguishable by MS via a 7-Da mass shift. The newly synthesized AQUA internal standard peptide is then evaluated by LC–MS/MS. This process provides qualitative information about peptide retention by reverse-phase chromatography, ionization efficiency, and fragmentation via collision-induced dissociation. Informative and abundant fragment ions for sets of native and internal standard peptides are chosen and then specifically monitored in rapid succession as a function of chromatographic retention to form an SRM (LC–SRM) method.
Fig. 1.
Absolute quantification of proteins and phosphoproteins using the AQUA strategy. The strategy has two stages. Stage 1 involves the selection and standard synthesis of a peptide (or phosphopeptide denoted by pS) from the protein of interest. During synthesis, stable isotopes are incorporated (e.g., 13C, 15N, etc.) at a single amino acid residue such as the leucine shown here denoted by *. These peptide internal standards are analyzed by MS/MS to examine peptide fragmentation patterns. The mass spectrometer is next set up to perform a SRM analysis in which a specific precursor-to-product ion transition is measured. Stage 2 is the implementation of the new peptide internal standard for precise quantification. Protein is harvested from a biological sample and proteolyzed with trypsin in the presence of the AQUA internal standard peptide/phosphopeptide. An LC–SRM experiment then measures the abundance of a specific fragment ion from both the native peptide and the synthesized peptide as a function of reverse-phase chromatographic retention time. The absolute quantification is determined by comparing the abundance of the known AQUA internal standard peptide with the native peptide.
The second stage of the AQUA strategy is its implementation to measure the amount of a protein or modified protein from complex mixtures (Fig. 1). Whole-cell lysates are quickly fractionated by SDS/PAGE gel electrophoresis, and regions of the gel consistent with protein migration are excised. This process is followed by in-gel proteolysis in the presence of the AQUA peptides and LC–SRM analysis. The retention time and fragmentation pattern of the native peptide formed by trypsinization is identical to that of the AQUA internal standard peptide determined previously; thus, LC–MS/MS analysis using an SRM experiment results in the highly specific and sensitive measurement of both internal standard and analyte directly from extremely complex peptide mixtures. Because an absolute amount of the AQUA peptide is added (e.g., 250 fmol), the ratio of the areas under the curve can be used to determine the precise expression levels of a protein or phosphorylated form of a protein in the original cell lysate. In addition, the internal standard is present during in-gel digestion as native peptides are formed, such that peptide extraction efficiency from gel pieces, absolute losses during sample handling (including vacuum centrifugation), and variability during introduction into the LC–MS system do not affect the determined ratio of native and AQUA peptide abundances.
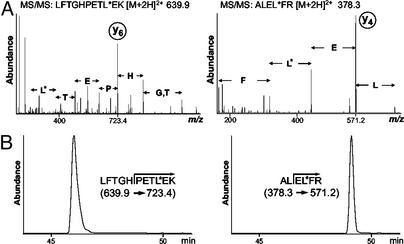
Analysis of Horse Heart Myoglobin in the Presence of Whole Yeast. To validate the method, two AQUA internal standard peptides containing stable isotopes were synthesized to correspond to two tryptic peptides from myoglobin (Fig. 2). The MS/MS spectra for each AQUA peptide exhibited a strong y-type ion peak as the most intense fragment ion (Fig. 2 A). An LC–SRM experiment was then designed to measure the amount of each peptide based on fragment ion production (Fig. 2B) across a reverse-phase gradient.
Fig. 2.
AQUA method development process for validation protein horse heart myoglobin. (A) MS/MS mass spectra of two synthetic, isotopically labeled peptides corresponding to native peptides from myoglobin formed by trypsin proteolysis. L* indicates a leucine with six 13C and one 15N atoms. The fragmentation pattern of each synthetic peptide revealed prominent y-type fragment ions suitable for monitoring. (B) LC–SRM traces for the specific parent-to-product ion transitions of 200 fmol of the two AQUA internal standard peptides for myoglobin using a 100-μm ID microcapillary LC column.
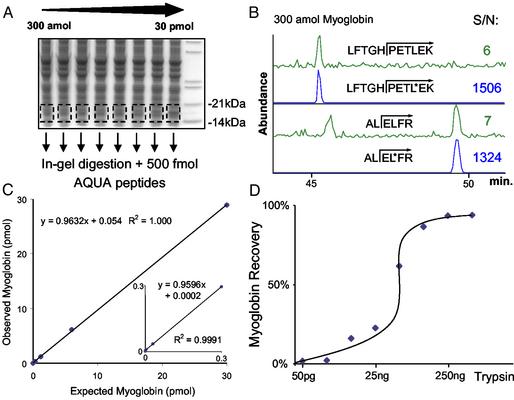
Horse heart myoglobin was spiked into whole yeast lysate at concentrations ranging across 5 orders of magnitude (300 amol–30 pmol). The cell lysates were separated by gel electrophoresis in triplicate (Fig. 3A). Generous regions of the gel were excised to correspond to myoglobin migration (14–21 kDa). In-gel digestion with trypsin was performed in the presence of 500 fmol of each AQUA internal standard peptide. Myoglobin levels were then quantified by examining the ratio of the areas under the curve for each respective pair of AQUA and native peptides after analysis by LC–SRM. Myoglobin was easily detectable by both AQUA peptides from a background of 50 μg of yeast protein, even at the 300-amol level (Fig. 3 B and C), whereas a blank sample containing only 50 μg of yeast lysate contained no detectable peak at the relevant retention times (data not shown). In addition, in Fig. 3C the slope of the curve for observed vs. expected myoglobin levels was ≈1.0 (0.963), signifying that the known amount of myoglobin added to the yeast lysate was nearly identical to the myoglobin levels measured. The same experiment was repeated with the amount of spiked myoglobin and AQUA peptides held constant (300 and 500 fmol, respectively) but varying the amount of trypsin added for in-gel digestion (Fig. 3D). The plateau in the curve suggests that trypsinization reached completion above 250 ng of trypsin under these conditions. Taken together, these data suggest that protein migration and trypsinization in polyacrylamide gels were extremely efficient and essentially complete. Finally, trypsinization has also been found to be satisfactory in previous studies of in-gel digestion and solution digests with stable isotope dilution of peptide internal standards (12, 13).
Fig. 3.
Validation of the AQUA method for horse heart myoglobin. (A) SDS/PAGE gel separation of 50 μg of yeast lysate spiked with standardized myoglobin protein at different amounts (300 amol to 30 pmol). Regions corresponding to migrated myoglobin were generously excised from the gel and digested with trypsin in the presence of 500 fmol of each AQUA internal standard peptide. (B) Analysis of 300 amol of myoglobin from a yeast background using the two AQUA peptides for reference and quantification by LC-SRM. The top trace of each pair represents the response for the “native” peptide formed by trypsinization, and the bottom trace corresponds to the same peptide synthesized with stable isotopes to have a mass difference of 7 Da. The peak area signal-to-noise is indicated for each determination. (C) Observed vs. expected response curve for the myoglobin quantification. (Inset) The low end of the curve (300 amol–300 fmol). (D) Effect of trypsin amount (50 pg to 1 μg) on the levels of myoglobin detected from the SDS/PAGE gel during a 6-h digestion. The same experiment as in A was performed, except the amount of spiked myoglobin (300 fmol) and AQUA peptides (500 fmol) was held constant while the amount of trypsin added for in-gel digestion varied. The curve plateaus when >250 ng trypsin was added, suggesting complete trypsinization.
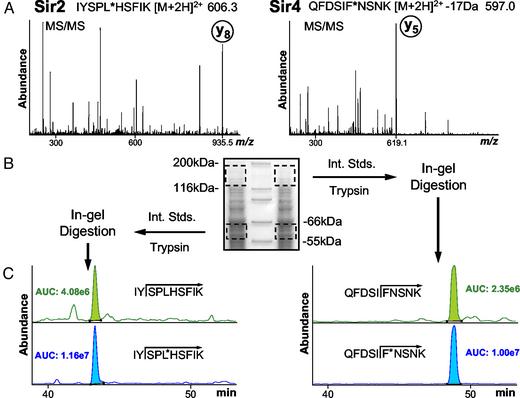
Absolute Quantification of Two Low-Abundance Yeast Proteins. The AQUA strategy was used to determine the endogenous expression levels of two yeast proteins involved in gene silencing. An AQUA internal standard peptide containing stable isotopes was synthesized to correspond to a tryptic peptide from Sir2 and Sir4 yeast proteins. Only a single peptide was chosen from each protein because of a wealth of previous experience in analyzing Sir proteins from affinity isolations. The peptides selected were never found to be modified in any previous analysis. In each AQUA peptide, stable isotopes were incorporated via a single residue (Fig. 4). The MS/MS spectra for both synthetic peptides showed an intense y-type ion suitable for monitoring in the SRM analysis.
Fig. 4.
AQUA analysis of endogenous yeast Sir proteins 2 and 4. (A) MS/MS mass spectra of the synthetic internal standard peptides IYSPL*HSFIK (Sir2) and QFDSIF*NSNK (Sir4) for product ion selection. The leucine and phenylalanine marked by * contained stable isotopes. (B) SDS/PAGE separation of 50 μg of yeast lysate per lane (1.8 × 10⁷ cells) visualized by Coomassie staining. Molecular mass regions corresponding to Sir2 (55–66 kDa) and Sir4 (120–180 kDa) were excised from both lanes and digested in-gel in the presence of 150 fmol of each internal standard peptide. (C)LC–SRM analysis for Sir2 and Sir4 expression levels. (Upper) The response for the native peptide formed by trypsinization. (Lower) The response for the respective AQUA internal standard peptide (150 fmol). Assuming no losses, the analysis resulted in a calculated expression level of 1,750 and 1,150 copies per cell for Sir2 and Sir4 protein, respectively, for yeast in an exponential growth phase.
Yeast lysate from 1.8 × 10⁷ cells was separated by SDS/PAGE. Regions of the gel representing the migration of Sir2 and Sir4, respectively, were excised. In-gel digestion with trypsin was performed in the presence of 150 fmol of each AQUA peptide. Protein quantification was achieved by an LC–SRM experiment for each pair of native and internal standard peptides. Assuming complete digestion and cell lysis, final expression levels of 1,750 and 1,150 copies per cell were determined for Sir2 and Sir4 proteins, respectively, in yeast growing through log phase.
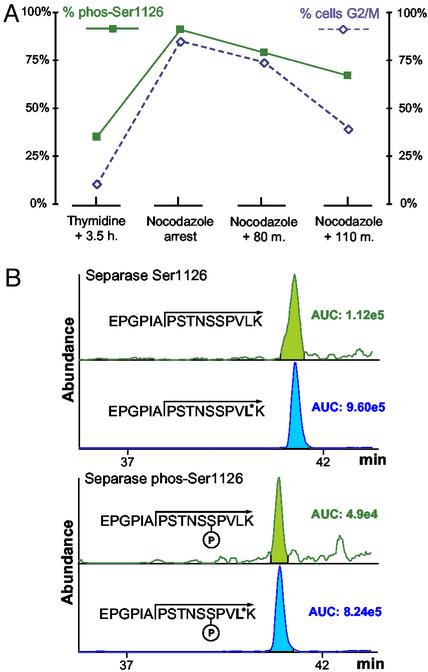
Quantitative Determination of the Cell Cycle-Dependent Phosphorylation of Ser-1126 of Human Separase. Separase is involved in cell cycle regulation and is phosphorylated on at least eight residues, including Ser-1126, a phosphorylation site recently demonstrated to negatively regulate its protease activity (15). Two different AQUA peptides were synthesized to represent the tryptic peptide and phosphopeptide containing Ser-1126: EPGPIAPSTNSSPVL*K and EPGPIAPSTNS(pS)PVL*K. The internal standard peptides were prepared with isotopically labeled leucine and used to develop selective LC–SRM analyses for the phosphorylation state of separase at that residue. Ser-1126 phosphorylation was measured in synchronized HeLaS3 cells 3.5 h after release from a double thymidine block (premitosis), during nocodazole arrest (mitotic entry), and at defined intervals after release from nocodazole (exit from mitosis). HeLaS3 lysate (400 μg) from each time point in the study was separated by SDS/PAGE. In-gel digestion in the presence of the two AQUA internal standard peptides (150 and 100 fmol, respectively) was followed by an LC–SRM experiment to quantify the abundance of the phosphorylated and nonphosphorylated Ser-1126. Separase was found to be quantitatively phosphor ylated at the anaphase-metaphase transition and subsequently dephosphorylated during progression into anaphase (Fig. 5A). This experiment demonstrated the capacity of the AQUA strategy for measuring dynamic changes in phosphorylation state directly from cell lysates.
Fig. 5.
Quantitative analysis of the phosphorylation state of Ser-1126 phosphorylation from human separase protein as a function of cell cycle. (A) Percent of phosphorylated Ser-1126 measured before, during, and after exit from mitosis in HeLa cells (▪). Percent of cells in G2/M phase of the cell cycle was also determined by fluorescence-activated cell sorting analysis (⋄). Separase is quantitatively (>98%) phosphorylated at the anaphase-metaphase transition (nocodozole arrest). The percent of phosphorylated Ser-1126 decreases after mitosis. (B) LC–SRM analysis of phosphorylated and nonphosphorylated separase Ser-1126. These data were acquired from the equivalent of only 16 μg of starting material and 10 fmol of each AQUA peptide on a high-resolution triple quadrupole mass spectrometer. The calculated percent of phosphorylation was 34%. Some of the data in this figure have been published previously. [Reproduced with permission from ref. 15 (Copyright 2001, Elsevier Science).]
The separase experiment performed above was analyzed with an ion-trap mass spectrometer and required starting amounts equivalent to 400 μg of HeLa lysate to detect and quantify phosphorylated and nonphosphorylated separase. The same experiment was repeated in a high-resolution triple quadrupole mass spectrometer with the result that the equivalent of only 16 μg of starting material was needed (Fig. 5B). Both phosphorylated separase and nonphosphorylated separase were detected and quantified. The difference in sample requirement (>10-fold) between the two instruments is likely caused by the broader dynamic range of the triple quadrupole instrument versus the ion trap in the context of a highly complex mixture such as trypsinized HeLa lysate.
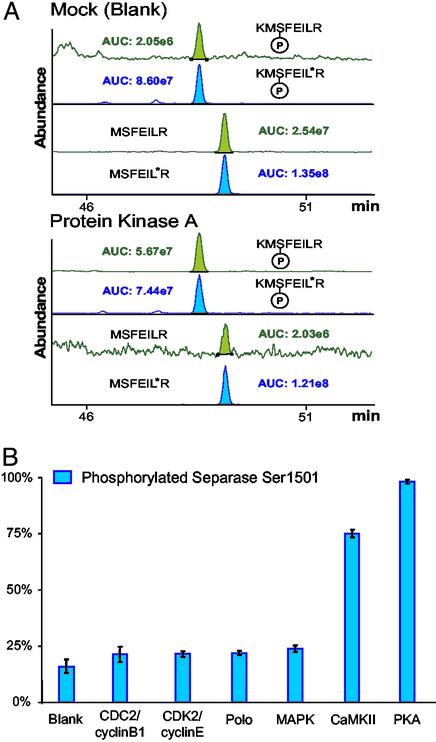
In Vitro Kinase Assay for Phosphorylation at Ser-1501 of Separase. Another important factor in obtaining accurate quantification is AQUA peptide and protease selection. Features such as “ragged ends” and reactive amino acids should be avoided if possible by an appropriate choice of protease and peptide. However, in some cases it may be necessary to use a difficult peptide. Site-specific phosphorylation of separase at Ser-1501 was determined by the AQUA strategy in response to incubation with a bank of relevant kinases (Fig. 6). Two AQUA internal standard peptides were synthesized to represent the nonphosphorylated and phosphorylated states of the protein: LTDNWRKMSFEIL*R and LTDNWRKM(pS)FEIL*R, with isotopic enrichment at the marked leucine residue. Peptides were synthesized with an extended N terminus and included in the in-gel digestion to allow for processing of both native and AQUA peptides by trypsin across a ragged end (i.e., .RK.), such that any preference for the production of either fully tryptic or partially tryptic native peptides is concomitantly accounted for in the internal standards. Because Ser-1508 (located two residues from the C terminus of the tryptic peptide for Ser-1501) has also been shown to be phosphorylated (15), a separase mutant was prepared (S1508A). Affinity-purified, mutant separase protein was reacted with different kinases or mock controls in the presence of ATP, followed by SDS/PAGE purification. In-gel digestion was performed on separase bands in the presence of the AQUA internal standard peptides (200 fmol). Because the peptides of interest each contained a methionine residue, methionines were chemically oxidized before analysis. Because of the limited complexity of the affinity-purified separase digest, selection-ion monitoring experiments were performed in which the intensity of the peptide ions themselves rather than the intensity of fragment ions was measured. Both the phosphorylated and nonphosphorylated peptides were quantified in triplicate. Protein kinase A and calmodulin-dependent kinase II were found to phosphorylate Ser-1501 over basal levels. Importantly, other kinases investigated that did not efficiently phosphorylate Ser-1501 (including polo kinase and aurora kinase A) were capable of phosphorylating separase at other residues when incubated with [32]ATP and visualized by autoradiography (data not shown). Phosphorylation at Ser-1501, however, was distinguished from all other phosphorylation by the AQUA strategy.
Fig. 6.
AQUA methodology for determining site-specific, kinase-dependent protein phosphorylation in vitro. Application to separase Ser-1501 affinity-purified separase, ATP, and a normalized quantity of each kinase were incubated for a defined interval. Reactions were purified by gel electrophoresis and quantified by in-gel trypsin digestion in the presence of 200 fmol of each synthetic internal standard peptides LTDNWRKMSFEIL*R and LTDNWRKM(pS)FEIL*R. (A) LC–SRM trace for phosphorylated and nonphosphorylated separase Ser-1501 after treatment with a mutant (inactive) PKA. The basal level of phosphorylation was determined to be 16%. (B) LC–SRM trace for phosphorylated and nonphosphorylated separase Ser-1501 after treatment with active PKA. The percent of phosphorylation was determined to be 98%. (C) Percent of phosphorylation for separase Ser-1501 after treatment with a bank of kinases. Data shown are the result of triplicate analyses with ranges in standard deviation from 0.5% to 9.1% with a median value of 3.6%. Both calmodulin-dependent kinase II (CaMKII) and PKA successfully phosphorylated Ser-1501 in vitro.
We anticipate that this methodology will assist the study of systems biology in diverse ways. Lead targets from cDNA microarrays studies could be quickly evaluated for protein expression changes without the need of producing antibodies. Dynamic changes in protein expression levels measured over multiple time points could provide important clues to highly regulated and critically timed cellular events. These events could be further characterized by following multiple, posttranslationally modified proteins involved in a pathway simultaneously.
Supplementary Material
Acknowledgments
We sincerely thank J. Knott and J. Reynolds for peptide synthesis and analysis and M. Comb and Cell Signaling Technology for donating peptides for this study. We also thank D. Moazed for yeast lysates. We are grateful to I. Jardine (ThermoFinnigan) for the use of the ion trap and triple quadrupole mass spectrometers. We thank E. A. Nigg and D. Grieco for the generous gift of polo and CDK2/cyclinE. We also thank past and present members of the Gygi and Kirschner laboratories for useful discussions. This work was supported by a sponsored research project from ThermoFinnigan and by grants from the National Institutes of Health (HG00041 to S.P.G.), the Giovani-Armenise Harvard Foundation (to S.P.G.), and the Human Frontier Long Term Fellowship (to O.S.).
Abbreviations: MS/MS, tandem MS; LC, liquid chromatography; SRM, selected-reaction monitoring; SIR, silent information regulatory; AQUA, absolute quantification.
References
- 1.O'Farrell, P. H. (1975) J. Biol. Chem. 250, 4007–4021. [PMC free article] [PubMed] [Google Scholar]
- 2.Gygi, S. P., Corthals, G. L., Zhang, Y., Rochon, Y. & Aebersold, R. (2000) Proc. Natl. Acad. Sci. USA 97, 9390–9395. [DOI] [PMC free article] [PubMed] [Google Scholar]
- 3.Gygi, S. P., Rochon, Y., Franza, B. R. & Aebersold, R. (1999) Mol. Cell. Biol. 19, 1720–1730. [DOI] [PMC free article] [PubMed] [Google Scholar]
- 4.Mawuenyega, K. G., Kaji, H., Yamauchi, Y., Shinkawa, T., Saito, H., Taoka, M., Takahashi, N. & Isobe, T. (2003) J. Proteome Res. 2, 23–35. [DOI] [PubMed] [Google Scholar]
- 5.Florens, L., Washburn, M. P., Raine, J. D., Anthony, R. M., Grainger, M., Haynes, J. D., Moch, J. K., Muster, N., Sacci, J. B., Tabb, D. L., et al. (2002) Nature 419, 520–526. [DOI] [PubMed] [Google Scholar]
- 6.Lasonder, E., Ishihama, Y., Andersen, J. S., Vermunt, A. M., Pain, A., Sauerwein, R. W., Eling, W. M., Hall, N., Waters, A. P., Stunnenberg, H. G. & Mann, M. (2002) Nature 419, 537–542. [DOI] [PubMed] [Google Scholar]
- 7.Peng, J., Elias, J. E., Thoreen, C. C., Licklider, L. L. & Gygi, S. P. (2003) J. Proteome Res. 2, 43–50. [DOI] [PubMed] [Google Scholar]
- 8.Washburn, M. P., Wolters, D. & Yates, J. R., 3rd (2001) Nat. Biotechnol. 19, 242–247. [DOI] [PubMed] [Google Scholar]
- 9.Oda, Y., Huang, K., Cross, F. R., Cowburn, D. & Chait, B. T. (1999) Proc. Natl. Acad. Sci. USA 96, 6591–6596. [DOI] [PMC free article] [PubMed] [Google Scholar]
- 10.Gygi, S. P., Rist, B., Gerber, S. A., Turecek, F., Gelb, M. H. & Aebersold, R. (1999) Nat. Biotechnol. 17, 994–999. [DOI] [PubMed] [Google Scholar]
- 11.Wang, S. & Regnier, F. E. (2001) J. Chromatogr. A 924, 345–357. [DOI] [PubMed] [Google Scholar]
- 12.Barr, J. R., Maggio, V. L., Patterson, D. G., Jr., Cooper, G. R., Henderson, L. O., Turner, W. E., Smith, S. J., Hannon, W. H., Needham, L. L. & Sampson, E. J. (1996) Clin. Chem. 42, 1676–1682. [PubMed] [Google Scholar]
- 13.Barnidge, D. R., Dratz, E. A., Martin, T., Bonilla, L. E., Moran, L. B. & Lindall, A. (2003) Anal. Chem. 75, 445–451. [DOI] [PubMed] [Google Scholar]
- 14.Shevchenko, A., Wilm, M., Vorm, O. & Mann, M. (1996) Anal. Chem. 68, 850–858. [DOI] [PubMed] [Google Scholar]
- 15.Stemmann, O., Zou, H., Gerber, S. A., Gygi, S. P. & Kirschner, M. W. (2001) Cell 107, 715–726. [DOI] [PubMed] [Google Scholar]
Associated Data
This section collects any data citations, data availability statements, or supplementary materials included in this article.


