Abstract
Fossil leaves assigned to the genus Ginkgo are increasingly being used to reconstruct Mesozoic and Tertiary environments based on their stomatal and carbon isotopic characteristics. We sought to provide a more secure basis for understanding variations seen in the plant fossil record by determining the natural variability of these properties of sun and shade leaf morphotypes of Ginkgo biloba trees under the present atmospheric CO2 concentration and a range of contemporary climates in three Chinese locations (Lanzhou, Beijing, and Nanjing). Climate had no major effects on leaf stomatal index (proportion of leaf surface cells that are stomata) but did result in more variable stomatal densities. The effects of climate and leaf morphotype on stomatal index were rather conserved (<1%) and much less than the response of trees to recent CO2 increases. Leaf carbon isotope discrimination (Δ) was highest for trees in Nanjing, which experience a warm, moist climate, whereas trees in the most arid site (Lanzhou) had the lowest Δ values. Interestingly, the variation in Δ shown by leaf populations of trees from China and the United Kingdom was very similar to that of fossil Ginkgo cuticles dating to the Mesozoic and Tertiary, which suggests to us that the physiology of leaf carbon uptake and regulation of water loss in Ginkgo has remained highly conserved despite the potential for evolutionary change over millions of years.
Fossil leaves are increasingly being used as bioindicators of ancient levels of the greenhouse gas CO2 (1, 2) because of the negative relationship between atmospheric CO2 concentration and stomatal development shown by the leaves of contemporary vascular land plants (3). However, because the stomatal responses of leaves to CO2 are species-specific, there is a need in such studies to calibrate the responses of fossil leaves against data from studies on cogeneric taxa (1, 4, 5). Particularly useful in this context are so-called living-fossil taxa such as Ginkgo biloba and Metasequoia glyptostroboides, which have long fossil records and close living representatives amenable to controlled environment experiments.
G. biloba is widely planted as an ornamental tree in many temperate areas of the world (6). Several extinct species and genera are known from the Triassic, Jurassic, Cretaceous, and Paleocene. CO2-enrichment experiments have shown that the stomatal characters of living G. biloba leaves are sensitive to changes in CO2 concentration (7, 8). As a consequence, fossil leaves of Gingko have been used to reconstruct paleo-CO2 levels in the Tertiary (5) and further back in time in the Mesozoic (2, 9–11).
However, if we are to interpret more securely past changes in the environment from measurements of the stomatal characters of fossil leaves, then it is essential to quantify the natural variability of trees of the same or at least closely related taxa as those being examined in the fossil record. Toward this aim, Chen et al. (10) assessed five kinds of natural variation for stomatal density (SD, number of stomata per unit area of leaf) and stomatal index (SI, proportion of leaf surface cells that are stomata) of extant G. biloba leaves including the timing of leaf maturation, young versus mature leaves, short shoots versus long shoots, position in the canopy, and male versus female trees. Encouragingly, in most cases the variation was small relative to the magnitude of the shifts seen in the Mesozoic fossil record.
However, variations in the stomatal characters of the leaves of G. biloba in relation to their developmental position in the canopy and for trees growing in different climates have not yet been examined; both factors might potentially be important biases in the fossil record. For example, plant physiologists have know for decades that leaves developing in full sun around the outer edges of the crown tend to possess higher SDs than those developing within the canopy (12). Associated with changes in developmental microclimate are differences in the physiology of sun and shade leaves, with sun leaves typically having higher photosynthetic capacities (12, 13). The physiological differences between sun and shade leaves are often expressed as differences in their stable carbon isotope composition (14). Because the carbon isotope composition of fossil plants are measured regularly to obtain information about past climates and the global carbon cycle (2), it is also important to characterize possible differences in sun and shade leaf isotope ratios that might bias interpretation of these geochemical records.
Our study was intended to establish a more secure basis for interpreting paleoenvironmental conditions from fossil Ginkgo leaves. To achieve this aim, we report results of an investigation assessing the variation in SD and SI of sun and shade leaves of G. biloba trees growing across a wide natural climatic gradient (Table 1) in China. Further, we assessed the effects of leaf morphotype across the climatic gradient on the physiological processes of G. biloba leaves through analysis of their stable carbon isotope composition (15, 16). The results provide an estimate of natural variations under a modern atmospheric CO2 concentration and a range of contemporary climates for comparison with published isotopic composition of Ginkgo leaves in the Mesozoic (7, 17) and Tertiary (2, 5) ages.
Table 1. Climate of the three Chinese localities.
| Mean annual temperature, °C
|
Mean annual relative humidity, %
|
Total annual precipitation, mm·yr-1
|
Annual potential evaporation, mm·yr-1
|
|||||||
|---|---|---|---|---|---|---|---|---|---|---|
| Locality | Latitude | Longitude | Long-term | 1999 | Long-term | 1999 | Long-term | 1999 | Long-term | 1999 |
| Lanzhou | 36°01′N | 103°59′E | 9.5 (21) | 11.1 | 58 | 49 | 338 (21) | 319 | 655 (?) | 1,586 |
| Beijing | 39°57′N | 116°19′E | 11.8 (36) | 13.1 | 57 | 53 | 619 (112) | 380 | 799 (95) | 1,785 |
| Nanjing | 32°04′N | 118°47′E | 15.7 (16) | 15.7 | 73 | 76 | 979 (25) | 1,231 | 864 (32) | 1,395 |
Materials and Methods
Leaf Materials. Leaves of G. biloba were sampled in August, 1999 from mature specimens of three trees growing in open areas on the campus of Lanzhou University in Lanzhou, China (1,508 m above sea level), two trees at China University of Geosciences in Beijing (52 m above sea level), and two trees at the Nanjing Institute of Geology and Paleontology in Nanjing, China (62 m above sea level). Geoposition and climate data are provided in Table 1. Twenty sun and 20 shade leaves were sampled, 5 each from the north, east, south, and west sides of the trees. Sun leaves were sampled from the outermost lowest branches ≈2 m above the ground. Shade leaves were sampled from the lowest available branches near the interior of the canopy as close to the trunk as possible. The leaves from each sample point were divided into halves; one was used for stable carbon isotope analyses, and the other was used for stomatal analyses.
Stomatal Measurements. SD is expressed as SD per mm2, epidermal density is expressed as epidermal density per mm2, and SI is expressed as SD/[(epidermal density + SD) × 100] (18). The values reported here are averages of five counts each from 20 leaves for each tree at a particular locality. Counts of stomatal and epidermal cells were made on acetate impressions of the abaxial (lower) surface of mature leaves by using a Leitz Laborlux 12 Pol microscope linked to a computer with image-analysis software. We measured the middle part of the leaf, because SD and SI show less variability there than at the leaf base and apex.
Stable Carbon Isotope Analyses. For carbon isotope analyses, the leaf samples of G. biloba were dried in an oven at 60°C for 18 h and then ground to a homogeneous fine powder. The ground samples were dried again (50°C for 8 h) and passed through a sieve. The ground-leaf sample was oxidized in an oxygen flux at 800°C, and then we extracted CO2 from each sample. Carbon isotopic composition of CO2 was measured (19) by a MAT-252 mass spectrometer. The results are expressed as δ13C (‰) = (13Rsample/13Rstandard - 1) × 1,000, where R represents the 13C/12C ratio of the plant sample and the standard (PDB, belemnite from the Pee Dee Formation). The error is less than ±0.1‰. CO2 in the atmosphere was measured by a MAT-271 mass spectrometer directly by injecting an air sample into the mass spectrometer and then measuring the contents of all components.
Leaf carbon isotope discrimination (Δ13C) was calculated as (δ13Cair - δ13Cplant)/(1 + δ13Cplant/1,000), with a modern value of δ13Cair - 8.8‰ (http://cdiac.esd.ornl.gov/). From Δ13C values, we calculated the leaf intercellular CO2 concentrations (pi) by rearrangement of the well validated model (20) linking Δ13C to leaf gas exchange by a + (b - a)(pi/pa), where a and b are the isotopic discriminations associated with diffusion through air (4.4‰) and carboxylation by Rubisco (27‰), respectively, and pa is CO2 concentration of ambient atmosphere. We used the 1998 global atmospheric CO2 concentration (366 ppm by volume) for the value of pa as reported from measurements at Mauna Loa, Hawaii (http://cdiac.esd.ornl.gov/). An adequate, relative measure of leaf instantaneous water-use efficiency (WUE) can be calculated (16) as WUE = photosynthetic CO2 draw-down/stomatal conductance = pa(1 - pi/pa)/1.6Δw, where Δw is the water vapor pressure deficit (μmol/mol).
Results and Discussion
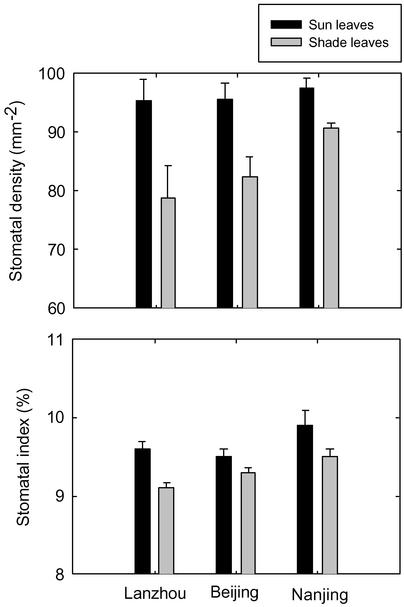
Stomatal Variations. Our measurements confirm that for G. biloba, as with other summer deciduous tree species (12, 14, 21–23), sun leaves possess a higher SD than shade leaves irrespective of the climatic regions from which the trees originated (Fig. 1). When SI is calculated for sun and shade leaves of G. biloba, however, the values are quite similar (Fig. 1). A similar phenomenon has been reported from studies on Alnus glutinosa (22), Fagus sylvatica (14), and Quercus spp. (23) leaves. Together with the present results, this study emphasizes the need to measure SI on fossil leaves to minimize this source of variation.
Fig. 1.
SDs (mean ± SE) and SIs (mean ± SE) of sun and shade leaves of G. biloba collected in three localities, each with a different prevailing climate.
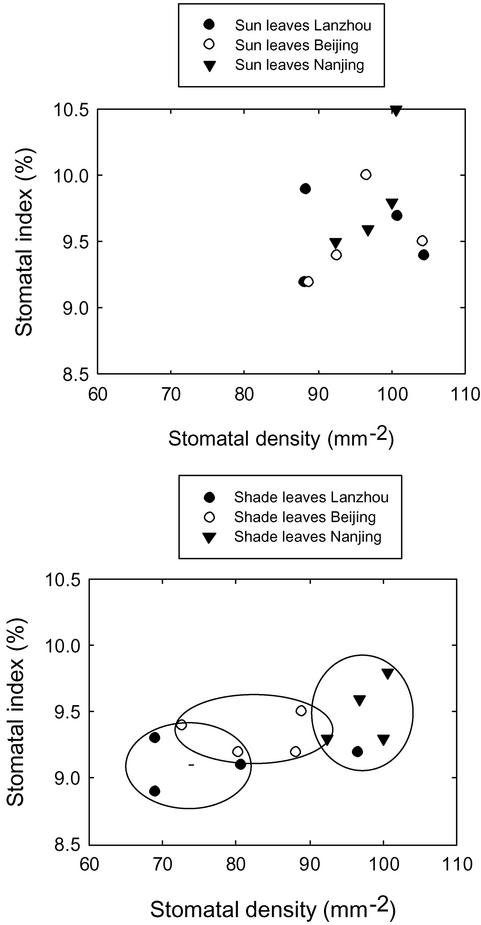
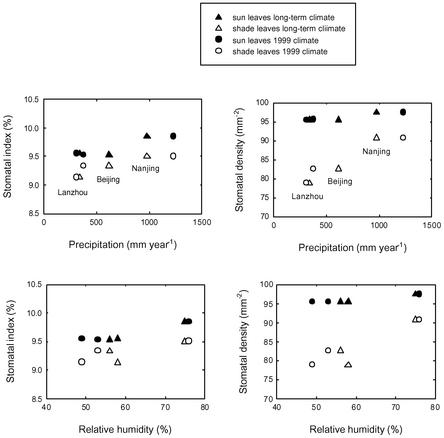
Sun leaves from all three sites (Lanzhou, Beijing, and Nanjing) show a similar range of SD and SI values, whereas shade leaves show a greater variability and trend across climates (Fig. 1). Cross plots between the SD and SI of leaves from each site reveal that the shade leaves fall out into three distinct clusters, each representing a different site (Fig. 2). These data suggest that the stomatal characteristics of shade leaves are more sensitive to climate variations at the time of either bud set (cellular differentiation) or bud burst (leaf expansion) than sun leaves. There could be a greater variability in SD for leaf expansion relative to cellular differentiation in response to climate. To investigate this possibility further, we examined the relationship between SD and SI of sun and shade leaves in relation to the mean longer-term climate to which the trees were acclimated and to the climate for the year of collection (1999) (Table 1). It emerges that leaf SI is remarkably stable with respect to climate, varying by <1% in absolute value (10% in relative value) in trees experiencing wide variations in annual precipitation and relative humidity (Fig. 3). One possible driving factor for differences in shade leaves among the three climates is relative humidity on vapor pressure deficit of the air during midday, whereas the shade leaves are expanding.
Fig. 2.
Cross plots of SD and SI of sun (Upper) and shade (Lower) G. biloba leaves collected from three localities in China. For each locality, the mean SD and SI of leaves collected from east-, west-, south-, and north-facing parts of the tree crown are shown.
Fig. 3.
Mean SD and SI of sun and shade leaves relative to the long-term mean climate the trees experience and to the climate of the year of collection.
SD, however, is much more variable, with the SD of shade leaves being more sensitive than sun leaves (Fig. 2). Shade leaves with the lowest SDs in our study came from trees growing at the two sites with the greatest precipitation minus potential evaporation (Ep) deficits [(P - Ep = -317 mm·yr-1 (Lanzhou) and -180 mm·yr-1 (Beijing)]. The development of leaves with fewer stomata on trees growing in the drier climate may therefore be an adaptive response to conserve water. It is interesting to note that shade leaves of trees in Nanjing, where P - Ep = -115 mm·yr-1, have SDs approaching those of sun leaves on trees from the two drier sites (Fig. 3). Humidity is partially correlated with precipitation, and leaf stomatal properties show similar patterns to differences in humidity between sampling localities (Fig. 3).
The small variation in SI of modern G. biloba trees growing in different climatic regimes (<1%) (Fig. 2) is much less than the 5% reduction in SI shown by G. biloba over the past two centuries of global atmospheric CO2 increase (5). Nevertheless, small differences in SI between sun and shade leaves suggest that, in fossil-leaf assemblages containing a mixture of morphotypes, a bias could be introduced into CO2 reconstructions with fossil Ginkgo leaves. We assessed the magnitude of this effect by inverse regression of a published SI-CO2 calibration function for G. biloba (5). For the range of SI values reported for Tertiary Ginkgo adiantoides fossil leaves (7.6–11.9%) (5), the sun-versus-shade bias of 1% might introduce an error of between 2% and 15%.
Our results, together with those of an earlier study (10) quantifying variations in a host of biological factors, suggest that natural variations in leaf SI due to differences in climatic conditions between the past and present are unlikely to obscure the interpretation of CO2-related patterns measured on sequences of fossil Ginkgo leaves.
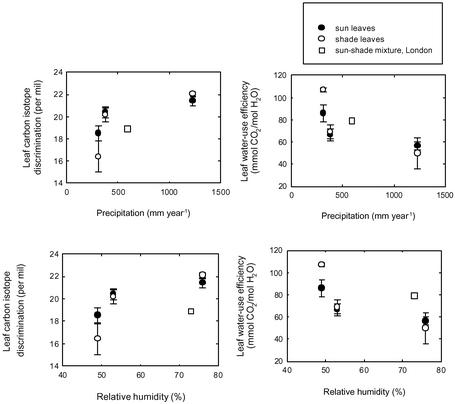
Carbon Isotope Responses. Carbon isotope discrimination (Δ13C) varied between 18.5‰ and 21.4‰ for sun leaves (Table 2 and Fig. 4), implying an operational range of intracellular CO2 concentrations (pi) of 47 ppm by volume. For shade leaves, Δ13C varied between 16.4‰ and 22.0‰, which corresponds to a wider range in pi of 90 ppm by volume (Table 2 and Fig. 4). The majority of the variation is driven by climatic differences between the sites, because sun and shade leaves on trees at any given site have quite comparable Δ13C values (Table 2). Small differences in Δ13C between sun and shade leaves are similar to those reported for A. glutinosa (14) but differ from the pattern observed through the canopy of the evergreen Nothofagus solandri var. cliffortiodes growing in New Zealand (24). However, the differences are probably explained because N. solandri var. cliffortiodes has a dense, more compact canopy, which attenuates light penetration to a greater extent than that of G. biloba.
Table 2. Mean (±SE), stable carbon isotope composition (‰), and isotopic discrimination (Δ) of leaves (n = 5 per aspect) of trees from three Chinese localities.
| Leaf morphotype
|
||||||||||||
|---|---|---|---|---|---|---|---|---|---|---|---|---|
| Sun
|
Shade
|
|||||||||||
| Locality | Aspect North | South | East | West | Mean | Mean Δ | Aspect North | South | East | West | Mean | Mean Δ |
| Lanzhou | -24.8±0.1 | -26.4±0.2 | -28.4±0.2 | -26.7±0.1 | -26.6±0.2 | 18.5±0.2 | -20.6±0.1 | -25.3±0.1 | -27.1±0.1 | -25.3±0.1 | -24.6±0.1 | 16.4±0.1 |
| Beijing | -29.1±0.3 | -27.3±0.1 | -29.3±0.1 | -27.1±0.3 | -28.4±0.2 | 20.4±0.2 | -29.0±0.2 | -27.2±0.2 | -29.3±0.1 | -27.1±0.1 | -28.2±0.2 | 20.1±0.2 |
| Nanjing | -29.3±0.2 | -28.5±0.1 | -29.3±0.1 | -30.2±0.1 | -29.3±0.1 | 21.4±0.1 | -29.6±0.1 | -29.8±0.1 | -30.0±0.1 | -30.4±0.1 | -29.9±0.1 | 22.0±0.1 |
See Materials and Methods for calculation details
Fig. 4.
Differences in mean (±SE) carbon isotope discrimination (Δ) and WUE of sun and shade leaves of G. biloba from each site in relation to the climate of the particular site. Also displayed are the Δ and WUE values of G. biloba trees in London (7, 17).
The environmental conditions prevailing during the period of active growth therefore seem to have an important bearing on the pi/pa ratio of G. biloba leaves, as expected from theory (15). This ratio is governed by the balance between the demand for CO2, set by the photosynthetic capacity, and stomatal conductance, which regulates its supply (15). We might expect that trees in locations with plentiful precipitation, and a lower evaporative demand, will tend to be more wasteful in water use than those adapted to more arid conditions. Our measurements of Δ13C indicate just such a pattern. Trees occupying a progressively wetter, more humid locality (Nanjing) had the highest Δ13C values (Fig. 4), implying higher stomatal conductance to water vapor and greater water loss during periods of carbon gain by photosynthesis. Conversely, trees at the most arid site, Lanzhou, have the highest WUE of all those examined in this study (Fig. 4). The isotopic data therefore provide independent support for the idea that the low SD of trees in Lanzhou provides one mean for them to conserve water loss. Other workers have also noted the tendency for the WUE of conifer needles (25), and leaves of herbs (26), to track changes in stomatal numbers. One factor that needs to be examined further is on site CO2 concentrations for the three sites, in contrast to using mean global CO2 concentrations from Mauna Loa, Hawaii. Ambient CO2 concentrations in urbanized areas are higher than Mauna Loa values (27), thus the pa value will be slightly larger.
A general pattern to emerge from our study of G. biloba is the increase in Δ13C with increased rainfall; a similar pattern is seen if the data are plotted against precipitation seasonality for each locality (defined as the highest monthly precipitation minus the low monthly precipitation/the total rainfall) (data not shown). If Δ13C values of G. biloba trees from near London are included in the analyses (7, 17), they too conform to this trend (Fig. 4). Similar results have been reported for Eucalyptus taxa from different climate and habitats but that were grown under a common environment (28). Because the Eucalyptus originated from different locations and grew under a common climate, differences in Δ13C were attributable to genotypic adaptations to their native habitats (28). Without performing a similar experiment with G. biloba, we are unable, however, to assert that the between-site differences observed here (Fig. 4) are due to genotypic effects or climatic effects on physiological processes.
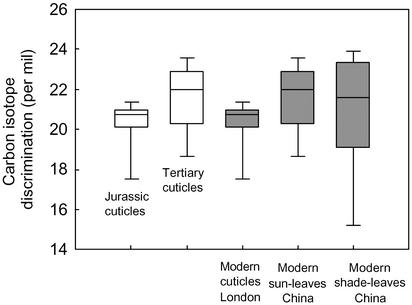
From a paleoecophysiological perspective, it is of interest to compare the natural variation in Δ13C seen in populations of G. biloba trees from localities across China and in London with that seen in fossil leaves of Ginkgo. Two sets of isotopic measurements on fossil cuticles are available for comparison: Jurassic Ginkgo huttonii (17) and Tertiary G. adiantoides (2, 5). To enable direct comparisons between Δ13C values from Chinese trees and the fossils, the modern values have been corrected by 1.5 per ml to account for the known isotopic difference between whole leaves and cuticles (29). The comparison reveals that both modern and ancient Ginkgo trees operated with remarkably similar median and range of Δ13C values (20–21‰). The values imply that (i) the diffusional limitation on leaf gas exchange in Gingko has apparently varied rather little over the past 200 million years or so, and (ii) their physiology, similar to their leaf morphology (6), has been highly been conserved (Fig. 5).
Fig. 5.
Box-plot comparisons of the carbon isotope discrimination (Δ) of cuticles of fossil (□) and modern (▪) Ginkgo leaf cuticles. Each box delineates the 25th and 75th percentiles, error bars show the 5th and 95th percentiles, and the horizontal line represents the median value of each data set. Data sources: Jurassic (3 cuticles), refs. 7 and 17; Tertiary (10 cuticles), refs. 2 and 5; modern cuticles of London trees (15 cuticles), ref. 7. The Chinese data are from the present study (Table 2) but were corrected by 1.5‰ to account for the offset between cuticle and whole leaves (30).
Acknowledgments
We thank L. H. Allen, Jr., W. M. Kürschner, and T. A. Lott for helpful comments on this paper. This work was supported by the National Natural Science Foundation of China Grant 49972013, Foundation for University Key Teacher by the Ministry of Education of China and Foundation of the State Key Laboratory of Organic Geochemistry, Guangzhou Institute of Geochemistry, Chinese Academy of Sciences Grant OGL-9907, National Science Foundation Grant EAR 9905668 (to D.L.D.), and the Florida Museum of Natural History. D.J.B. gratefully acknowledges funding through a Royal Society University Research fellowship and the Leverhulme Trust. This article is University of Florida Contribution to Paleobiology publication no. 549.
Abbreviations: SD, stomatal density; SI, stomatal index; WUE, water-use efficiency.
References
- 1.Kürschner, W. M., Wagner, F., Dilcher, D. L. & Visscher, H. (2001) in Geological Perspectives of Global Climate Change, American Association of Petroleum Geologist Studies in Geology No. 47, eds. Gerhard, C., Harrison, W. E. & Hanson, B. M. (American Association of Petroleum Geologist and Kansas Geological Society, Tulsa, OK), pp. 169-189.
- 2.Beerling, D. J. & Royer, D. L. (2002) Annu. Rev. Earth Planet Sci. 30, 527-556. [Google Scholar]
- 3.Woodward, F. I. (1987) Nature 327, 617-618. [Google Scholar]
- 4.Van der Burgh, J., Visscher, H., Dilcher, D. L. & Kürschner, W. M. (1993) Science 260, 1788-1790. [DOI] [PubMed] [Google Scholar]
- 5.Royer, D. L., Wing, S. C., Beerling, D. J., Jolley, D. W., Koch, P. K., Hickey, L. J. & Berner, R. A. (2001) Science 292, 2310-2313. [DOI] [PubMed] [Google Scholar]
- 6.Tralau, H. (1968) Lethaia 1, 63-101. [Google Scholar]
- 7.Beerling, D. J., McElwain, J. C. & Osborne C. P. (1998) J. Exp. Bot. 49, 1603-1607. [Google Scholar]
- 8.Beerling, D. J. & Royer, D. L. (2002) New Phytol. 153, 387-397. [DOI] [PubMed] [Google Scholar]
- 9.McElwain, J. C., Beerling, D. J. & Woodward, F. I. (1999) Science 285, 1386-1390. [DOI] [PubMed] [Google Scholar]
- 10.Chen, L. Q., Li, C. S., Chaloner, W. G., Beerling, D. J., Sun, Q. G., Collinson, M. E. & Mitchell, P. L. (2001) Am. J. Bot. 88, 1309-1315. [PubMed] [Google Scholar]
- 11.Retallack, G. J. (2001) Nature 411, 287-290. [DOI] [PubMed] [Google Scholar]
- 12.Boardman, N. K. (1977) Annu. Rev. Plant Physiol. 28, 355-377. [Google Scholar]
- 13.Björkman, O. (1981) in Physiological Plant Ecology I: Responses to the Physical Environment, eds. Lange, O. L., Nobel, P. S., Osmond, C. B. & Ziegler, H. (Springer, Berlin), pp. 57-107.
- 14.Lockheart, M. J., Poole, I., Van Bergen, P. F. & Evershed, R. P. (1998) Org. Geochem. 29, 1003-1008. [Google Scholar]
- 15.Farquhar, G. D., Ehleringer, J. R. & Hubrick, K. T. (1989) Annu. Rev. Plant Physiol. Plant Mol. Biol. 40, 363-392. [Google Scholar]
- 16.Farquhar, G. D. & Richards, R. A. (1984) Aust. J. Plant Physiol. 11, 539-552. [Google Scholar]
- 17.McElwain, J. C. (1997) Ph.D. thesis (University of London, Egham, U.K.).
- 18.Salisbury, E. J. (1927) Philos. Trans. R. Soc. London B 216, 1-65. [Google Scholar]
- 19.Mook, W. G. & Grootes, P. M. (1973) Int. J. Mass Spectrom. Ion Phys. 12, 273-298. [Google Scholar]
- 20.Farquhar, G. D., O'Leary, M. H. & Berry, J. A. (1982) Aust. J. Plant Physiol. 9, 121-137. [Google Scholar]
- 21.Osborn, J. M. & Taylor, T. N. (1990) Bot. Gaz. 151, 465-476. [Google Scholar]
- 22.Poole, I., Weyers, J. D. B., Lawson, T. & Raven, J. A. (1996) Plant Cell Environ. 19, 705-712. [Google Scholar]
- 23.Kürschner, W. M. (1997) Rev. Palaeobot. Palynol. 96, 1-30. [Google Scholar]
- 24.Turney, C. S. M., Hunt, J. E. & Burrows, C. (2002) New Phytol. 155, 301-311. [Google Scholar]
- 25.Beerling, D. J. (1998) Acta Oecol. 18, 697-712. [Google Scholar]
- 26.Griffiths, H. (1996) in Photosynthesis and the Environment, ed. Baker, N. R. (Kluwer, Dordrecht, The Netherlands), pp. 451-468.
- 27.Ziska, L. H., Ghannoum, O., Baker, J. T., Conroy, J., Bunce, J. A., Kobayashi, K. & Okada, M. (2001) Global Change Biol. 7, 789-796. [Google Scholar]
- 28.Anderson, J. E., Williams, J., Kriedemann, P. E., Austin, M. P. & Farquhar, G. D. (1996) Aust. J. Plant Physiol. 23, 311-320. [Google Scholar]
- 29.Benner, R., Fogel, M. L., Sprague, E. K. & Hodson, R. E. (1987) Nature 329, 708-709. [Google Scholar]
- 30.Müller, M. J. (1982) Selected Climatic Data for a Global Set of Standard Stations for Vegetation Science (Dr. Junk Publishers, Boston).
- 31.State Statistical Bureau of People's Republic of China (2000) China Statistical Yearbook 2000, No. 19 (China Statistics Press, Beijing), pp. 9-11.
- 32.National Meteorological Center of China (2000) Monthly Surface Meteorological Data of China (China Statistics Press, Beijing), pp. 1, 66, and 158.


