

Abstract
The efficiency of single-nucleotide polymorphism haplotype analysis may be increased by DNA pooling, which can dramatically reduce the number of genotyping assays. We develop a method for obtaining maximum likelihood estimates of haplotype frequencies for different pool sizes, assess the accuracy of these estimates, and show that pooling DNA samples is efficient in estimating haplotype frequencies. Although pooling K individuals increases ambiguities, at least for small pool size K and small numbers of loci, the uncertainty of estimation increases <K times that of unpooled DNA. We also develop the asymptotic variance-covariance of maximum likelihood estimates and evaluate the accuracy of variance estimates by Monte Carlo methods. When the sample size of pools is moderately large, the asymptotic variance estimates are rather accurate. Completely or partially missing genotyping information is allowed for in our analysis. Finally, our methods are applied to single-nucleotide polymorphisms in the angiotensinogen gene.
Keywords: pooling, EM algorithm
Linkage disequilibrium (LD) between disease susceptibility loci and single-nucleotide polymorphisms (SNPs) plays a crucial role in the genetic mapping of complex traits. It serves as the basis for inference on human history, mutation detection, and disease-genotype association studies. For closely spaced SNPs, establishing haplotypes can distinguish between cis- and trans-acting disease susceptibility alleles at different sites, and differences in haplotype frequencies between affected and unaffected individuals are at the core of case-control association studies.
In this paper, we study the problem of estimating SNP haplotype frequencies from pooled DNA samples. We compute maximum likelihood estimates by using the EM algorithm. The large-sample variance–covariance matrices of the estimates are also explicitly derived. Their accuracy and the efficiencies of the maximum likelihood estimates from pooled DNA sample are investigated by computer simulation. We finally apply the methods to SNPs in the angiotensinogen gene (AGT).
Clark (1) proposed a sequential inference method for estimation and reconstruction of haplotypes from unphased genotype data. Maximum likelihood inference based on the EM algorithm for haplotype frequencies was investigated by several authors∥ (3–5). Fallin and Schork (6) evaluated the accuracy of haplotype frequency estimation from EM algorithm. These studies are all based on individual DNA samples.
In most cases, genotyping is costly, and pooling individual samples has been advocated to reduce the genotyping cost (7–9). Sham et al. (10) reviewed the efficiency of DNA pooling in large-scale association studies. For the problem of estimating allele frequencies of SNPs from pooled DNA samples (11–14), it was shown that pooling DNA samples is efficient in estimating allele frequencies (11). For haplotype inference, unlike single allele association analysis, pooling may complicate the configuration of haplotypes and therefore add more ambiguities in estimating haplotype frequencies. Pfeiffer et al. (15) investigated the efficiency of DNA pooling for jointly estimating allele frequencies and LD coefficient. For two SNPs and two or three individuals per pool, Wang et al. (16) examined the cost effectiveness of DNA pooling. Ito et al. (17) investigated the estimation of haplotype frequencies and LD coefficients from pooled DNA data. Here, we present a very general approach and investigate pooling efficiency for multiple SNPs and multiple individuals per pool. Our algorithm provides the asymptotic variance estimates of the haplotype frequency estimates and methods of handling different types of missing information.
Methods
Suppose K ≥ 1 DNA samples from unrelated individuals are pooled, where K = 1 corresponds to sampling without pooling. In each pool, there are 2K possible haplotypes, which are generally unobservable. Denote the two alleles at a specific locus by 0 and 1. Then a haplotype is a vector of 0s and 1s. We denote all haplotypes at the m loci by H1 = (0, 0,..., 0), H2 = (1, 0, 0,..., 0),..., H2m = (1, 1, 1,..., 1). For example, in the two-locus case, there are four different haplotypes: H1 = (0, 0), H2 = (1, 0), H3 = (0, 1), H4 = (1, 1). Let hj = P(Hj) be the relative frequency of the jth haplotype, and let h = (h1, h2,..., h2m). Our objective is to estimate h from pooled DNA samples and assess the accuracy of the estimates.
Let Yil be the observed total number of allele 1 in pool i and locus l, which can be any integer value from 0 to 2K. Observation for pool i at all loci is a vector Yi = (Yi1, Yi2,..., Yim). Below, we will refer to Yi or any of its component as a pool genotype. Denote all possible haplotype configurations for a given Yi by
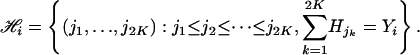 |
Each member, J = (j1,..., j2K), of  labels one possible 2K haplotype combination in the ith pool and is associated with a weight function wJ, which is the number of different ways of assigning these labels/haplotypes to the K individuals in the pool under the assumption of Hardy–Weinberg equilibrium and random mating. Specifically, if there are k distinct labels among j1, j2,..., j2K with counts c1,..., ck for these distinct haplotypes, then wJ = (2K)!/(c1!...ck!). Note that the weight function is only valid under the Hardy–Weinberg equilibrium and when all individuals are independent.
EM Algorithm. Suppose there are n K-pools of DNA samples. The likelihood function for the observed pool genotype data under the Hardy–Weinberg equilibrium is given by
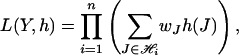 |
where 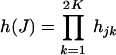 .
.
For pool i, let  be the (unobservable) indicator function of haplotype configuration J = (j1, j2,..., j2K). Then the likelihood function for the complete data is given by
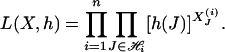 |
The E step in the EM algorithm boils down to calculating the conditional probability of a specific haplotype configuration given observed pool genotypes and known values of parameters h:
 |
Then the M step updates the frequency
 |
where cJ(k) is the number of haplotypes with label k in the collection J of haplotypes.
Variance Estimation. To evaluate the accuracy of the estimates, we need to compute variances of haplotype frequency estimates. The asymptotic variance–covariance matrix of the maximum likelihood estimates of haplotype frequencies is estimated by (details are in the Appendix)
 |
where W is a 2m × (2m - 1) matrix
 |
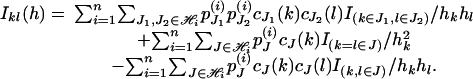
where I2m-1 is the identity matrix with dimension 2m - 1, and 1 is the vector of ones with length 2m - 1. The (k, l) element of IY(h) is given by
 |
For small numbers of pools or large numbers of loci, the asymptotic variance may not be a good approximation of the true variance. In these cases, the variance (or standard errors) can be obtained by standard bootstrapping methods. Briefly, for n pools of DNA samples, the bootstrapping procedure repeatedly resamples n pools from the original samples with replacement. For each such bootstrap sample, haplotype frequencies are estimated. Then variances of these haplotype frequency estimates are rather accurate approximations of the true variances when the number of bootstrap samples is sufficiently large, for example, exceed 500.
Efficiency. Pooling is expected to decrease the accuracy (i.e., increase the variance) of haplotype frequency estimates. Pooling is worthwhile only if accuracy does not suffer too much. Consider pools of size K (comprising K individuals) each and a number n of pools so that the total number of individuals is nK. Because pools require only a fraction 1/K of genotyping assays compared with individual genotyping, we define the relative efficiency of pooling vs. no pooling as R(K) = K × ν1/νK, where νK is the mean squared error (MSE, sum of variance and squared bias) for pool size K, and ν1 is the MSE when there is no pooling. Pooling is efficient if R(K) > 1.
Missing Data. In this paper, we assume two kinds of missing values in genotyping. One is completely missing, that is, no information is observed at some specific locus (loci). The other is partially missing. For example, because allele frequencies are obtained from fluorescence intensities in the genotyping assays, it can happen that one is sure only that a given allele is present in a pool, but the exact number of its copies is unclear. Our approach also handles this type of partially missing information.
With missing data, the algorithm is almost the same as that for nonmissing data, except that the haplotype configurations for each pool are possibly increased. For example, for K = 2, suppose the pool genotype at one specific locus l in pool i is completely missing, and there are no missing values at other loci, then at the missing locus, Yil can take any one of the values 0, 1, 2, 3, 4. Each of these possible values and pool genotypes at other loci produces a corresponding configuration  , k = 0, 1, 2, 3, 4, and the union of these
  constitutes the haplotype configuration
  for this pool. Partially missing values can be handled in analogy to that of a completely missing locus.
In many haplotype frequency estimation approaches, an individual observation is discarded entirely if a possibly small number of pool genotypes is missing. Our algorithm makes efficient use of the data by retaining all observations.
Simulation and Real Data. We carry out computer simulations to assess the accuracy of the asymptotic variance estimates and to compare the relative efficiency of haplotype estimates under different choices of pool sizes, allele frequencies, LD coefficients, and proportions of missing values. Most of the simulations in this study are done as follows. For given haplotype frequencies, we independently generate haplotypes. Pairs of haplotypes are randomly combined to form the genotypes for each individual. Then every K individual genotypes are randomly pooled to form pool genotypes.
To mimic the real situation, we implement pseudopooling simulation based on real data of individual genotypes. Treating the individual genotype data as a population, we repeatedly sample n individuals and randomly pool every K individuals together as pooled DNA data. The haplotype frequencies for the individual and pool genotypes are estimated by our approach, and the efficiency of pooling is then calculated.
Two real data sets are used in this study. One is individual AGT genotype data (18) used for the pseudopooling simulation; the other consists of pool-genotype data of two individuals for the AGT gene (data supplied by M.L. from an ongoing study). The individual DNA data consist of genotypes of 135 unrelated individuals (normal Caucasian) at three SNPs. There are no missing values in this data set. The pooled data are pool genotypes at 10 SNPs in the AGT gene. Each pool has two individuals, and all individuals are unrelated. There are 15 such pools, and therefore 30 individuals, but individual genotypes are not available. There are three (2%) completely missing values in this data set.
The accuracy of allele calling in DNA pools of two individuals is generally excellent. At the Centre National de Genotypage, analysis of pools of two DNAs is typically carried out by resequencing of the pooled DNA samples (19). When things work well (function of the DNA quality, sequence being analyzed), we can score the number of alleles in the pool. When things do not work so well, we score the presence of at least one variant allele or a homozygous pool.
Results
Variance Estimation. To evaluate the accuracy of the asymptotic variance estimates for small sample sizes, we carried out computer simulations to estimate the true variance of haplotype frequencies by using 1,000 random replicates for various LD coefficients D′ and fixed allele frequencies. For two SNP loci with alleles (A, a) and (B, b), we took the minor allele frequencies as pA = 0.5, pB = 0.4. Not unexpectedly, the results demonstrate that the total variance (sum of variances of all haplotype frequency estimates) increases with pool size, K, more so for low than for high values of D′. Estimated asymptotic variances are good approximations of true variances if the sample size of pools (n/K) is large enough. For example, if the two SNPs have minor allele frequencies of 0.4 and 0.5 and LD coefficients D′ = 0.25, when individual sample size is n = 120, the simulated total variances of the haplotype frequency estimates for pool sizes K = 1, 2, 3, 4 are, respectively, 0.0038, 0.0059, 0.0075, and 0.0105. The total estimated asymptotic variances are 0.0038, 0.0057, 0.0074, and 0.0096, respectively, which are close approximations of the simulated variances. When the sample size of individuals is 60, simulated variances are 0.0081, 0.0122, 0.0180, and 0.0228, respectively, and the estimated asymptotic variances are 0.0077, 0.0115, 0.0151, and 0.0175 respectively for K = 1, 2, 3, 4. Thus only the asymptotic variances for K = 1 (nonpooled case with sample size of n/K = 60 pools) and K = 2 (pooling two individuals with sample size of n/K = 30 pools) are good approximations of the simulated variances but not for the case of K ≥ 3 corresponding to pool sample sizes n/K ≤ 30.
For a number of pools n/K ≥ 30, asymptotic variances approximate true variances rather well, so that there is no need to use computer simulation to estimate variance. However, for consistency throughout this work, especially for small sample size cases, we estimated all variances via computer simulation for the analyses described below.
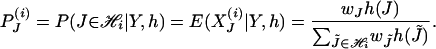
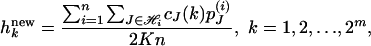
Relative Efficiency. For two SNP loci with varying degrees of linkage disequilibrium, numbers of K = 1–6 individuals per pool, and a total of n = 180 individuals randomly assigned to these pools, we carried out computer simulation as described in the previous section. We took the sample size of individuals n = 180, such that it can be divisible by K from 2 to 6, and the number of pools is not too small when K individuals are pooled together. The minor allele frequencies are taken to be pA = 0.5, pB = 0.4, or pA = 0.2, pB = 0.3 for the two loci. As the results show (Figs. 1 and 2), the relative efficiencies R(K) are always >1, and efficiency increases with pool size K. Efficiency is higher when the two loci are more strongly associated, but it increases more slowly as pool size becomes larger.
Fig. 1.

MSE (Left) and relative efficiencies (Right) of estimating two-locus haplotype frequencies from pools of K individuals, each relative to nonpooled DNA (K = 1) for different LD coefficients (total sample size is n = 180 individuals). Minor allele frequencies for the two loci are 0.4 and 0.5.
Fig. 2.

MSE (Left) and relative efficiencies (Right) of estimating two-locus haplotype frequencies form pools of K individuals, each relative to nonpooled DNA (K = 1) for different LD coefficients (total sample size is n = 180 individuals). Minor allele frequencies for the two loci are 0.2 and 0.3.
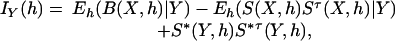
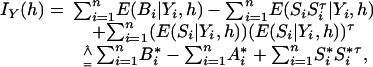
To determine pooling efficiency for three SNPs and to do this with realistic LD values, we implemented computer simulations based on estimated haplotype frequencies and pseudo-pooling experiments from the individual AGT genotype data at three SNPs. We estimated haplotype frequencies from a population sample of 135 normal Caucasians who were individually genotyped at three SNPs in the AGT gene (see also the description in Methods). The haplotype frequency estimates were 0, 0.0815, 0, 0, 0.5245, 0.2829, 0.0051, and 0.1060, and the pair-wise LD coefficients for the three SNPs were D′12 = 0.913, D′23 = 1, and D′13 = 1. We generated 2n (n = 60, 120, 180) three-SNP haplotypes according to the frequencies estimated from individual samples. Then the haplotypes are randomly combined to form n individual genotypes. These n genotypes are then randomly pooled into n/K pools, each of size K (K = 1, 2, 3, 4, 5, 6). This procedure was replicated 1,000 times for each of three different numbers of individuals, and results were averaged over the replicates. The relative efficiencies of pooling are illustrated in Fig. 3. On the other hand, we conducted pseudopooling experiments, as described in Methods, 2,000 times. We drew random samples of genotypes from this population and paired them to form pool genotypes for n = 60 individuals. These 60 individuals were then assigned to pools of different sizes, and the resulting pool phenotypes were analyzed by our approach (Fig. 4 and Table 1). As Figs. 3 and 4 show, for the three SNPs investigated, efficiency again increases with pool size, K. The increase is more pronounced for larger numbers of individuals. Efficiency appears to level off when pools contain four or more individuals.
Fig. 3.

Relative efficiencies for different numbers, n, of individuals in estimating the three-locus haplotype frequencies from pools of size K individuals each. The true haplotype frequencies are 0, 0.0815, 0, 0, 0.5245, 0.2829, 0.0051, and 0.1060.
Fig. 4.

Relative efficiencies of estimating three-locus haplotype frequencies from pseudopooling of K individuals, each relative to nonpooled DNA (K = 1); sample size is n = 60 individuals.
Table 1. Haplotype frequency estimates of the pseudopooling experiment based on Kumar data.
| SNPs
|
||||||||||
|---|---|---|---|---|---|---|---|---|---|---|
| Hap no. | 1 | 2 | 3 | h | K = 1 | K = 2 | K = 3 | K = 4 | K = 5 | K = 6 |
| 2 | 1 | 0 | 0 | 0.082 | 0.081 (0.017) | 0.079 (0.019) | 0.076 (0.021) | 0.073 (0.024) | 0.069 (0.028) | 0.067 (0.030) |
| 5 | 0 | 0 | 1 | 0.525 | 0.525 (0.029) | 0.526 (0.031) | 0.524 (0.033) | 0.520 (0.037) | 0.516 (0.042) | 0.513 (0.044) |
| 6 | 1 | 0 | 1 | 0.283 | 0.283 (0.027) | 0.285 (0.030) | 0.288 (0.034) | 0.294 (0.038) | 0.299 (0.043) | 0.303 (0.046) |
| 8 | 1 | 1 | 1 | 0.106 | 0.105 (0.026) | 0.104 (0.026) | 0.101 (0.030) | 0.097 (0.033) | 0.094 (0.036) | 0.092 (0.038) |
Standard deviations are in parentheses. Hap, haplotype
Missing Data. We evaluated the influence of missing data on haplotype estimation accuracy and on relative efficiencies. The rate of missing pool genotypes is taken to be 0.03 and 0.05. As shown in Fig. 5, the variances (relative efficiencies) increase (decrease) as the (completely) missing rate increases, and the increase (decrease) is more evident for larger pool sizes.
Fig. 5.

MSE (Left) and relative efficiencies (Right) for different rates of completely missing data in estimating the two-locus haplotype frequencies from pools of size K individuals each. Minor allele frequencies are 0.4 and 0.5; LD coefficient D′ = 0.5.
Application to AGT. We applied our method to pools of two individuals, with each pool being genotyped for 10 SNPs in the AGT gene (see description in Methods). There are 15 pools in this data set. The estimated haplotype frequencies and their variances are shown in Table 2. Of the 1,024 theoretically possible haplotypes, only 11 are observed (total frequency >0.9999). SNPs 8 and 9 exhibit the same allelic pattern across the 11 haplotypes, so that we are left with nine unique SNPs. This application demonstrates that estimating haplotype frequencies from pooled data is feasible for fairly large number of SNPs.
Table 2. Haplotype frequency estimates for 15 pools of two individuals, with each pool being genotyped for 10 SNPs.
| SNPs
|
|||||||||||
|---|---|---|---|---|---|---|---|---|---|---|---|
| Hap no. | 1 | 2 | 3 | 4 | 5 | 6 | 7 | 8 | 9 | 10 | h |
| 112 | 1 | 1 | 1 | 1 | 0 | 1 | 1 | 0 | 0 | 0 | 0.0333 |
| 492 | 1 | 1 | 0 | 1 | 0 | 1 | 1 | 1 | 1 | 0 | 0.0166 |
| 588 | 1 | 1 | 0 | 1 | 0 | 0 | 1 | 0 | 0 | 1 | 0.0167 |
| 618 | 1 | 0 | 0 | 1 | 0 | 1 | 1 | 0 | 0 | 1 | 0.0167 |
| 620 | 1 | 1 | 0 | 1 | 0 | 1 | 1 | 0 | 0 | 1 | 0.0167 |
| 923 | 0 | 1 | 0 | 1 | 1 | 0 | 0 | 1 | 1 | 1 | 0.0167 |
| 964 | 1 | 1 | 0 | 0 | 0 | 0 | 0 | 1 | 1 | 1 | 0.0333 |
| 971 | 0 | 1 | 0 | 1 | 0 | 0 | 1 | 1 | 1 | 1 | 0.1000 |
| 1004 | 1 | 1 | 0 | 1 | 0 | 1 | 1 | 1 | 1 | 1 | 0.1925 |
| 1008 | 1 | 1 | 1 | 1 | 0 | 1 | 1 | 1 | 1 | 1 | 0.5075 |
| 1024 | 1 | 1 | 1 | 1 | 1 | 1 | 1 | 1 | 1 | 1 | 0.0500 |
h is the estimated haplotype frequency. Rare haplotypes (Hap) with a total frequency of 0.0001 are not shown. Hap, haplotype
Discussion
We investigated the efficiency of the maximum likelihood estimation of haplotype frequencies for pooled DNA. The simulation results support the application of the pooling method as a practical strategy for reducing genotyping costs. On the basis of our simulation study, relative efficiency increases with pool size, but the gain in efficiency is less pronounced when the pool size becomes large. Pool sizes of three to four individuals per pool appear to be optimal, and 30 or more such pools are needed for the asymptotic variance estimates to be accurate enough to assess the variability of the haplotype frequency estimates.
To gauge the effect of the number of loci on pooling efficiency, we compare Figs. 1 (two SNPs) and 3 (three SNPs). The broken line for D′ = 0.75 in Fig. 1 is roughly equivalent to that for n = 180 in Fig. 3. We see that the relative efficiencies are about the same for each of the K = two to six pool sizes. We concluded from this limited comparison that the number of loci does not have much of an effect on efficiency when the SNPs are in high linkage equilibrium.
In a case-control study, testing the disease-haplotype association can be done by computing 2 log(Lcase) + 2 log(Lcontrol) - 2 log(Lcombined), which approximately has a χ2 distribution with 2m - 1 degrees of freedom under the null hypothesis of no association, where log(Lcase), log(Lcontrol) and log(Lcombined) are the log likelihoods for the case group, the control group, and the combined sample of case and control individuals, respectively. Note that the χ2 approximation is valid only if there are a sufficient number of observations in each category. It may not be valid when there are many SNPs or a small number of pools. In these cases, a permutation test would be appropriate, where the labels “case” and “control” would be permutated.
We have also assessed the accuracy of estimates of the asymptotic variances. We showed that the approximation is quite accurate when the number of pools is moderately large (say, >30). We also investigated the influence of missing values on the accuracy of haplotype frequency estimates and on the relative efficiency of pooling. As expected, missing values always decrease the accuracy of haplotype estimates but do not seem to severely affect the efficiency of pooling. Missing values should not be excluded from the study. Although missing values increase ambiguities compared with full data, excluding missing values always leads to a loss of information.
On the basis of the observation that only a small proportion of haplotypes really occur when the SNPs are in high LD, Barratt et al. (14) proposed to estimate haplotype frequencies by solving a set of linear equations given the allele frequency estimates from pooled data. This approach is especially useful for the case of large pools in which our likelihood methods are not feasible due to computer memory limitations. But it seems the equations are not always solvable when too few haplotypes occur. For the case of small to moderate pool sizes, our method has the advantage of providing standard errors in estimating the haplotype frequencies, from which confidence intervals may be constructed.
We have made the assumption of the Hardy–Weinberg equilibrium and random mating, which is necessary for likelihood analysis of haplotype estimation. It is believed that likelihood analysis does not suffer too much for slight deviations from these assumptions (20). The proposed algorithm is applicable to observations from an admixed population, but users of the method must be aware that the LD associated with the resulted haplotype frequency estimates may be inflated due to population substructure.
Acknowledgments
We thank three anonymous referees for helpful comments and K. Montague for careful reading of the manuscript. We thank Dr. A. Kumar at the New York Medical College in Valhalla for providing SNP data in the AGT gene. This work is supported by National Institutes of Health grants HG00008 (to J.O.) and K25-HG00060 (to J.H.).
Appendix
Derivation of Variance–Covariance Matrix for Haplotype Frequency Estimates. As shown in Louis (21), by denoting the observed pool-genotype data by Y and the unobserved haplotype data by X, the observed information matrix at h can be expressed as
 |
where B(X, h) is the negative of the second derivative matrix for log complete likelihood function, S(X, h) is the score function for complete data, and S*(Y, h) = E(S(X, h)|Y) is the observed score function. For pool i, denote the first derivative and the negative second derivative of the complete log likelihood by Si(Xi, h) and Bi(Xi, h) respectively. First, we derive a preliminary information matrix by taking all parameters h as free parameters (i.e., there is no constraint of summation to 1). The observed information matrix at h can be written as
 |
in which  ,
,  , and
, and  can be computed as follows. Let J be a member of
  and cJ(k) be the count of number k in set J and denote the indicator function of event E by IE. Then the kth component of Si = S(Xi, h) for pool i is shown to be
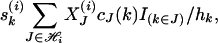 |
hence the kth component of  is
is
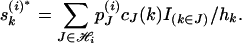 |
The (k, l) element of  is shown to be
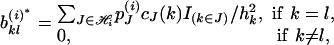 |
and the (k, l) element of  is
is
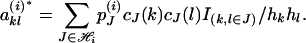 |
Therefore, the (k, l) element of IY(h) is
 |
The estimated observed information matrix can be obtained by plugging in the maximum likelihood estimate ĥ in IY(h), that is, IY(ĥ). The final estimated variance–covariance matrix of ĥ is given by taking the constraint on h into consideration [see Lange (2)]. is, IY(h
 |
where W is a 2m × (2m - 1) matrix with the first 2m - 1 rows the same as the 2m - 1 degree identity matrix, and the last row is (-1, -1,..., -1).
This paper was submitted directly (Track II) to the PNAS office.
Abbreviations: SNP, single-nucleotide polymorphism; LD, linkage disequilibrium; AGT, angiotensinogen gene; MSE, mean squared error.
Footnotes
Xie, X. & Ott, J. (1993) Am. J. Hum. Genet. 53, Suppl., 1107 (abstr.).
References
- 1.Clark, A. (1990) Mol. Biol. Evol. 7, 111-122. [DOI] [PubMed] [Google Scholar]
- 2.Lange, K. (1999) Numerical Analysis for Statisticians (Springer, Berlin).
- 3.Excoffier, L. & Slatkin, M. (1995) Mol. Biol. Evol. 12, 921-927. [DOI] [PubMed] [Google Scholar]
- 4.Hawley, M. & Kidd, K. (1995) J. Hered. 86, 409-411. [DOI] [PubMed] [Google Scholar]
- 5.Long, J., Williams, R. & Urbanek, M. (1995) Am. J. Hum. Genet. 56, 799-810. [PMC free article] [PubMed] [Google Scholar]
- 6.Fallin, D. & Schork, N. J. (2000) Am. J. Hum. Genet. 67, 947-959. [DOI] [PMC free article] [PubMed] [Google Scholar]
- 7.Churchill, G. A., Giovanni, J. J. & Tanksley, S. D. (1993) Proc. Natl. Acad. Sci. USA. 90, 16-20. [DOI] [PMC free article] [PubMed] [Google Scholar]
- 8.Amos, C. I., Marsha, L. & Wang, W. (2000) J. Am. Hum. Genet. 66, 1689-1692. [DOI] [PMC free article] [PubMed] [Google Scholar]
- 9.Daniels, J., Holmans, P., Williams, N., Turic, D., McGuffin, P., Plomin, R. & Owne, J. M. (1998) Am. J. Hum. Genet. 62, 1189-1197. [DOI] [PMC free article] [PubMed] [Google Scholar]
- 10.Sham, P., Bader, J. S., Craig, I., O'Donovan, M. & Owen, M. (2002) Nat. Rev. Genet. 3, 862-871. [DOI] [PubMed] [Google Scholar]
- 11.Shawn, S. H., Carrasquillo, M. M., Kashuk, C., Puffenberger, E. G. & Chakravarti, A. (1998) Genome Res. 8, 111-123. [DOI] [PubMed] [Google Scholar]
- 12.Sasaki, T., Tahira, T., Suzuki, A., Higasa, K., Kukita, Y., Baba, S. & Hayashi, K. (2001) Am. J. Hum. Genet. 68, 214-218. [DOI] [PMC free article] [PubMed] [Google Scholar]
- 13.Mohlke, K. L., Erdos, M. R., Scott, L. J., Fingerlin, T. E., Jackson, A. U., Silander, K., Hollstein, P., Boehnke, M. & Collins, F. S. (2002) Proc. Natl. Acad. Sci. USA 99, 16928-16933. [DOI] [PMC free article] [PubMed] [Google Scholar]
- 14.Barratt, B. J., Payne, F., Rance, H. E., Nutland, S., Todd, J. A. & Clayton, D. G. (2002) Ann. Hum. Genet. 66, 393-405. [DOI] [PubMed] [Google Scholar]
- 15.Pfeiffer, R. M., Rutter, J. L., Struewing, J. & Gastwirth, J. L. (2002) Genet. Epidemiol. 22, 94-102. [DOI] [PubMed] [Google Scholar]
- 16.Wang, S., Kidd, K. K. & Zhao, H. (2003) Genet. Epidemiol. 24, 74-82. [DOI] [PubMed] [Google Scholar]
- 17.Ito, T., Chiku, S., Inoue, E., Tomita, M., Morisaki, T., Morisaki, H. & Kamatani, N. (2003) Am. J. Hum. Genet. 72, 384-398. [DOI] [PMC free article] [PubMed] [Google Scholar]
- 18.Jain, S., Tang, X., Narayanan, C. S., Agarwal, Y., Peterson, S. M., Brown, C. D., Ott, J. & Kumar, A. (2002) J. Biol. Chem. 277, 36889-36896. [DOI] [PubMed] [Google Scholar]
- 19.Takahashi, M., Matsuda, F., Margetic, N., Lathrop, G. M. (2003) J. Bioinformatics Comput. Biol., in press. [DOI] [PubMed]
- 20.Wacholder, S., Rothman, N., Caporaso, N. (2000) J. Natl. Cancer Inst. 92, 1151-1158. [DOI] [PubMed] [Google Scholar]
- 21.Louis, T. A. (1982) J. R. Stat. Soc. B 44, 226-233. [Google Scholar]