Abstract
The migration of lymphocytes into inflammatory tissue requires the migrating cell to overcome mechanical forces produced by blood flow. A generally accepted hypothesis is that these forces are overcome by a multistep sequence of adhesive interactions between lymphocytes and endothelial cells. This hypothesis has been recently challenged by results demonstrating wall shear stress on the order of 20 dyn/cm2 in vivo and infrequent lymphocyte–endothelial adhesion at wall shear stress >1–2 dyn/cm2 in vitro. Here, we show that lymphocyte slowing and transmigration in the skin is associated with microangiectasias, i.e., focal structural dilatations of microvessel segments. Microangiectasias are inducible within 4 days of the onset of inflammation and lead to a greater than 10-fold local reduction in wall shear stress. These findings support the hypothesis that a preparatory step to lymphocyte transmigration involves structural adaptations in the inflammatory microcirculation.
Keywords: microcirculation, inflammation, microscopy, ultrastructure, cell movement
When recirculating lymphocytes migrate from the microcirculation to extravascular sites of inflammation, they must first adhere to the endothelial surface. Blood flowing across the vascular endothelium creates wall shear stress, dependent on flow velocity and vessel geometry, which tends to disrupt lymphocyte–endothelial cell adhesion. For more than a decade, the prevailing hypothesis has been that these hemodynamic stresses are overcome by a multistep sequence of adhesive interactions between lymphocytes and endothelial cells (1–3). According to this hypothesis, lymphocyte adhesion and extravascular migration should occur in any stimulated vascular segment that expresses the appropriate adhesion counterreceptor.
Levels of wall shear stress in normal microvessels are estimated to be on the order of 20 dyn/cm2 (1 dyn/cm2 = 0.1 Pa), although they show wide dispersion (4, 5). Lymphocytic inflammation is associated with an estimated 2- to 3-fold increase in blood flow rate at the peak of lymphocyte recruitment (6, 7). In a vessel of given size, wall shear stress increases in proportion to flow, suggesting that levels of wall shear stress may rise even further during inflammation. In contrast, in vitro studies of cell adhesion in simplified flow conditions indicate that lymphocyte–endothelial cell adhesions infrequently occur at wall shear stresses greater than ≈1 dyn/cm2 (8–10). These observations suggest a >10-fold discrepancy between microvascular wall shear stress levels that exist in inflammation and levels that permit lymphocyte adhesion.
In light of this discrepancy, we propose a “microhemodynamic” hypothesis of lymphocyte transmigration: that lymphocyte adhesion and transmigration occur in specialized vascular segments exhibiting structural changes that lead to decreased levels of flow velocity and wall shear stress. To test this hypothesis, we observed lymphocyte migration through the inflammatory microcirculation. The epicutaneous antigen oxazolone was used in a sheep model to stimulate lymphocyte recruitment out of the skin microcirculation. Previous work in this model has shown that the peak of lymphocyte recruitment occurs 96 h after the application of oxazolone (11). Regional efferent lymphocytes were fluorescently labeled and reinjected into the inflammatory microcirculation. These migratory cells were tracked through the inflammatory microcirculation by using epifluorescence intravital videomicroscopy.
Materials and Methods
In Vivo Microscopy. The custom-designed epi-illumination system delivered light through the optical system as bright-field, dark-field, or fluorescence illumination. The Nikon epi-achromat objectives were ×10 and ×20 magnification. The intravital microscopy was performed by using a custom-machined titanium stage (MicroSurg, Boston) that directly attached to the microscope stand to limit vibration. The tissue contact area consisted of two concentric 2.5-mm vacuum galleries that provided tissue apposition to the lens surface without compression of the tissue and with minimal circulatory disturbances. The image was intensified by using a GenIIsys optically coupled image intensifier (Dage-MTI, Michigan City, IN). Video of the recorded images was processed through an M-Vision 1000 PCI bus frame-grabber (MuTech, Billerica, MA) on a computer running the METAMORPH Imaging System 4.6 (Universal Imaging, Brandywine, PA) under Microsoft Windows NT (Redmond, WA). Image stacks were routinely created from 12-sec to 5-min video sequences. The image stacks were processed with standard METAMORPH filters. After routine distance calibration and thresholding, the “stacked” image sequence was measured by using METAMORPH's object tracking and integrated morphometry applications.
Induction of Inflammation. Randomly bred sheep, weighing 25–35 kg, were used. Sheep were excluded from the analysis if there was any gross or microscopic evidence of dermatitis. The sheep were given free access to food and water. The care of the animals was consistent with guidelines of the American Association for Accreditation of Laboratory Animal Care (Bethesda). The sheep ear and neck region was sheared bilaterally and the lanolin was removed with an equal mixture of diethyl ether (Baker, Phillipsburg, NJ) and ethanol (AAPER, Shelbyville, KY). The antigen, a 5% solution of 2-phenyl-4-ethoxymethylene-5-oxazolone (oxazolone; Sigma) is representative of compounds known as skin contact sensitizers (12). Oxazolone was sprayed onto the ear and a localized region of the neck as a 4:1 oxazolone/olive oil mixture by using a syringe and a 23-gauge needle. A vehicle-only control was applied to the contralateral skin.
Lymphocytes. The prescapular lymph node, with a lymphatic drainage basin including the ear and neck, was used for all efferent lymph duct cannulations. The lymphocytes demonstrated baseline phenotype and proliferation kinetics (11, 13). The efferent lymph duct was cannulated with a heparin-bonded polyurethane catheter (Solo-Cath, CBAS-C35; Setters Life Sciences, San Antonio, TX). The cannula was passed through a 5-cm s.c. tunnel and secured at the skin. The lymph was collected in 50-ml sterile centrifuge tubes (Falcon) containing 200 international units of heparin, 2,000 international units of penicillin (Cellgro, Mediatech, Herndon, VA), and 2 mg of streptomycin (Cellgro). The lymph cells were labeled with succinimidyl esters of the mixed isomer preparation of 5-(and 6-)carboxytetramethylrhodamine [5(6)-TAMRA; excitation 540 nm/emission 565 nm; Molecular Probes]. Before labeling, the lymph cells were washed three times in Dulbecco's modified Eagle's medium (DMEM) with 2 g/liter glucose (Sigma) and resuspended in PBS containing 25 μl of the stock 5(6)-TAMRA fluorescent dye. The cells were incubated for 15 min at room temperature and washed in cold DMEM. The cells were resuspended in room-temperature PBS at 0.7–5.0 × 10⁷ cells per ml before injection into the common carotid arteries proximal to the origin of the external auricular arteries. The common carotid arteries were exposed and cannulated with a heparin-bonded polyurethane catheter (Solo-Cath, CBAS-C35, Setters Life Sciences). The catheter was tunneled through the s.c. tissue to the dorsum of the neck and secured. The catheter was fitted with a stub-nose adapter and flushed with heparinized saline (100 units/ml) (Elkins-Sinn, Cherry Hill, NJ).
3D Electron Microscopy. After systemic heparinization with 750 units of heparin per kg i.v., the external auricular arteries were bilaterally cannulated and perfused with ≈100 ml of 37°C saline followed by a buffered 2.5% glutaraldehyde solution (Sigma) at pH 7.40. The casts were made by perfusion of the ear arteries with 100 ml of Mercox (SPI, West Chester, PA) diluted with 20% methylmethacrylate monomers (Aldrich). After complete polymerization and excision of samples for light microscopy, the ears were harvested and macerated in 5% potassium hydroxide followed by drying and mounting for scanning electron microscopy (SEM). The microvascular corrosion casts were imaged after coating with gold in an argon atmosphere with a Philips ESEM XL30 scanning electron microscope. Stereo-pair images were obtained by using tilt angles from 6° to 20°. Diameters were interactively measured orthogonal to the vessel axis after storage of calibrated images, using ANALYSIS software (version 2.1; Soft Imaging Systems, Münster, Germany). The quality of the filling of the corrosion casts was also checked by comparisons with the vascular densities in semithin light microscopic sections stained with methylene blue. The corrosion casts demonstrated filling of the whole capillary bed from artery to vein without evidence of extravasation or pressure distension. Judged on the basis of previous work (14), shrinkage of the corrosion casts was on the order of 6%.
Computation of Wall Shear Stress. A finite element program (F LEXPDE, PDE Solutions, Antioch, CA) was used to solve for Stokes flow (i.e., flow of a Newtonian fluid with fixed viscosity and negligible inertia) in an axisymmetric geometry. The shape of the vessel wall in the transition region consists of parts of two ellipses, matched to give continuous slopes. The center-line flow velocity in the afferent vessel was assumed to be 2 mm/sec, in the range of the lymphocyte velocities observed in this region (see Fig. 2), corresponding to a flow rate of 10-7 cm3/sec. Blood viscosity in microvessels was assumed to be 2.2 centipoise (15). The computed estimates of wall shear stress are directly proportional to the assumed values of these two parameters, and the relative changes are unaffected by the assumed values.
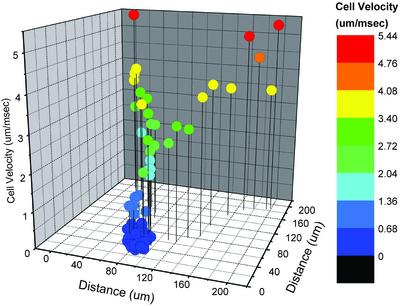
Fig. 2.
Velocity–location map of lymphocytes passing through a representative dermal microangiectasia after a single carotid artery injection of fluorescently labeled lymphocytes. Overall flow direction is from left to right. Velocities were calculated at 33-msec intervals, color-coded as indicated, and plotted on a 200-μm × 200-μm grid. Microangiectasias were functionally defined by lymphocyte velocities <0.68 μm/msec (dark blue).
Results and Discussion
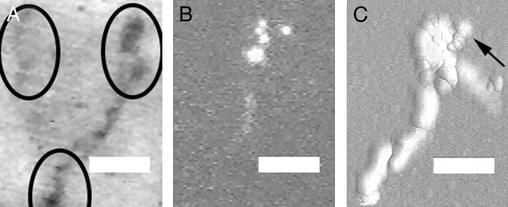
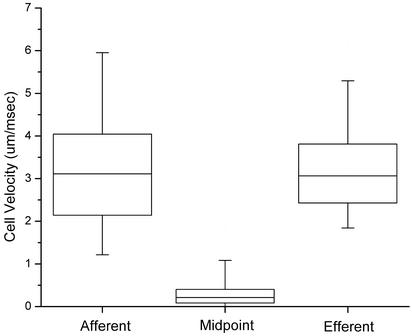
The intravital videomicroscopy studies of the control microcirculation showed that >99% of the observed cells had flow velocities >2 μm/msec; no reproducible regions of lymphocyte slowing were observed (16). In contrast, the oxazolone-stimulated microcirculation demonstrated reproducible lymphocyte slowing in focal regions of the microcirculation (Fig. 1; ref. 17). The focal regions were spaced at ≈100-μm intervals across the dermal surface (Fig. 1 A). These were the only regions of the superficial vascular plexus where lymphocyte transmigration was observed (Fig. 1C; ref. 17). Lymphocytes in these regions demonstrated a greater than 10-fold reduction in flow velocity (Figs. 2 and 3). After the cells passed through these vascular segments, they rapidly returned to baseline flow velocities (Figs. 2 and 3).
Fig. 1.
Intravital fluorescence videomicroscopy of dermal microcirculation 96 h after oxazolone stimulation. (Bar = 60 μm.) (A) Representative dark-field image. Circles identify focal regions associated with lymphocyte slowing and transmigration. (B) Image showing five fluorescently labeled lymph-derived cells passing through a focal region. (C) Digital quasi-3D recombination of 180 images (30 frames per sec) showing 30 cells passing through a focal region and providing an outline of an apparent microangiectasia. The arrow shows the direction of blood flow and the image of a transmigrated cell. Note that the cell transmigrates early in the dilated segment. A corresponding video sequence, Movie 1 (streamed at reduced frame rates to facilitate presentation), is published as supporting information on the PNAS web site, www.pnas.org.
Fig. 3.
Velocities of fluorescently labeled lymphocytes traversing microangiectasias 96 h after the application of oxazolone, based on observations of 600 cells in four sheep. Instantaneous cell velocities were measured 150 μm upstream of the functional midpoint of the microangiectasia (afferent), at the midpoint (midpoint), and 150 μm beyond (efferent). Boxes represent 25–75% range; whiskers represent 5–95% range. Slowing at midpoint was highly significant (P < 0.0001 by Student's t test). Because of spatial limitations of the optical fields and temporal limitations of the video streaming, cell velocities >5 μm/msec could not be reliably measured; therefore, the indicated afferent and efferent velocity ranges may be underestimates.
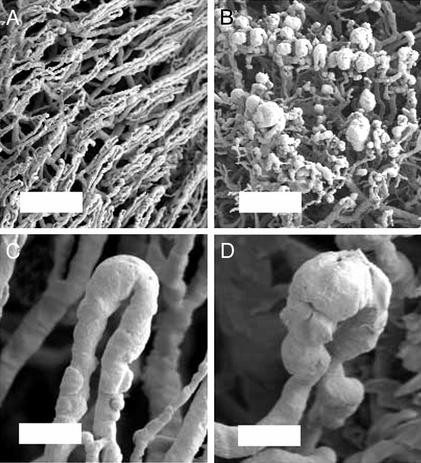
The focal nature of these vascular segments precluded analysis by standard 2D histology. Similarly, painstaking reconstructive techniques have only suggested the presence of vascular dilatation (18, 19). To evaluate the 3D structure of these focal regions of lymphocyte slowing and transmigration, we studied corrosion casts of the inflammatory microcirculation by using stereo-pair SEM (20, 21). 3D SEM of the microcirculation 96 h after oxazolone stimulation showed focal dilatation of vessels in the superficial vascular plexus (Fig. 4). The dilated segments, here referred to as microangiectasias, were located at ≈100-μm intervals, corresponding to the observed spacing of the regions of lymphocyte slowing. Vascular diameters averaged 11.3 ± 3.3 μm (mean ± SD, n = 58) in the afferent segment, 27.4 ± 9.6 μm in the dilated segment, and 16.3 ± 5.4 μm in the efferent segment. In control tissues, corresponding diameters were 11.1 ± 3.1 μm in the afferent segment (n = 58), 15.3 ± 4.0 μm in the tip of the loop, and 11.7 ± 2.9 μm in the efferent segment. Diameter increases in the tip of the loop and efferent segment of inflammatory tissue relative to control were significant (P < 0.001; Mann–Whitney rank sum test). The dilated microvessels were morphologically most consistent with capillary sinusoids and appeared to be present at the transition point between the capillary and postcapillary venule.
Fig. 4.
Scanning electron micrographs of control (A and C) and oxazolone-stimulated (B and D) microcirculation 96 h after application of oxazolone. Microcirculatory topology was analyzed by using SEM of microvascular corrosion casts. Representative examples of low-magnification (A and B; bar = 200 μm) and high-magnification (C and D; bar = 50 μm) scanning electron micrographs are shown.
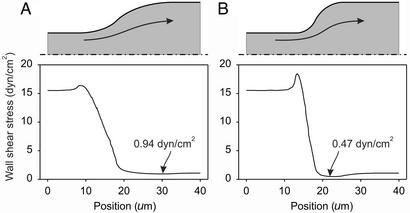
For a given volume flow rate of blood, wall shear stress decreases with increasing vessel diameter, and stress is therefore reduced in microangiectasias. To estimate wall shear stresses, we performed finite-element computations of flow fields in the neighborhood of the transition from the afferent vessel to the dilated segment (Fig. 5). Axisymmetric geometries were assumed, with diameters corresponding to the mean measured values. Two different transition profiles, gradual and abrupt, were considered. These transition profiles were representative of the range of shapes seen in the scanning electron micrographs. Computed wall shear stresses declined by a factor of >10 from the afferent segment to the microangiectasia. Lowest levels occurred immediately inside the entrance to the dilated region and were <1 dyn/cm2. For a given flow rate, a more abrupt transition in diameter resulted in a lower minimum shear stress. Corresponding calculations for control tissues predicted wall shear stresses >5 dyn/cm2 in the tip of the loop.
Fig. 5.
Estimation of wall shear stress variation in microangiectasias. (A) Gradual transition in diameter. (B) Abrupt transition. In each case, the assumed vessel shapes are given by rotating the shaded region about the axis of symmetry (dash-dotted line). Arrows indicate approximate streamlines of flow. The graphs show the corresponding variation of fluid shear stress on the outer wall. In each case, wall shear stress is 15.5 dyn/cm2 in the afferent segment and approaches 1.08 dyn/cm2 in the dilated segment. The locations of minimum wall shear stress are indicated.
These results support the microhemodynamic hypothesis of lymphocyte transmigration, showing that wall shear stresses are reduced sufficiently in the entrance region of microangiectasias to permit adhesion of lymphocytes to the endothelial surface. Formation of such structures appears to be a preparatory step to lymphocyte transmigration in lymphocytic inflammation. The localized nature of the dilatations is crucial. A generalized dilatation would increase blood flow and likely lead to an increase in wall shear stress.
The development of microangiectasias provides a possible explanation for the observed delay of 3-4 days between the application of oxazolone and lymphocyte recruitment. A similar delay has been seen for the development of the lymphocyte response to alloantigen (13). This delay may reflect the time taken for vascular cells to reorganize or proliferate sufficiently to produce the observed changes in vascular morphology. The time course for the structural changes may therefore be an important factor in determining the tempo of lymphocyte inflammation. The localization and coordination of the structural changes suggest the presence of mechanisms for information transfer not only between antigen-stimulated tissue and microvessels but also among vascular cells. Understanding the mechanisms of microangiectasia formation could open new therapeutic avenues for inflammation and immune responses.
According to the prevailing multistep hypothesis, the sites of lymphocyte adhesion and extravasation are determined by the localized expression of adhesion molecules on the endothelial surface (1–3). The present findings in sheep skin suggest an important modification to this hypothesis: namely, that specific structural responses in microvessels regulate lymphocyte extravasation by reducing wall shear stress to levels that permit adhesion. Given the wide dispersion of wall shear stress levels in the microcirculation, sporadic lymphocyte transmigration may occur in other vascular segments with sufficiently low levels of wall shear stress. However, microangiectasia formation is a mechanism for controlled, localized creation of hemodynamic conditions suitable for lymphocyte adhesion and transmigration.
Supplementary Material
Acknowledgments
This work was supported in part by National Institutes of Health Grants HL47078 (to S.J.M.) and HL34555 (to T.W.S.) and Deutsche Forschungsgemeinschaft Grant KO 1050/6-2 (to M.A.K.).
Abbreviation: SEM, scanning electron microscopy.
References
- 1.Granger, D. N. & Kubes, P. (1994) J. Leukocyte Biol. 55, 662-675. [PubMed] [Google Scholar]
- 2.Springer, T. A. (1995) Annu. Rev. Physiol. 57, 827-872. [DOI] [PubMed] [Google Scholar]
- 3.Mentzer, S. J., Burakoff, S. J. & Faller, D. V. (1986) J. Cell. Physiol. 126, 285-290. [DOI] [PubMed] [Google Scholar]
- 4.Lipowsky, H. H., Kovalcheck, S. & Zweifach, B. W. (1978) Circ. Res. 43, 738-749. [DOI] [PubMed] [Google Scholar]
- 5.Pries, A. R., Secomb, T. W. & Gaehtgens, P. (1998) Am. J. Physiol. 275, H349-H360. [DOI] [PubMed] [Google Scholar]
- 6.He, C., Young, A. J., West, C. A., Su, M., Konerding, M. A. & Mentzer, S. J. (2002) J. Appl. Physiol. 93, 966-973. [DOI] [PubMed] [Google Scholar]
- 7.West, C. A., He, C., Su, M., Young, A. J., Swanson, S. J. & Mentzer, S. J. (2002) Inflammation Res. 51, 572-578. [DOI] [PubMed] [Google Scholar]
- 8.Li, X., Su, M., West, C. A., He, C., Swanson, S. J., Secomb, T. W. & Mentzer, S. J. (2001) In Vitro Cell Dev. Biol. 37, 599-605. [DOI] [PubMed] [Google Scholar]
- 9.Li, X., Abdi, K., Rawn, J., Mackay, C. R. & Mentzer, S. J. (1996) Am. J. Respir. Cell Mol. Biol. 14, 398-406. [DOI] [PubMed] [Google Scholar]
- 10.Melder, R. J., Munn, L. L., Yamada, S., Ohkubo, C. & Jain, R. K. (1995) Biophys. J. 69, 2131-2138. [DOI] [PMC free article] [PubMed] [Google Scholar]
- 11.West, C. A., He, C., Su, M., Rawn, J., Swanson, S., Hay, J. B. & Mentzer, S. J. (2001) J. Immunol. 166, 1517-1523. [DOI] [PubMed] [Google Scholar]
- 12.Gell, P. G. H., Harington, C. R. & Rivers, R. P. (1946) Br. J. Exp. Pathol. 27, 267-286. [PMC free article] [PubMed] [Google Scholar]
- 13.Su, M., Young, A. J., He, C., West, C. A. & Mentzer, S. J. (2001) Transplantation 72, 516-522. [DOI] [PubMed] [Google Scholar]
- 14.Konerding, M. A. (1991) Scanning Microsc. 5, 851-865. [PubMed] [Google Scholar]
- 15.Pries, A. R., Secomb, T. W., Gessner, T., Sperandio, M. B., Gross, J. F. & Gaehtgens, P. (1994) Circ. Res. 75, 904-915. [DOI] [PubMed] [Google Scholar]
- 16.Su, M., West, C. A., Young, A. J., He, C., Konerding, M. A. & Mentzer, S. J. (2002) J. Cell. Physiol. 194, 54-62. [DOI] [PubMed] [Google Scholar]
- 17.West, C. A., He, C., Su, M., Secomb, T. W., Konerding, M. A., Young, A. J. & Mentzer, S. J. (2001) Am. J. Physiol. 281, H1742-H1750. [DOI] [PubMed] [Google Scholar]
- 18.Braverman, I. M. (1997) Microcirculation 4, 329-340. [DOI] [PubMed] [Google Scholar]
- 19.Braverman, I. M. & Yen, A. (1977) J. Invest. Dermatol. 68, 53-60. [DOI] [PubMed] [Google Scholar]
- 20.Konerding, M. A., Fait, E. & Gaumann, A. (2001) Br. J. Cancer 84, 1354-1362. [DOI] [PMC free article] [PubMed] [Google Scholar]
- 21.Konerding, M. A., Malkusch, W., Klapthor, B., van Ackern, C., Fait, E., Hill, S. A., Parkins, C., Chaplin, D. J., Presta, M. & Denekamp, J. (1999) Br. J. Cancer 80, 724-732. [DOI] [PMC free article] [PubMed] [Google Scholar]
Associated Data
This section collects any data citations, data availability statements, or supplementary materials included in this article.


