


Abstract
A number of methods have recently been published that use phylogenetic information extracted from large multiple sequence alignments to detect sites that have changed properties in related protein families. In this study we use such methods to assess functional divergence between eukaryotic EF-1α (eEF-1α), archaebacterial EF-1α (aEF-1α) and two eukaryote-specific EF-1α paralogs—eukaryotic release factor 3 (eRF3) and Hsp70 subfamily B suppressor 1 (HBS1). Overall, the evolutionary modes of aEF-1α, HBS1 and eRF3 appear to significantly differ from that of eEF-1α. However, functionally divergent (FD) sites detected between aEF-1α and eEF-1α only weakly overlap with sites implicated as putative EF-1β or aminoacyl-tRNA (aa-tRNA) binding residues in EF-1α, as expected based on the shared ancestral primary translational functions of these two orthologs. In contrast, FD sites detected between eEF-1α and its paralogs significantly overlap with the putative EF-1β and/or aa-tRNA binding sites in EF-1α. In eRF3 and HBS1, these sites appear to be released from functional constraints, indicating that they bind neither eEF-1β nor aa-tRNA. These results are consistent with experimental observations that eRF3 does not bind to aa-tRNA, but do not support the ‘EF-1α-like’ function recently proposed for HBS1. We re-assess the available genetic data for HBS1 in light of our analyses, and propose that this protein may function in stop codon-independent peptide release.
INTRODUCTION
In the 1970s, Fitch and co-workers proposed the concomitantly variable codons (covarion) model of molecular evolution that held that the codons in a protein gene (or amino acid states in the corresponding polypeptide) are free to vary changes over time (1). However, the importance of such models for phylogenetic reconstruction and to the understanding of molecular evolutionary processes was not widely recognized until recently. The covarion concept, although originally applied to codons (1), has been investigated in the context of nucleotides in structural RNA genes (covariotide models) (2) as well as amino acid sequences (3). Furthermore, simple covarion models in which sites are either ‘variable’ or ‘invariable’ have now been extended and merged with ideas that different sites may have different intrinsic rates of evolution [e.g. as modeled by a gamma (Γ) distribution (4)]. Such hybrids of covarion and rates-across-sites models assume that sites may switch between different rates of evolution on different branches of the tree (2,5). The main differences between the various approaches for studying ‘covarion-like’ evolution in molecules employed to date involve whether the changes in rates at sites are seen as stochastic and relatively homogeneous over branches of trees [a kind of ‘covarion drift’ model, as in the models described previously (2,5–7)] or whether they are modeled as infrequent major shifts in the rate distribution across many sites at once [a ‘covarion shift’ model as modeled by a bivariate rate distribution across a phylogenetic split (8)]. Clearly both phenomena occur and are not necessarily mutually exclusive (8–11). Much recent work has focused on understanding the functional or structural basis of such covarion effects especially in the context of identifying changes in functional constraints at sites after gene duplication or in functionally altered orthologs (9,11). With the explosive increase in the number of protein tertiary structures and gene sequences available from phylogenetically diverse organisms, these kinds of analyses are becoming increasingly useful for predicting functional or structural properties of protein subfamilies.
We have recently developed regression and parametric bootstrap methods to rigorously determine whether covarion shifts (or ‘rate distribution changes’) have occurred across phylogenetic splits in aligned protein families (8). Once such shifts are detected, additional methods can be used to pinpoint the specific sites in alignments that have significantly altered their evolutionary rate across the sub-trees. Recent studies indicate that significant rate changes at sites are clearly associated with functional and/or structural changes between protein subfamilies (9). As a result, Gu has termed these alignment positions ‘type I’ functionally divergent (or ‘type I’ FD) sites (12). However, it is also clear that functional divergence between protein subfamilies can also occur in a rate-independent manner (12). Changes in the identity of a highly conserved residue or in the required chemical properties of a site in a protein subfamily may alter its function without affecting the overall rate of evolution at that site. Positions where this kind of functional divergence has occurred are referred to as ‘type II’ FD sites (12). We have recently described several methods to detect type II FD sites (13). In this manuscript, we use these methods to assess functional divergence within the elongation factor 1α family, its binding partners and paralogs.
Translation elongation factor 1α (EF-1α) is one of the guanidine nucleotide-binding proteins involved in the elongation step of protein synthesis in eukaryotes and archaebacteria. The GTP-bound form of EF-1α binds to aminoacyl-tRNA (aa-tRNA) and delivers it to the A-site of an mRNA-programmed ribosome (14,15). GTP is hydrolyzed upon cognate codon–anticodon interaction between a tRNA and mRNA in the ribosome, after which an inactive EF-1α·GDP disassociates from ribosome (14,15). To initiate the next round of the elongation step, EF-1α must bind to a GDP/GTP exchange factor (GEF) to recharge it with GTP (14,15). In eukaryotes, EF-1α binds a multi-subunit GEF, the EF-1βγδ complex, to exchange GDP to GTP, whereas archaebacterial genomes appear to encode only homologs of the GEF domain in eukaryotic EF-1β. In addition to its role in translation, eukaryotic EF-1α (eEF-1α) appears to have auxiliary functions that involve binding to cytoskeletal proteins, such as actin and tubulins (14,15). Archaebacterial EF-1α (aEF-1α) is unlikely to have these functions, as archaebacteria lack these cytoskeletal proteins.
In addition to eEF-1α, eukaryotes have two EF-1α paralogs: (i) eukaryotic release factor 3 (eRF3) that is involved in the translation termination process, and (ii) Hsp70 subfamily B suppressor 1 (HBS1), the function of which is poorly understood. The absence of HBS1 and eRF3 in any complete archaebacterial genome coupled with their phylogenetic distributions amongst eukaryotes suggests these EF-1α paralogs were established in the eukaryotic lineage after splitting from the archaebacteria, but before the divergence of extant eukaryotes (16,17). Both HBS1 and eRF3 are generally comprised of two domains, an N-terminal domain that varies in amino acid sequence and length, and a C-terminal domain that has high sequence similarity to EF-1α (17). Genetic studies in yeast indicate that the C-terminal (EF-1α-like) domain in eRF3 (eRF3CTD) is essential for its function and cell viability (18). Eukaryotic RF3 binds tightly to eukaryotic release factor 1 (eRF1), which recognizes stop codons and promotes nascent peptide release from ribosomes (19,20). Recent studies indicate that eRF3 interacts with the poly(A)-binding protein (PABP), up-frameshift protein 1 (UPF1) and UPF1-like helicase, suggesting that eRF3 is involved in the nonsense-mediated mRNA decay process (21–23). In contrast to eRF3 (and EF-1α), disruption of HBS1 yielded no observable phenotype in yeast cells (24). Furthermore, genetic studies indicate that HBS1 does not have all of the functions of eRF3, since mammalian HBS1 cannot complement a mutation in yeast eRF3 and does not bind to eRF1 (16). Instead, increasing the copy number of HBS1 can suppress mutations in cytosolic heat shock protein 70 (Hsp70) (25).
Here we investigate type I and type II functional divergence between (i) eEF-1α and aEF-1α; (ii) eEF-1α and the C-terminal domain of HBS1 (HBS1CTD) and (iii) eEF-1α and eRF3CTD. FD sites between archaebacterial EF-1β (aEF-1β) and the GEF domain in eukaryotic EF-1β (eEF-1βGEF) are also identified to assess functional divergence in an EF-1α binding partner. To improve the taxonomic sampling of these data sets and reduce sampling error in the site-rate estimates, we isolated novel HBS1 and/or eRF3 genes from three unicellular eukaryotes (protists); Giardia lamblia (a diplomonad), Trypanosoma brucei (a kinetoplastid) and Dictyostelium discoideum (a mycetozoan). Additionally, we sequenced EF-1β genes from two protists: Spironucleus barkhanus (a diplomonad) and Trichomonas vaginalis (a parabasalid). Type I and type II FD sites were then estimated for the updated EF-1α superfamily data sets and mapped on the yeast EF-1α·EF-1β·GDP tertiary structure. By characterizing the patterns of functional divergence between eEF-1α and its orthologs and paralogs and correlating them with known regions of functional importance in these proteins, we were able to make inferences and predictions about the changes in function in the elongation factor superfamily.
MATERIALS AND METHODS
DNA sequencing and database searches
The EF-1α-like (C-terminal) portion of Trypanosoma eRF3 gene was amplified by a degenerate primer 35F1A (5′-GTCTTTATCGGCCAYGTNGAYGCNGG-3′; Y for T or C, N for A, C, G and T, respectively) and an exact-match primer based on a genome survey sequence (GSS). The EF-1α-like portion of Trypanosoma HBS1 gene was obtained by PCR using a set of exact-match primers based on a GSS and an expressed sequence tag sequence. cDNA clones SLI621 and SSK108 for Dictyostelium eRF3 and HBS1 genes were provided from the Dictyostelium cDNA project in Japan (University of Tsukuba, Tsukuba, Japan) (26). SLI621 appears to cover the entire EF-1α-like portion of the eRF3 gene, while SSK108 lacks the portion corresponding to EF-1α domain 1 (guanidine nucleotide binding domain). The entire EF-1α-like portion of Dictyostelium HBS1 gene was amplified by PCR using 35F1A and an exact-match primer based on SSK108 DNA sequence. The entire HBS1 gene of Giardia was amplified using a set of exact-match primers based on high throughput genome sequences from the Giardia genome project (the Marine Biological Laboratory, Woods Hole, MA) (27). EF-1β cDNA clones for Trichomonas and Spironucleus were provided by R. Hirt and T. M. Embley (National History Museum, London, UK) and M. Ragan (The University of Queensland, Brisbane, Australia), respectively. All cDNA clones were sequenced completely on both strands. PCR products were cloned into pCR 2.1 TOPO vector (Invitrogen). Subsequently, multiple clones were sequenced to avoid possible PCR-induced sequence changes.
Eukaryotic EF-1β and aEF-1β sequences were retrieved from the GenBank database, except those of Candida albicans, Cryptococcus neoformans and Theileria parva. Sequence data for Candida was obtained from the Stanford Genome Technology Center website at www.sequence.stanford.edu/group/candida. Sequencing of Candida was accomplished with the support of the NIDR and the Burroughs Wellcome Fund. Preliminary sequence data of Theileria was obtained from The Institute for Genomic Research website at www.tigr.org. The cDNA sequence of Cryptococcus EF-1β was identified in the website at the University of Oklahoma’s Advanced Center for Genome Technology (www.genome.ou.edu/cneo.html). The contig sequences for the putative EF-1β genes of archaebacteria Methanosarcina barkeri and Ferroplasma acidarmanus were obtained from the DOE Joint Genome Institute www site (www.jgi.doe.gov).
Phylogenetic analyses
A data set that includes 13 aEF-1α, 27 eEF-1α, 17 eRF3CTD and 13 HBS1CTD sequences was obtained by adding novel protist HBS1CTD/eRF3CTD sequences to a previous data set (17). The removal of ambiguously aligned sites and sites containing gaps left 269 positions that are shared among all four protein families (Alpha data set). A maximum likelihood (ML) distance tree was reconstructed as follows: a protein distance matrix was calculated from the Alpha data set with the JTT amino acid substitution model with among-site rate variation modeled using a discrete Γ distribution (eight equally probable rate categories) (JTT+Γ model) in Tree-Puzzle v.4.0.2 (28). Subsequently, a tree was reconstructed from the ML distance matrix using the Fitch–Margoliash weighted least-squares (FM) method with global rearrangements and five jumbles implemented in Phylip v.3.5 (29). Branch lengths for the optimal tree were re-estimated by the ML method with the JTT+Γ model using Tree-Puzzle v.4.0.2 (28). Five hundred resampled data sets were generated from the Alpha data set and used for bootstrap analysis with the ML distance method employing the JTT+Γ model using Tree-Puzzle v.4.0.2 (28), Fitch and Consense in Phylip v.3.5 (29) and Puzzleboot v.1.02 (A. J. Roger and M. E. Holder; http://hades.biochem.dal.ca/Rogerlab/Software/software.html). Only the global rearrangements option in the FM method was used for the bootstrap analysis.
Thirty eEF-1βGEF and 14 aEF-1β sequences were aligned by ClustalW (30). After exclusion of ambiguously aligned sites and sites including gaps, 78 positions in EF-1β were used in phylogenetic analyses (Beta data set). The details of the EF-1β analyses are the same as described above. Shape parameters of α = 0.95 and 2.86 for the discrete Γ distribution were estimated from the Alpha and Beta data sets using Tree-Puzzle v.4.0.2 (28), respectively. These parameters were used for the analyses described above.
The names and DDBJ/EMBL/GenBank accession numbers of the sequences used in this study are listed in supporting information.
Rate distance across two sub-trees
We have previously proposed a parametric bootstrap method to evaluate overall ‘rate distances’ across two sub-trees in a large (combined) phylogenetic tree (8). The sum of the ‘absolute value’ weighted differences of conditional mode site-rates across two sub-trees can be proposed as a representative of the overall rate distance across two sub-trees (designated as ‘abrsum’) (8). In addition, the same summation of ‘non-absolute value’ weighted site-rate differences indicates the overall direction of rate shift across two sub-trees (designated as ‘brsum’) (8). A shape parameter α was obtained from a combined data set including two sub-trees (α total), and applied to the site-rate estimations of both sub-trees. For Monte Carlo simulation of data sets, we first reconstructed a ML distance/FM tree with ML branch lengths from a real combined data set, then 1000 data sets were simulated employing the JTT+Γ model over the ML distance/FM tree using Pseq-Gen v.1.1 (31).
Orthogonal regression tests are useful to independently verify the results from parametric bootstrap analysis (8). For regression tests, we estimated conditional mean site-rates of two sub-trees using the bivariate ML rate estimation (8). Subsequently, log-transformed site-rates were compared using orthogonal regression methodology (8).
We generated three combined data sets containing (i) eEF-1α and aEF-1α sequences, (ii) eEF-1α and HBS1CTD sequences and (iii) eEF-1α and eRF3CTD sequences from the Alpha data set. These combined data sets were used for parametric bootstrap and regression tests. The tests between eEF-1β and aEF-1β sequences were carried out using the Beta data set. For these analyses, separate estimations of the shape parameters (αs) for Γ distributions were required for each comparison of two sub-trees. Shape parameters αtotal for these site-rate estimations are summarized in Table 1.
Table 1. Data sets and shape parameters αtotal for the discrete Γ distribution.
| Data set | αtotal | |
|---|---|---|
| Alpha | [70] | 0.95 |
| eEF-1α + aEF-1α | [40] | 0.63 |
| eEF-1α + HBS1 | [40] | 0.89 |
| eEF-1α + eRF3 | [44] | 0.98 |
| Beta | [44] | 2.86 |
The Alpha data set includes eEF-1α, aEF-1α, HBS1 and eRF3. The Beta data set includes eEF-1β and aEF-1β. The numbers of sequences in each data set are shown in brackets.
Identification of putative functionally divergent sites across two sub-trees
We identified putative FD sites across two sub-trees using three different methods. The first method is bivariate ML rate estimation (8). Briefly, site-rates are estimated by determining the rates with the highest posterior probability given the model, tree and the data (conditional mode site-rates). The model consists of the PAM001 matrix of amino acid interchange and a bivariate discrete rate distribution to describe among-site rate variation in the two sub-trees made up of a matrix of 25 × 25 equally spaced rate categories with probabilities estimated from the data by ML. The confidence intervals of site-rate differences (ΔSR) across two sub-trees are then constructed (8), and the sites at which 95% confidence intervals do not contain 0 are defined as ‘type I’ FD sites. Since the site-rates of aEF-1α, HBS1 or eRF3 were subtracted from those of eEF-1α, a site with positive ΔSR indicates that a site has been evolving faster in eEF-1α than in the other data set [herein defined as a ‘positive rate-shift (RS+)’ site]. Type I FD sites with negative ΔSR are defined as ‘RS–’ sites, suggesting that such sites in eEF-1α have been evolving slower than in the other data set. Specific details and justifications of these methods are described elsewhere (8).
Sites that do not differ in site-rates across sub-trees nevertheless have altered functional constraints in the proteins found in these sub-trees are possible. Two kinds of such sites, ‘differently evolving (DE)’ and ‘absolutely differently evolving (ADE)’ sites, are identified by covARES v.0.9 (13). DE sites are those which are constant with identity I in one sub-tree, while the corresponding sites in the other sub-tree are varied and the proportion of I is <0.2 (13). At ADE sites, each sub-tree has a single 100% conserved amino acid state that differs across the sub-trees. While DE or ADE sites have a different mode of evolution in the two sub-trees, they are not necessarily associated with significant site-rate shifts (13). Thus, following Gu’s terminology (12), we define ADE and DE sites as ‘type II’ FD sites to distinguish them from type I FD (RS+ or RS–) sites.
Site-by-site comparison of preferred chemical properties at a site in sub-trees (the ‘CP value’) is the third method for the detection of the FD sites across two sub-trees (13). The CP value at a site is an eight-dimensional normal vector that summarizes the chemical and structural characteristics of amino acid side chains at a site (13). covARES v.0.9 calculates CP values at sites for each sub-tree in a combined data set, and tests whether the CP difference (ΔCPs) at a site is significant by simulating a null distribution of amino acid states drawn randomly in proportion to the amino acid frequencies of the data (13). Henceforth, we refer to sites with significant ΔCPs as ‘ΔCPs sites’. As with DE/ADE sites, ΔCPs sites may or may not correspond to sites with significant site-rate shifts and are herein categorized as type II FD sites.
Tertiary structure analyses
The FD sites detected across two sub-trees were mapped on the yeast EF-1α·EF-1β·GDP complex [Protein Data Bank (PDB) file 1IJF] using covARES v.0.9 (13). The yeast structures mapped with FD sites were visualized and analyzed with VMD v.1.6.1 (32).
Archaebacterial EF-1α and eEF-1α are significantly similar at both the primary amino acid sequence and tertiary structural levels (33–35). Likewise, aEF-1β and eEF-1βGEF are structurally similar and clearly homologous (36,37). Thus, the molecular interaction between EF-1α and its GEF should be conserved across the Eukaryota–Archaebacteria split. Here we assume that the EF-1α residues that are within 5 Å to EF-1β in the tertiary structure (see below) are putative EF-1β binding sites. These sites were identified based on tertiary structural analyses of the yeast EF-1α·EF-1β·GDP complex (PDB file 1IJF) (33,34). To calculate distances from particular ‘residues’ in a structure in a way that is less sensitive to taxonomic differences in the sequences of homologs, side chains of amino acid residues in the structures were abstracted to ‘centroids’ with a midpoint at the average position of all the side chain atoms excluding Cα (13). These midpoints were then used to calculate the residue to residue distances in this study.
The tertiary interaction between aa-tRNA and EF-1α is expected to be similar to the interaction between aa-tRNA and the eubacterial EF-1α ortholog, EF-Tu. Since neither aEF-1α nor eEF-1α has been crystallized with aa-tRNA, Thermus aquaticus EF-Tu·Phe-tRNAPhe·GMPPMP complex (PDB file 1TTT) (38) was analyzed to identify the EF-Tu residues that have side chain atoms within 5 Å of any of the atoms of Phe-tRNAPhe. These residues are considered to potentially be involved in aa-tRNA binding. The putative aa-tRNA binding residues in eEF-1α were then inferred based on an alignment of EF-Tu and EF-1α sequences. The specific positions of the inferred EF-1β and aa-tRNA binding sites are shown in supporting information.
Solvent accessible surface area (ASA) is a widely used measure for evaluating the degree to which amino acid side chains in the polypeptide are exposed to the surface of the protein. However, it is well known that ASA values are significantly affected by the primary amino acid sequence of the polypeptide (39). Therefore, it is an imprecise measure of general solvent accessibility at a site when many homologs that differ in primary sequence are under consideration. To address this issue, we have developed an alternative measure called neighboring sites anisotropy (NSA) that expresses the position of a site relative to the surface of the protein without making specific assumptions regarding the identity of the site. This novel measure is less sensitive to variations in the primary amino acid sequence than the ASA test and more valid for comparative analysis. Details regarding how the NSA measure is calculated and its relationship to ASA can be found at our web site (http://hades.biochem.dal.ca/Rogerlab/Christian/NSA.html). The NSA values of all amino acid sites in EF-1α were calculated based on the yeast EF-1α·EF-1β·GDP complex (PDB file 1IJF) using covARES v.0.9 (13).
Statistical tests for the correlation between FD sites and putative binding sites in EF-1α
We tested the correlation between the classification of FD sites (i.e. RS+, RS– and type II FD) and their putative biological roles in EF-1α (i.e. putative EF-1β and aa-tRNA binding sites) using χ2 tests. We also calculated the estimated proportion ratio, which is the proportion of FD sites of a given type within the set of sites with a particular binding function divided by the proportion of FD sites of the given type in the entire alignment. Estimated proportion ratio values >>1 indicate an excess of FD sites of a given type within the set of binding sites over the random expectation, whereas values of <<1 indicate a depletion of FD sites amongst binding sites.
RESULTS AND DISCUSSION
Phylogenetic analyses
In our phylogenetic analyses, each of the four protein families (i.e. aEF-1α, eEF-1α, HBS1CTD and eRF3CTD) formed clades, albeit with relatively low bootstrap percent support (BP) values of 57 and 65% for the aEF-1α and HBS1CTD clades, respectively (Fig. 1A). This tree topology indicates that HBS1 and eRF3 were established prior to the divergence of extant eukaryotic lineages. Our analyses also suggest that HBS1 and eRF3 derive from a more recent common ancestor, since the two EF-1α paralogs form a clade to the exclusion of EF-1α sequences in the phylogenetic tree with BP = 100% (Fig. 1A). Supporting their close relationship, both HBS1 and eRF3 have similar domain structures in general—a hyper-variable domain in their N-termini and a conserved (EF-1α-like) domain in their C-termini (17)—that may have been established in their common ancestor. If so, then the eRF3 proteins of Giardia and Encephalitozoon cuniculi (a microsporidian), which have only the EF-1α-like domain (17,40), most probably lost the N-terminal domain secondarily. We suggest that the ancestral protein might have had an eRF3-like function, because eRF3 is indispensable in yeast and performs an essential function in translation, while HBS1 does not (24).
Figure 1.

Phylogenetic analyses. (A) Relationship among aEF-1α, eEF-1α, eRF3CTD and HBS1CTD. The open diamond indicates the probable root of the tree. All EF-1α sequence names are omitted. BP values are shown next to major branches. (B) An EF-1β phylogenetic tree. All EF-1β sequence names are omitted except those determined in this study. A BP value for the Eukaryota–Archaebacteria split is shown. Novel sequences determined in this study are indicated by asterisks.
The EF-1β sequences from archaebacteria and eukaryotes were separated by a long internal branch with BP = 100% (Fig. 1B). The EF-1β sequences from Spironucleus were nested within the eukaryotic sequences (Fig. 1B). Trichomonas EF-1β branched, albeit with poor support (BP < 50%, data not shown), in the deepest position in the eEF-1β sub-tree (Fig. 1B).
Functional divergence between the EF-1α orthologs
Parametric bootstrap tests detected significant differences in the overall rate distributions of eEF-1α and aEF-1α (Fig. 2A), even though both protein families have the same primary function. Similarly, the null hypothesis of a common rate distribution for the EF-1α orthologs is rejected using the orthogonal regression test (P < 0.0001). The rate distance calculation without absolute values (brsum) strongly suggests that, overall, the site-rates of aEF-1α are systematically higher than those of eEF-1α, because the observed value falls on the negative side of the null distribution (Fig. 2B). This may reflect a number of additional auxiliary functions carried out by eEF-1α (14,15) that are likely to be absent in archaebacterial orthologs.
Figure 2.

Parametric bootstrap tests for the rate distance across two sub-trees. The histograms indicate the parametric bootstrap null distributions of the absolute-value or non-absolute-value rate distances (abrsum or brsum) between eEF-1α and aEF-1α (abbreviated as Eα vs. Aα) (A and B), between eEF-1β and aEF-1β (Eβ vs. Aβ) (C and D), between eEF-1α and HBS1CTD (Eα vs. H) (E and F) and between eEF-1α and eRF3CTD (Eα vs. R) (G and H), respectively. The observed values are indicated by arrows.
The numbers of FD sites detected between eEF-1α and aEF-1α are summarized in Table 2 (see supporting information). These FD sites between the EF-1α orthologs were mapped on the yeast EF-1α tertiary structure (Fig. 3, top). A statistical test implemented in covARES v.0.9 (13) failed to detect significant spatial clustering of any of the RS+, RS– or type II FD sites in the 3D structure (data not shown).
Table 2. Numbers of FD sites detected across two sub-trees.
| eEF-1α versus aEF-1α | eEF-1α versus HBS1 | eEF-1α versus eRF3 | eEF-1β versus aEF-1β | ||||||
|---|---|---|---|---|---|---|---|---|---|
| Type Ia | RS+ | 12 | [0] | 17 | [11] | 21 | [11] | 0 | [0] |
| RS– | 47 | [10] | 24 | [2] | 31 | [2] | 6 | [1] | |
| Type II | DEb | 13 | [10] | 30 | [13] | 31 | [14] | 2 | [1] |
| ADEc | 3 | [0] | 0 | [0] | 3 | [2] | 0 | [0] | |
| ΔCPsd | 2 | [1] | 9 | [4] | 10 | [5] | 0 | [0] | |
aNumbers of type I FD sites overlapping with any type II FD sites are given in brackets.
bNumbers of DE sites overlapping with type I FD sites are given in brackets.
cNumbers of ADE sites overlapping with ΔCPs sites are given in brackets.
dNumbers of ΔCPs sites overlapping with any other FD sites are given in brackets.
Figure 3.

Stereo views of the tertiary structure of yeast EF-1α·EF-1β·GDP indicating the location of FD sites. The yeast EF-1α·EF-1β·GDP structure (PDB file 1IJF) is presented with the FD sites detected (top) between eEF-1α and aEF-1α, (middle) between eEF-1α and HBS1CTD and (bottom) between eEF-1α and eRF3CTD. The structures of yeast EF-1α and EF-1β are shown by tube representation in gold and silver, respectively, and the GDP molecule is shown in yellow. Positions of RS+ and RS– (type I FD) sites are emphasized in white and red, respectively. Positions with large blue shells are DE, ADE or ΔCPs (type II FD) sites. Type I FD sites that are also type II FD sites have larger white or red shells.
χ2 test for correlations between the location of FD sites between eEF-1α and aEF-1α and the location of probable aa-tRNA binding or EF-1β binding sites in these molecules were performed. Only the null hypothesis of independence between the type II FD sites and the putative aa-tRNA binding sites was rejected at the 1% α level (P = 3.68 × 10⁻³; Table 3), with these FD sites noticeably overlapping with the binding sites (estimated proportion ratio values = 5.58; Table 3). However, marginally significant (P < 0.05) overlaps between (i) the RS– sites and the putative aa-tRNA binding and EF-1β binding sites and (ii) the type II FD sites and the putative EF-1β binding sites were observed (estimated proportion ratio values >1; Table 3). These results indicate that some of the FD sites between eEF-1α and aEF-1α may be involved in somewhat different binding interactions with aa-tRNA and, to a lesser extent, EF-1β. In general, the correlation appears to be weaker for the type I sites relative to the type II sites, indicating that changes in the nature of evolutionary constraints related to the binding functions have occurred rather than loss or gain of constraints (as observed for the other comparisons—see below). In any case, the lack of a highly significant correlation for most of the comparisons between eEF-1α and aEF-1α (Table 3) indicates that, overall, the functional divergence between the EF-1α orthologs has little to do with their primary binding functions.
Table 3. P-values from χ2 test of independence and estimated proportion ratio values between FD sites and the putative binding sites in EF-1α.
| Putative EF-1β binding sites | Putative aa-tRNA binding sites | |||||
|---|---|---|---|---|---|---|
| Comparison (eEF-1α versus) | aEF-1α | HBS1 | eRF3 | aEF-1α | HBS1 | eRF3 |
| Type I, RS+ | 0.209 | 0.0690 | 0.0360a | 0.646 | 0.191 | 0.270 |
| (0.00) | (0.00) | (0.00) | (1.868) | (0.280) | (0.560) | |
| Type I, RS– | 0.0152a | 4.84E-05b | 7.71E-04b | 0.0498a | 2.38E-07b | 2.56E-04b |
| (1.22) | (6.52) | (4.27) | (1.22) | (8.38) | (4.88) | |
| Type II | 0.0135a | 6.03E-07b | 2.07E-07b | 3.68E-03b | 3.81E-08b | 3.96E-06b |
| (4.65) | (2.55) | (2.35) | (5.58) | (2.94) | (2.35) | |
Estimated proportion ratio values are given in parentheses.
aThe null hypothesis is rejected at a 5% α level.
bThe null hypothesis is rejected at a 1% α level.
The distribution of functionally divergent sites between the EF-1α orthologs across the surface/interior of the molecule
Eukaryotic EF-1α is known to interact with actin and tubulins (14,15), and these auxiliary functions should be absent in aEF-1α since the archaebacteria lack these cytoskeletal proteins. The associated sites are therefore likely to be under fewer constraints in archaebacteria and are expected to be represented amongst the RS– or type II FD sites. Furthermore, as they are involved in protein–protein interactions, the cytoskeletal protein binding sites should be preferentially located at the surface of EF-1α. To determine the locations of FD sites relative to the surface, their NSA values were calculated and the distribution of these values was compared to the distribution of NSA values for the full protein data set (NSA values indicate the degree to which sites are buried or surface exposed). Unexpectedly, wide ranges of NSA values were observed for the RS– and type II FD sites with medians similar to all sites analyzed in this study (Fig. 4) indicating that they are distributed relatively uniformly between the surface and interior of the protein. Several explanations for these observations are possible. The actin/tubulin binding residues may not be present in the set of detected FD sites because their divergence pattern was not ‘strong’ enough to be detected by our methods, or because they are constrained in aEF-1α for other reasons (i.e. the residues could have multiple constraints on their identity in eukaryotes). Alternatively, the putative actin/tubulin binding sites may be included in the subset of RS– and/or type II FD sites with large NSA values, but their ‘signal’ may be swamped by the majority of RS– and/or type II FD sites that are not directly involved in surface interactions (Fig. 4).
Figure 4.

Plots of NSA values. The plot for the 269 sites analyzed in this study is given as ‘All (269 sites)’. The dotted line represents the median of the NSA values from all analyzed (269) sites. Arrows indicate the medians of each plot. Eα vs. Aα, the FD sites between eEF-1α and aEF-1α; Eα vs. H, the FD sites between eEF-1α and HBS1CTD; Eα vs. R, the FD sites between eEF-1α and eRF3CTD.
Although no auxiliary functions for EF-1α beyond its translation role have yet been reported in archaebacteria, it is possible that, like its eukaryotic ortholog, aEF-1α is a multifunctional protein that binds unique molecular partners in archaebacterial cells. Surprisingly, this is tentatively suggested by the distribution of RS+ sites for the eEF-1α and aEF-1α comparisons. These RS+ sites have relatively large NSA values with the median NSA values of the distribution greater than that of the overall distribution (Fig. 4), suggesting that the majority of the RS+ sites are exposed on the protein surface. Site-directed mutagenesis experiments that target the RS+ sites in aEF-1α homologs could be used in future to test if they are involved in unique molecular interactions within archaebacteria.
Functional divergence between the EF-1β orthologs
We also compared the difference in the evolutionary modes of eEF-1β and aEF-1β. The null hypothesis of no overall rate distribution shifts between the two orthologs was rejected by both the parametric bootstrap test using the abrsum calculation (Fig. 2C) and the orthogonal regression test (P < 0.0001). No systematic overall rate increase or decrease is evident across the two EF-1β sub-trees (Fig. 2D). The numbers of the FD sites detected between eEF-1β and aEF-1β are listed in Table 2.
Our analyses of the FD sites detected between the EF-1β orthologs revealed that they localized to two ‘patches’ on the yeast EF-1α·EF-1β·GDP complex (Fig. 5). One is a cluster of three FD sites that correspond to Lys1144, Thr1152 and Trp1153 in yeast EF-1β (residue numberings are as per PDB file 1IJF). Likewise, two RS– sites (Leu1125 and Leu1168 in yeast EF-1β) were found to be close in the EF-1β tertiary structure. The evolutionary modes of the sites within each patch are probably correlated with one another, but more sophisticated methods for detecting compensatory changes are needed to test this hypothesis. We found no FD sites between the EF-1α orthologs that are close (i.e. within 5 Å) to these patches of EF-1β FD sites in the yeast EF-1α·EF-1β structure.
Figure 5.
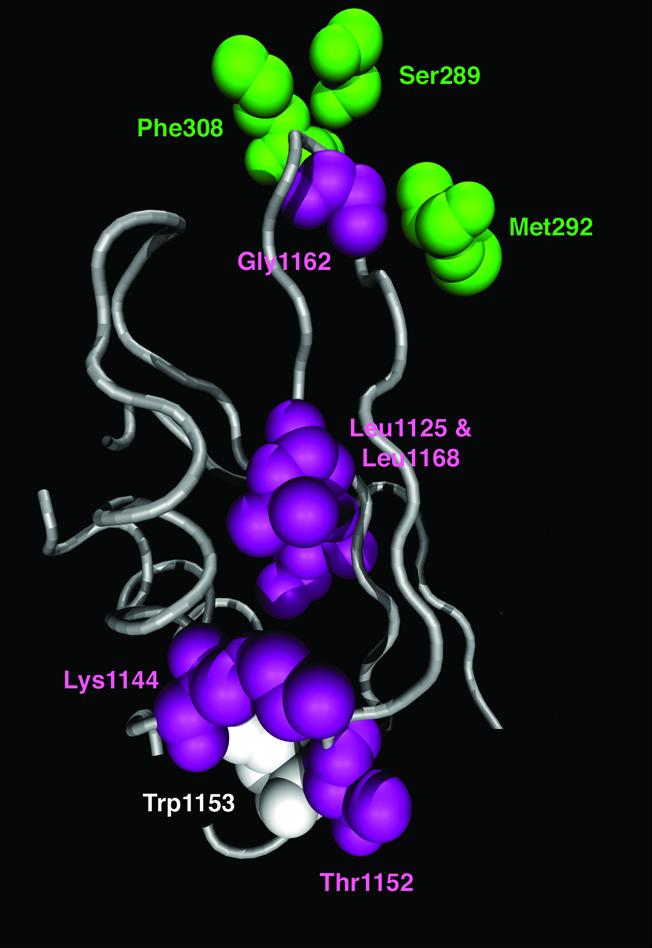
FD sites detected between the EF-1β orthologs. The RS– and DE sites detected between the EF-1β orthologs are shown in pink and white, respectively. The FD sites detected between the EF-1α orthologs, which are within ∼10 Å centroid-to-centroid distance from the EF-1β FD site (Gly1162 in yeast EF-1β) are presented in green. The residue numbers are based on PDB file 1IJF.
The RS– site that corresponds to Gly1162 in yeast EF-1β appears to be a ‘stand-alone’ FD site in the EF-1β structure. However, the loop in EF-1β including Gly1162 has been shown to interact intimately with β10 and β11 sheets in EF-1α domain 2 (33) (see also Fig. 6). Interestingly, three RS– sites detected between the EF-1α orthologs (corresponding to Ser289, Met292 and Phe308 in yeast EF-1α) are in contact with the EF-1α·EF-1β interface. Therefore, it is possible that the changes in site-rates at these sites are correlated across the subunits.
Figure 6.

Alignment of the β10 and β11 sheets in eEF-1α and the corresponding region in aEF-1α, HBS1CTD and eRF3CTD. The sites included in the analyses are marked by a ‘+’ in the top line. The putative EF-1β and aa-tRNA binding sites are marked by X in the second and third lines, respectively. Yeast EF-1α β10 and β11 sheets (PDB file 1IJF) are shown in boxes in the fourth line. Conserved amino acid residues are shaded.
Functional divergence between eEF-1α and its paralogs: HBS1 and eRF3
The overall changes in rate distributions between eEF-1α and HBS1CTD, and between eEF-1α and eRF3CTD were both significant (Fig. 2E and G). Orthogonal regression tests also rejected the null hypothesis of no significant rate distribution difference in the two comparisons (P < 0.0001). There is clearly an overall rate acceleration in HBS1CTD and eRF3CTD, relative to eEF-1α, since the observed brsum value fell the negative side of the bootstrap distribution (Fig. 2F and H). Therefore, differences clearly exist in the functional constraints of eEF-1α relative to its paralogs and the latter are, in general, less constrained overall.
We identified similar numbers of type I and type II FD sites between eEF-1α and its two paralogs (Table 2). Significant clustering in the tertiary structure was observed among RS– and among type II FD sites in the comparisons between eEF-1α and its paralogs, while no significant clustering of the RS+ sites was detected (data not shown). Interestingly, on the yeast EF-1α structure, most of the RS– sites and type II FD sites appear to be distributed only around the ‘saddle’ region, that is comprised of the interfaces of domains 1 and 2, and 1 and 3 (Fig. 3, middle and bottom). Tertiary structures of the yeast EF-1α·EF-1β·GDP (33,34) and Thermus EF-Tu·Phe-tRNAPhe· GMPPMP (38) indicate that this area intimately interacts with both EF-1β and aa-tRNA. In contrast to the RS– site, the RS+ sites are excluded from this area (Fig. 3, middle and bottom).
Our tests using χ2 statistics confirmed these observations: the null hypothesis of independence between the RS– sites and the putative EF-1β binding sites, and between the type II FD sites and the putative EF-1β binding sites was strongly rejected at a 1% α level (Table 3). The estimated proportion ratio values for these comparisons (shown in parentheses in Table 3) suggest that the RS–/type II sites and the putative EF-1β binding sites are positively correlated. On the other hand, independence of the RS+ sites and the putative EF-1β binding sites was not rejected at a 5% α level (Table 3). Similar results were obtained from the tests of the correlation between the FD sites and the putative aa-tRNA binding sites. Independence of the putative aa-tRNA binding sites and the RS+ sites was not rejected at the 1% α level, whereas it was strongly rejected for type II FD and RS– sites (P < 0.0001; Table 3).
Tertiary structural analyses show a concentration of the putative EF-1β and aa-tRNA binding sites in EF-1α β10 and β11 sheets (see supporting information). Although the corresponding region was excluded from our statistical analyses above because of difficulties in alignment, it is clear that this region is not well conserved in HBS1 and eRF3 (Fig. 6). These data suggest that the saddle regions of HBS1 and eRF3 have lowered functional constraints relative to the corresponding regions in EF-1α. On the basis of these analyses, we predict that the two EF-1α paralogs bind neither eEF-1β nor aa-tRNA.
GDP/GTP exchange mechanisms for the EF-1α paralogs
Both HBS1 and eRF3 have typical guanidine nucleotide binding motifs, and thus GTP hydrolysis and GDP/GTP exchange are probably essential for their cellular functions. In fact eRF3 has been shown to be an eRF1- and ribosome-dependent GTPase (41). However no GEF specific for either HBS1 or eRF3 has yet been discovered. Although our analyses suggest that eEF-1β would not bind to HBS1 or eRF3, it is possible that such subunits, if they exist, could bind to a different region on the surface of the EF-1α paralogs. In fact, EF-Ts in eubacteria (a functional counterpart of EF-1β) binds to EF-Tu on a different surface region to where EF-1β binds EF-1α (42,43). Interestingly, the RS+ sites detected between eEF-1α and its paralogs tend to be exposed on the protein surface (Fig. 4). Although significant clustering was not detected (data not shown), some of these sites in eRF3 and HBS1 may be involved in the interaction with their GEFs.
Another possibility is that HBS1 and eRF3 could recycle guanidine nucleotides alone without needing GEFs. This scenario seems less likely, since both HBS1 and eRF3 probably derive from eEF-1α (Fig. 1A), which is obligately dependent on a GEF. Further biochemical and genetic studies are required to understand the details of mechanisms of GDP/GTP exchange on HBS1 and eRF3. Minimally, our analyses predict that they will significantly differ from the EF-1β-based mechanism used by EF-1α.
Insights into the functions of eRF3
The ‘molecular mimicry’ hypothesis holds that the eRF1–eRF3CTD interaction mimics that of EF-1α·aa-tRNA (44–50). This prediction is consistent with the results from the studies of eRF1 and/or eRF3 deletion mutants (47,51–54). Nevertheless, the subunit interface predicted from this hypothesis seems poorly conserved amongst eukaryotes. Eukaryotic RF1 domain 3, which mimics the D and T arms of tRNA, has been shown to be least conserved among the three domains (55). Furthermore, the saddle region in eRF3 appears to be much less constrained than the corresponding region in eEF-1α (Fig. 3, bottom). Clearly, eRF1 domain 3 and the eRF3 saddle region must have undergone a rapid and intimate co-evolution in eukaryotes. That such rapid co-evolution can occur in this case, but not between tRNAs and eEF-1α, may be due to the much larger number of molecular partners that the latter two molecules must interact with, mandating a much higher degree of evolutionary conservation.
It has been reported that up-frameshift protein 1 (UPF1), UPF1-like helicase (MTT1) and PABP all bind eRF3 (21–23). While the details of the UPF1-eRF3 or MTT1-eRF3 binding have yet to be elucidated, some work has been done to clarify the interaction between PABP and eRF3 (21). Yeast two-hybrid analysis did not implicate eRF3CTD in a binding role, suggesting that perhaps the N-terminal domain may be involved in the binding interaction with PABP (21). However, it is unclear whether the interaction observed between mouse eRF3 and human PABP1, as assayed in the two-hybrid system, is applicable to eukaryotes in general, since the amino acids sequence and length of the eRF3 N-terminal domains are highly variable amongst eukaryotes. For instance, eRF3 proteins from two protists, Giardia and Encephalitozoon, retain only an EF-1α-like domain (17,40). Thus, if an eRF3–PABP interaction is essential to all eukaryotes, then it is probable that eRF3CTD is involved in the binding interaction to some degree. The sites responsible for those eRF3-specific molecular interactions may correspond to the RS+ sites (sites that have been evolving slower in eRF3 than in eEF-1α). It is interesting to note that the distribution of NSA values indicates that many of the RS+ sites between eEF-1α and eRF3 (RS+Eα–R) are located near the surface of the protein (Fig. 4). These may correspond to the sites involved in binding to UPF1, MTT1 and/or PABP.
Insights into the functions of HBS1
Cytosolic Hsp70 has been shown to associate with translating ribosomes, and it probably aids in the passage of nascent peptides through the ribosome channel (25). Compared to yeast wild-type cells, mutants lacking cytosolic Hsp70 (ssb1 ssb2) appear to have a reduced number of polysomes, possibly due to ribosomes stalled on mRNAs (25). Interestingly, the growth defect and the lowered amounts of polysomes in ssb1 ssb2 mutants were suppressed by increasing the copy number of the HBS1 gene (25). As a result, it was proposed that HBS1 could be a ‘hyper-efficient EF-1α’ enhancing translation by delivering aa-tRNAs to ribosomes more efficiently than ‘regular EF-1α’ (25). However, our data casts serious doubt on this hypothesis, since the significant divergence and high evolutionary rate of the HBS1 saddle region (corresponding to the EF-1β and tRNA-binding regions in EF-Tu/1α) indicates that it is unlikely to bind aa-tRNA (Fig. 3, middle). In addition, this hypothesis cannot rationalize the apparently deleterious effects of increasing the copy number of the HBS1 gene on yeast (25)—it is unclear how a gene with an EF-1α-like function could be harmful under these conditions.
We propose that HBS1 may be instead involved in a process that catalyzes stop codon-independent peptide release from stalled ribosomes. The suppression of the cytosolic Hsp70 defects by the plasmid-encoded HBS1 (25) would be consistent with our hypothesis: a protein complex including HBS1 could cure the ribosome stalling caused by lack of Hsp70-mediated nascent polypeptide channeling. Furthermore, this hypothetical activity of HBS1 could explain why it is dispensable under standard laboratory conditions (24)—stalled ribosomes may occur only under stress conditions. However, once HBS1 is over-expressed, peptides may be prematurely released from ribosomes, a situation that would be lethal. In addition to a hypothetical peptide release activity, HBS1 might have some eRF3-like translation termination activities, although there is some evidence that HBS1 does not bind eRF1 (16). It is also likely that HBS1 is involved in the nonsense mRNA decay system. These potential functions of HBS1 are circumstantially supported by its similarity to eRF3 in domain structure and its distribution of rates across sites (8).
Also, like eRF3, the RS+ sites between eEF-1α and HBS1 (RS+Eα–H) tend to be exposed on the molecular surface (Fig. 4). Since the RS+Eα–H sites evolve slower in HBS1 than in eEF-1α, these data imply molecular interactions present in HBS1 but absent in eEF-1α. While proteins or RNAs that bind to HBS1 have yet to be identified, we assume that HBS1 may function with other protein component(s), perhaps including those that bind to eRF3 as discussed above. Indeed, 17 of the 24 RS+Eα–H and the 34 RS+Eα–R sites overlap and the null hypothesis of independence between these sites is rejected by a χ2 test at an extreme significance level (P < 1.50 × 10⁻²¹). Thus, many sites appear to be highly constrained that are unique to eRF3 and HBS1. Delineating the functional significance of these sites in future will shed light on the mode of action of both these protein families.
CONCLUSIONS
As this and previous studies show (55–60), bioinformatic approaches incorporating tertiary structural information and phylogenetic parameters estimated from large alignments of protein families can play important roles in protein functional analyses. The rapid expansion of both protein sequence and structure databases increases the usefulness of these kinds of analyses, especially for protein families where experimental functional analyses are lacking. For protein subfamilies with unknown functions such as HBS1, the results from comparative in silico approaches may provide the first clues as to how functions of such proteins have been conserved or have changed relative to functionally characterized homologs. These analyses have the potential to greatly focus subsequent experimental studies using biochemical and/or genetic techniques to target a much smaller number of sites in a protein predicted to be functionally important. On the other hand, biochemical and genetic studies on proteins are usually performed only for model organisms. For proteins that have been studied in this way, bioinformatic approaches that consider massive sequence alignments will permit useful tests of whether knowledge of molecules from model organisms can be generalized to homologs from phylogenetically divergent taxa.
Supporting information
Supporting information is available on request to Y.I.
Acknowledgments
ACKNOWLEDGEMENTS
We thank C. Field, A. G. B. Simpson, J. O. Andersson and J. D. Silberman (Dalhousie University) for valuable discussions and critical reading of this manuscript. Novel sequences determined in this study were deposited in the DDBJ/EMBL/GenBank database under accession numbers AY185331– AY185338. Sequence data for C.albicans was obtained from the Stanford Genome Technology Center website at http://www-sequence.stanford.edu/group/candida. Sequencing of C.albicans was accomplished with the support of the NIDR and the Burroughs Wellcome Fund. Preliminary sequence data of T.parva was obtained from the TIGR website at http://www.tigr.org. Sequencing of T.parva was funded by the International Livestock Research Institute and The Institute for Genomic Research. The C.neoformans cDNA Sequencing Project is supported by a NIH-NIAID grant number AI147079. Y.I. is supported by a Genome Atlantic/Genome Canada large-scale project grant. C.B. is supported by a postdoctoral fellowship from NSERC. This work is supported by an operating grant 227085-00 from NSERC (awarded to A.J.R.). This collaboration is part of a Genome Atlantic/Genome Canada large-scale project.
DDBJ/EMBL/GenBank accession nos+ AY185331–AY185338
REFERENCES
- 1.Fitch W.M. and Markowitz,E. (1970) An improved method for determining codon variability in a gene and its application to the rate of fixation of mutations in evolution. Biochem. Genet., 4, 579–593. [DOI] [PubMed] [Google Scholar]
- 2.Galtier N. (2001) Maximum-likelihood phylogenetic analysis under a covarion-like model. Mol. Biol. Evol., 18, 866–873. [DOI] [PubMed] [Google Scholar]
- 3.Penny D. and Hasegawa,M. (2001) Covarion model of molecular evolution. In Brenner,S. and Miller,J.H. (eds), Encyclopedia of Genetics. Academic Press, San Diego, pp. 473–477.
- 4.Yang Z. (1996) Among-site rate variation and its impact on phylogenetic analyses. Trends Ecol. Evol., 11, 367–372. [DOI] [PubMed] [Google Scholar]
- 5.Huelsenbeck J.P. (2002) Testing a covariotide model of DNA substitution. Mol. Biol. Evol., 19, 698–707. [DOI] [PubMed] [Google Scholar]
- 6.Tuffley C. and Steel,M. (1998) Modeling the covarion hypothesis of nucleotide substitution. Math. Biosci., 147, 63–91. [DOI] [PubMed] [Google Scholar]
- 7.Penny D., McComish,B.J., Charleston,M.A. and Hendy,M.D. (2001) Mathematical elegance with biochemical realism: the covarion model of molecular evolution. J. Mol. Evol., 53, 711–723. [DOI] [PubMed] [Google Scholar]
- 8.Susko E., Inagaki,Y., Field,C., Holder,M.E. and Roger,A.J. (2002) Testing for differences in rates-across-sites distributions in phylogenetic subtrees. Mol. Biol. Evol., 19, 1514–1523. [DOI] [PubMed] [Google Scholar]
- 9.Gaucher E.A., Gu,X., Miyamoto,M.M. and Benner,S.A. (2002) Predicting functional divergence in protein evolution by site-specific rate shifts. Trends Biochem. Sci., 27, 315–321. [DOI] [PubMed] [Google Scholar]
- 10.Lopez P., Forterre,P. and Philippe,H. (1999) The root of the tree of life in the light of the covarion model. J. Mol. Evol., 49, 496–508. [DOI] [PubMed] [Google Scholar]
- 11.Pupko T. and Galtier,N. (2002) A covarion-based method for detecting molecular adaptation: application to the evolution of primate mitochondrial genomes. Proc. R. Soc. Lond. B Biol. Sci., 269, 1313–1316. [DOI] [PMC free article] [PubMed] [Google Scholar]
- 12.Gu X. (2001) Maximum-likelihood approach for gene family evolution under functional divergence. Mol. Biol. Evol., 18, 453–464. [DOI] [PubMed] [Google Scholar]
- 13.Blouin C., Boucher,Y. and Roger,A.J. (2002) Inferring functional constraints and divergence of protein families using 3D mapping of phylogenetic information. Nucleic Acids Res., 31, 790–797. [DOI] [PMC free article] [PubMed] [Google Scholar]
- 14.Krab I.M. and Parmeggiani,A. (1998) EF-Tu, a GTPase odyssey. Biochim. Biophys Acta, 1443, 1–22. [DOI] [PubMed] [Google Scholar]
- 15.Negrutskii B.S. and El’skaya,A.V. (1998) Eukaryotic translation elongation factor 1α: structure, expression, functions and possible role in aminoacyl-tRNA channeling. Prog. Nucleic Acid Res. Mol. Biol., 60, 47–78. [DOI] [PubMed] [Google Scholar]
- 16.Wallrapp C., Verrier,S.B., Zhouravleva,G., Philippe,H., Philippe,M., Gress,T.M. and Jean-Jean,O. (1998) The product of the mammalian orthologue of the Saccharomyces cerevisiae HBS1 gene is phylogenetically related to eukaryotic release factor 3 (eRF3) but does not carry eRF3-like activity. FEBS Lett., 440, 387–392. [DOI] [PubMed] [Google Scholar]
- 17.Inagaki Y. and Doolittle,W.F. (2000) Evolution of the eukaryotic translation termination system: origins of release factors. Mol. Biol. Evol., 17, 882–889. [DOI] [PubMed] [Google Scholar]
- 18.Ter-Avanesyan M.D., Kushnirov,V.V., Dagkesamanskaya,A.R., Didichenko,S.A., Chernoff,Y.O., Inge-Vechtomov,S.G. and Smirnov,V.N. (1993) Deletion analysis of the SUP35 gene of the yeast Saccharomyces cerevisiae reveals two non-overlapping functional regions in the encoded protein. Mol. Microbiol., 7, 683–692. [DOI] [PubMed] [Google Scholar]
- 19.Stansfield I., Jones,K.M., Kushnirov,V.V., Dagkesamanskaya,A.R., Poznyakovski,A.I., Paushkin,S.V., Nierras,C.R., Cox,B.S., Ter-Avanesyan,M.D. and Tuite,M.F. (1995) The products of the SUP45 (eRF1) and SUP35 genes interact to mediate translation termination in Saccharomyces cerevisiae. EMBO J., 14, 4365–4373. [DOI] [PMC free article] [PubMed] [Google Scholar]
- 20.Zhouravleva G., Frolova,L., Le Goff,X., Le Guellec,R., Inge-Vechtomov,S., Kisselev,L. and Philippe,M. (1995) Termination of translation in eukaryotes is governed by two interacting polypeptide chain release factors, eRF1 and eRF3. EMBO J., 14, 4065–4072. [DOI] [PMC free article] [PubMed] [Google Scholar]
- 21.Hoshino S., Imai,M., Kobayashi,T., Uchida,N. and Katada,T. (1999) The eukaryotic polypeptide chain releasing factor (eRF3/GSPT) carrying the translation termination signal to the 3′-poly(A) tail of mRNA. Direct association of eRF3/GSPT with polyadenylate-binding protein. J. Biol. Chem., 274, 16677–16680. [DOI] [PubMed] [Google Scholar]
- 22.Czaplinski K., Ruiz-Echevarria,M.J., Paushkin,S.V., Han,X., Weng,Y., Perlick,H.A., Dietz,H.C., Ter-Avanesyan,M.D. and Peltz,S.W. (1998) The surveillance complex interacts with the translation release factors to enhance termination and degrade aberrant mRNAs. Genes Dev., 12, 1665–1677. [DOI] [PMC free article] [PubMed] [Google Scholar]
- 23.Czaplinski K., Majlesi,N., Banerjee,T. and Peltz,S.W. (2000) Mtt1 is a Upf1-like helicase that interacts with the translation termination factors and whose overexpression can modulate termination efficiency. RNA, 6, 730–743. [DOI] [PMC free article] [PubMed] [Google Scholar]
- 24.Winzeler E.A., Shoemaker,D.D., Astromoff,A., Liang,H., Anderson,K., Andre,B., Bangham,R., Benito,R., Boeke,J.D., Bussey,H. et al. (1999) Functional characterization of the S. cerevisiae genome by gene deletion and parallel analysis. Science, 285, 901–906. [DOI] [PubMed] [Google Scholar]
- 25.Nelson R.J., Ziegelhoffer,T., Nicolet,C., Werner-Washburne,M. and Craig,E.A. (1992) The translation machinery and 70 kd heat shock protein cooperate in protein synthesis. Cell, 71, 97–105. [DOI] [PubMed] [Google Scholar]
- 26.Morio T., Urushihara,H., Saito,T., Ugawa,Y., Mizuno,H., Yoshida,M., Yoshino,R., Mitra,B.N., Pi,M., Sato,T. et al. (1998) The Dictyostelium developmental cDNA project: generation and analysis of expressed sequence tags from the first-finger stage of development. DNA Res., 5, 335–340. [DOI] [PubMed] [Google Scholar]
- 27.McArthur A.G., Morrison,H.G., Nixon,J.E., Passamaneck,N.Q., Kim,U., Hinkle,G., Crocker,M.K., Holder,M.E., Farr,R., Reich,C.I. et al. (2000) The Giardia genome project database. FEMS Microbiol. Lett., 189, 271–273. [DOI] [PubMed] [Google Scholar]
- 28.Strimmer K. and von Haeseler,A. (1996) Quartet puzzling: a quartet maximum likelihood method for reconstructing tree topologies. Mol. Biol. Evol., 13, 964–969. [Google Scholar]
- 29.Felsenstein J. (1993) Phylogeny inference package (version 3.2). Cladistics, 5, 166. [Google Scholar]
- 30.Thompson J.D., Higgins,D.G. and Gibson,T.J. (1994) CLUSTAL W: improving the sensitivity of progressive multiple sequence alignment through sequence weighting, position-specific gap penalties and weight matrix choice. Nucleic Acids Res., 22, 4673–4680. [DOI] [PMC free article] [PubMed] [Google Scholar]
- 31.Grassly N.C., Adachi,J. and Rambaut,A. (1997) PSeq-Gen: an application for the Monte Carlo simulation of protein sequence evolution along phylogenetic trees. Comput. Appl. Biosci., 13, 559–560. [DOI] [PubMed] [Google Scholar]
- 32.Humphrey W., Dalke,A. and Schulten,K. (1996) VMD: visual molecular dynamics. J. Mol. Graph., 14, 33–38, 27–38. [DOI] [PubMed] [Google Scholar]
- 33.Andersen G.R., Pedersen,L., Valente,L., Chatterjee,I., Kinzy,T.G., Kjeldgaard,M. and Nyborg,J. (2000) Structural basis for nucleotide exchange and competition with tRNA in the yeast elongation factor complex eEF1A:eEF1Bα. Mol. Cell, 6, 1261–1266. [DOI] [PubMed] [Google Scholar]
- 34.Andersen G.R., Valente,L., Pedersen,L., Kinzy,T.G. and Nyborg,J. (2001) Crystal structures of nucleotide exchange intermediates in the eEF1A:eEF1Bα complex. Nature Struct. Biol., 8, 531–534. [DOI] [PubMed] [Google Scholar]
- 35.Vitagliano L., Masullo,M., Sica,F., Zagari,A. and Bocchini,V. (2001) The crystal structure of Sulfolobus solfataricus elongation factor 1α in complex with GDP reveals novel features in nucleotide binding and exchange. EMBO J., 20, 5305–5311. [DOI] [PMC free article] [PubMed] [Google Scholar]
- 36.Perez J.M., Siegal,G., Kriek,J., Hard,K., Dijk,J., Canters,G.W. and Moller,W. (1999) The solution structure of the guanine nucleotide exchange domain of human elongation factor 1β reveals a striking resemblance to that of EF-Ts from Escherichia coli. Struct. Fold. Des., 7, 217–226. [DOI] [PubMed] [Google Scholar]
- 37.Kozlov G., Ekiel,I., Beglova,N., Yee,A., Dharamsi,A., Engel,A., Siddiqui,N., Nong,A. and Gehring,K. (2000) Rapid fold and structure determination of the archaeal translation elongation factor 1β from Methanobacterium thermoautotrophicum. J. Biomol. NMR, 17, 187–194. [DOI] [PubMed] [Google Scholar]
- 38.Nissen P., Kjeldgaard,M., Thirup,S., Polekhina,G., Reshetnikova,L., Clark,B.F. and Nyborg,J. (1995) Crystal structure of the ternary complex of Phe-tRNAPhe, EF-Tu and a GTP analog. Science, 270, 1464–1472. [DOI] [PubMed] [Google Scholar]
- 39.Lo Conte L. and Smith,T.F. (1997) Visible volume: a robust measure for protein structure characterization. J. Mol. Biol., 273, 338–348. [DOI] [PubMed] [Google Scholar]
- 40.Katinka M.D., Duprat,S., Cornillot,E., Metenier,G., Thomarat,F., Prensier,G., Barbe,V., Peyretaillade,E., Brottier,P., Wincker,P. et al. (2001) Genome sequence and gene compaction of the eukaryote parasite Encephalitozoon cuniculi. Nature, 414, 450–453. [DOI] [PubMed] [Google Scholar]
- 41.Frolova L., Le Goff,X., Zhouravleva,G., Davydova,E., Philippe,M. and Kisselev,L. (1996) Eukaryotic polypeptide chain release factor eRF3 is an eRF1- and ribosome-dependent guanosine triphosphatase. RNA, 2, 334–341. [PMC free article] [PubMed] [Google Scholar]
- 42.Kawashima T., Berthet-Colominas,C., Wulff,M., Cusack,S. and Leberman,R. (1996) The structure of the Escherichia coli EF-Tu·EF-Ts complex at 2.5 Å resolution. Nature, 379, 511–518. [DOI] [PubMed] [Google Scholar]
- 43.Wang Y., Jiang,Y., Meyering-Voss,M., Sprinzl,M. and Sigler,P.B. (1997) Crystal structure of the EF-Tu·EF-Ts complex from Thermus thermophilus. Nature Struct. Biol., 4, 650–656. [DOI] [PubMed] [Google Scholar]
- 44.Bertram G., Innes,S., Minella,O., Richardson,J. and Stansfield,I. (2001) Endless possibilities: translation termination and stop codon recognition. Microbiology, 147, 255–269. [DOI] [PubMed] [Google Scholar]
- 45.Ito K., Ebihara,K., Uno,M. and Nakamura,Y. (1996) Conserved motifs in prokaryotic and eukaryotic polypeptide release factors: tRNA-protein mimicry hypothesis. Proc. Natl Acad. Sci. USA, 93, 5443–5448. [DOI] [PMC free article] [PubMed] [Google Scholar]
- 46.Nakamura Y. and Ito,K. (1998) How protein reads the stop codon and terminates translation. Genes Cells, 3, 265–278. [DOI] [PubMed] [Google Scholar]
- 47.Ebihara K. and Nakamura,Y. (1999) C-terminal interaction of translational release factors eRF1 and eRF3 of fission yeast: G-domain uncoupled binding and the role of conserved amino acids. RNA, 5, 739–750. [DOI] [PMC free article] [PubMed] [Google Scholar]
- 48.Poole E. and Tate,W. (2000) Release factors and their role as decoding proteins: specificity and fidelity for termination of protein synthesis. Biochim. Biophys Acta, 1493, 1–11. [DOI] [PubMed] [Google Scholar]
- 49.Song H., Mugnier,P., Das,A.K., Webb,H.M., Evans,D.R., Tuite,M.F., Hemmings,B.A. and Barford,D. (2000) The crystal structure of human eukaryotic release factor eRF1—mechanism of stop codon recognition and peptidyl-tRNA hydrolysis. Cell, 100, 311–321. [DOI] [PubMed] [Google Scholar]
- 50.Nakamura Y. (2001) Molecular mimicry between protein and tRNA. J. Mol. Evol., 53, 282–289. [DOI] [PubMed] [Google Scholar]
- 51.Ito K., Ebihara,K. and Nakamura,Y. (1998) The stretch of C-terminal acidic amino acids of translational release factor eRF1 is a primary binding site for eRF3 of fission yeast. RNA, 4, 958–972. [DOI] [PMC free article] [PubMed] [Google Scholar]
- 52.Merkulova T.I., Frolova,L.Y., Lazar,M., Camonis,J. and Kisselev,L.L. (1999) C-terminal domains of human translation termination factors eRF1 and eRF3 mediate their in vivo interaction. FEBS Lett., 443, 41–47. [DOI] [PubMed] [Google Scholar]
- 53.Eurwilaichitr L., Graves,F.M., Stansfield,I. and Tuite,M.F. (1999) The C-terminus of eRF1 defines a functionally important domain for translation termination in Saccharomyces cerevisiae. Mol. Microbiol., 32, 485–496. [DOI] [PubMed] [Google Scholar]
- 54.Frolova L.Y., Merkulova,T.I. and Kisselev,L.L. (2000) Translation termination in eukaryotes: polypeptide release factor eRF1 is composed of functionally and structurally distinct domains. RNA, 6, 381–390. [DOI] [PMC free article] [PubMed] [Google Scholar]
- 55.Inagaki Y. and Doolittle,W.F. (2001) Class I release factors in ciliates with variant genetic codes. Nucleic Acids Res., 29, 921–927. [DOI] [PMC free article] [PubMed] [Google Scholar]
- 56.Inagaki Y., Blouin,C., Doolittle,W.F. and Roger,A.J. (2002) Convergence and constraint in eukaryotic release factor 1 (eRF1) domain 1: the evolution of stop codon specificity. Nucleic Acids Res., 30, 532–544. [DOI] [PMC free article] [PubMed] [Google Scholar]
- 57.Gaucher E.A., Miyamoto,M.M. and Benner,S.A. (2001) Function-structure analysis of proteins using covarion-based evolutionary approaches: elongation factors. Proc. Natl Acad. Sci. USA, 98, 548–552. [DOI] [PMC free article] [PubMed] [Google Scholar]
- 58.Gaucher E.A., Das,U.K., Miyamoto,M.M. and Benner,S.A. (2002) The crystal structure of eEF1A refines the functional predictions of an evolutionary analysis of rate changes among elongation factors. Mol. Biol. Evol., 19, 569–573. [DOI] [PubMed] [Google Scholar]
- 59.Simon A.L., Stone,E.A. and Sidow,A. (2002) Inference of functional regions in proteins by quantification of evolutionary constraints. Proc. Natl Acad. Sci. USA, 99, 2912–2917. [DOI] [PMC free article] [PubMed] [Google Scholar]
- 60.Sun H., Merugu,S., Gu,X., Kang,Y.Y., Dickinson,D.P., Callaerts,P. and Li,W.H. (2002) Identification of essential amino acid changes in paired domain evolution using a novel combination of evolutionary analysis and in vitro and in vivo studies. Mol. Biol. Evol., 19, 1490–1500. [DOI] [PubMed] [Google Scholar]