Abstract
Filarial infections evoke exuberant inflammatory responses in the peritoneal cavities of immunocompetent mice. Clearance of infection appears to be dependent on complex interactions between B1 and B2 B lymphocytes, T cells, eosinophils, macrophages, and the products of these cells. In an earlier communication, we described the course of infection in normal immunocompetent mice. In this study, we utilize mice with well-characterized mutations that disable one or more effector components of adaptive immunity in order to determine their roles in host protection. We characterize peritoneal exudate cells by flow cytometry and determine the kinetics of accumulation of each of the different cell types following infection with Brugia pahangi. We find that (i) four-color flow-cytometric analysis of peritoneal exudate cells using anti-CD3, -CD11b, -CD19, and -Gr1 can distinguish up to six different populations of cells; (ii) an initial influx of neutrophils occurs within 24 h of infection, independent of the adaptive immune status of mice, and these cells disappear by day 3; (iii) an early influx of eosinophils is seen at the site of infection in all strains studied, but a larger, second wave occurs only in mice with T cells; (iv) the presence of T cells and eosinophils is important in causing an increase in macrophage size during the course of infection; and (v) most unexpectedly, T-cell recruitment appears to be optimal only if B cells are present, since JHD mice recruit significantly fewer T cells to the site of infection.
Mammalian immune responses are remarkably different for different classes of infectious agents. The ensuing inflammatory reaction takes shape with differential recruitment of a variety of cells of the adaptive and innate immune systems. Microorganisms (bacteria and viruses) may be effectively combated by mechanisms such as phagocytosis, neutralization by antibodies, and elimination of infected cells by cytotoxicity. The rules that govern the orchestration of the immune response to and the elimination of large multicellular parasites remain largely unknown. While parasites such as gastrointestinal nematodes can be expelled alive from the body by various mechanisms (5, 6), tissue-dwelling parasites such as filarial nematodes need to be immobilized, sequestered, killed, and disposed of to achieve complete clearance.
Filarial parasites are large, metazoan, tissue-dwelling organisms that cause diseases such as lymphatic filariasis, which afflicts over 120 million people in the world (14). Over the past several years, we have used murine models to understand the factors that contribute to host defense. Infection with the feline filarial parasite Brugia pahangi in the peritoneal cavities of laboratory mice evokes an inflammatory reaction. In a recent publication (17), Rajan et al. detailed the time course of Brugia infection in normal, immunocompetent mice and the cellular responses in the peritoneal cavities of these mice. The intent was to use these data to begin to analyze the deviations from such normalcy in mice with mutations in genes that control various aspects of the immune response, with the hope that these deviations will help us understand the normal process. We and others have earlier shown that mice that lack T lymphocytes (1, 2, 24), B lymphocytes (15, 18), or both (13) are all permissive for infection, in contrast to normal immunocompetent mice. In this communication, we describe the early immune responses to filarial infection in these mice and contrast them with that in normal mice. Our study points out that, while the ultimate phenotypes of these mutant mice are similar (i.e., they are all more permissive than immunocompetent mice), there may be differences in the mechanisms that underlie the manifestation of these phenotypes.
MATERIALS AND METHODS
Mice.
C57BL/6 (B6+/+) and B6.CB17-Prkdcscid/SzJ (SCID) mice were obtained from the Jackson Laboratory (Bar Harbor, Maine). C57BL/6-Il5tm1kopf (interleukin-5−/− [IL-5−/−]) (9), B6.JHD (JHD), and B6.129P2-Tcrbtm1MomTcrdtm1Mom (T-cell receptor βδ−/− [TCRβδ−/−]) mice were initially obtained from the Jackson Laboratory and were subsequently bred and housed at the University of Connecticut Health Center. IL-5 transgenic (IL-5Tg) (NJ.1726) (10) mice were obtained from James Lee (Mayo Clinic, Scottsdale, Ariz.) and were subsequently bred at our facility. All mice were maintained under specific-pathogen-free conditions in microisolator cages in the American Association for the Accreditation of Laboratory Animal Care-accredited vivarium of the health center. All mice used were males between 6 and 12 weeks of age. Mice were permitted laboratory chow and sterile water ad libitum. Confirmation of the genotype of the IL-5−/− mice was accomplished by PCR analysis of tail DNA of randomly selected mice using primers specific for the neomycin resistance gene and the interrupted exon of the IL-5 gene. Confirmation of all other genotypes was accomplished through fluorescence-activated cell sorter (FACS) analysis.
All protocols involving animal use were reviewed by the institutional animal welfare committee. We adhered strictly to their recommendations.
Infectious larvae.
B. pahangi L3 organisms were harvested at the insectarium of TRS Inc., Athens, Ga., or the University of Georgia from infected Aedes aegypti mosquitoes and shipped in Ham's complete medium as described previously (26).
Experimental infection
Mice were injected with 50 B. pahangi L3 organisms intraperitoneally in 500 μl of RPMI medium with 5/8-in 25-gauge needles.
Peritoneal exudate cells (PECs).
Mice were sacrificed at various time points postinfection and subjected to transthoracic cardiac bleeds for collection of serum, as well as blanching of the mesenteric vasculature, thereby minimizing blood contamination of the lavage. Peritoneal lavages were performed with ice-cold RPMI medium supplemented with 5 U of heparin per ml. Lavage fluid was passed through a 100-μm-pore-size nylon mesh and collected in 15-ml polystyrene tubes.
Cell counting and peroxidase staining.
The total number of peritoneal exudate cells in each mouse was determined by using the Advia 120 hematology system (Bayer Diagnostic Division, Tarrytown, N.Y.) with version 2.2.06-MS software.
Flow cytometry.
PECs recovered after lavage were stained with conjugated monoclonal antibodies (CD19-phycoerythrin, CD3-CyChrome, Ly6G-fluorescein isothiocyanate, and CD11b-allophycocyanin) from BD Pharmingen (San Diego, Calif.). Cells were washed in FACS buffer (phosphate-buffered saline with 0.2% bovine serum albumin) before incubation with Fc Block (BD Pharmingen) at a dilution of 1:50 for 10 min. Cells were fixed with 0.5% paraformaldehyde and acquired on a FACSCalibur (Becton Dickinson). Data were subsequently analyzed with FlowJo (version 4.2; TreeStar Inc., San Carlos, Calif.).
Cell sorting.
Eosinophils were purified with a magnetic cell sorting (MACS) LD column (Miltenyi Biotec, Auburn, Calif.) from infected IL-5Tg mice in accordance with the manufacturer's recommendations. PECs were incubated with anti-CD90, -CD19, and -CD11b MACS antibodies before passing through the columns. The flowthrough obtained was >95% eosinophils, as analyzed with the Advia 120 system for peroxidase staining.
RESULTS
Accumulation of cells in the peritoneal cavity following infection.
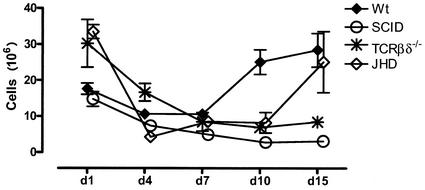
Normal mice accumulate significant numbers of cells in the peritoneal cavity following infection. These data are shown in Fig. 1. There are approximately 3 × 10⁶ to 4 × 10⁶ cells in the peritoneal cavities of resting mice (data not shown). This number rises substantially the first day following infection and declines slightly on day 3, before rising again over the next several days. By day 7, the cell numbers are in the 10 × 106 to 15 × 106 range and rise further to approximately 30 × 106 cells by day 15.
FIG. 1.
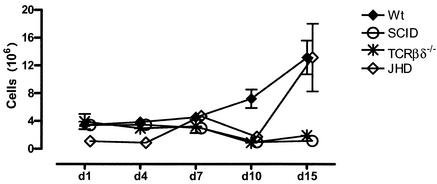
Kinetics of cell accumulation in the peritoneal cavity. Cohorts of C57BL/6 (Wt), SCID, T-cell-deficient (TCRβδ−/−), and B-cell-deficient (JHD) mice (three to five mice per group) were infected with B. pahangi and sacrificed on days 1, 4, 7, 10, and 15 postinfection Total cell numbers were obtained from the Advia 120 hematology system. Error bars represent standard errors of the means.
Despite the fact that a majority of cells at the height of the inflammatory response belong to the innate immune system, it is clear that the adaptive immune response is required. This is best demonstrated by monitoring the cell influx in SCID mice, which lack both T and B lymphocytes (Fig. 1). While there is an influx of cells on day 1, PEC numbers decline by day 3. Little, if any, further addition of cells is seen in these mice. The accumulation of cells in TCRβδ−/− mice follows similar kinetics. Thus, it appears that T cells are required for the secondary influx of cells into the peritoneal cavity following Brugia infection. Mice that lack B lymphocytes appear to fall into an intermediate pattern, with an influx that is retarded for the first several days but that accelerates substantially toward the end of the analysis (15 days). The cell numbers on day 15 are intermediate between those in wild-type mice and TCRβδ−/− and SCID mice.
Distribution of cell types in the peritoneal cavity. (i) Identification of individual cell types.
In a previous communication, we had used forward and side scatter data to identify individual cell types (17). We have since used a variety of cell markers to further refine these identifications and to make the interpretation of the data more reliable and robust. The logical flow of our analyses is indicated in Fig. 2 and 3. A preliminary walk through the logic will make the subsequent description of the data more intelligible.
FIG. 2.
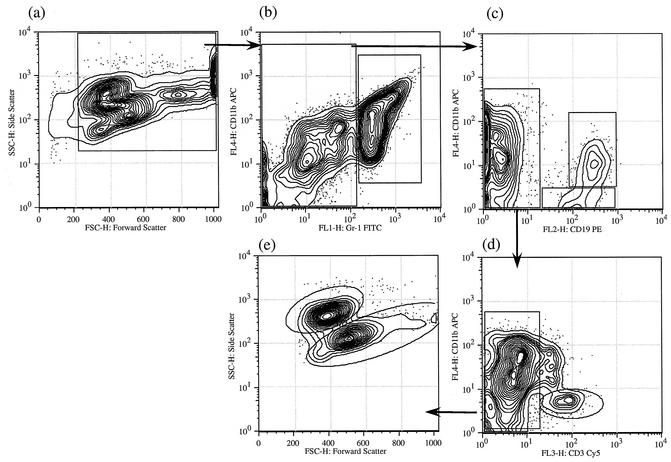
Four-color analysis of peritoneal cell populations on day 1 postinfection Peritoneal cells obtained 1 day postinfection from a C57BL/6 mouse were stained for CD3, CD11b, CD19, and Gr1 as described in Materials and Methods. The gating hierarchy is shown with arrows. The gated population (all nucleated cells) in panel a has been replotted for CD11b and Gr1 staining in panel b. Gr1high cells were predominantly neutrophils by cell sorting and staining (not shown); subsequent analysis of Gr1low cells, as described in the Materials and Methods, is shown in panels c to e. T cells were distinguished on the basis of their CD3+ staining (d), and the remaining CD11b+ CD3− population was used to distinguish between eosinophils and macrophages based on their forward and side scatter (e). APC, allophycocyanin; PE, phycoerythrin; FITC, fluorescein isothiocyanate.
FIG. 3.
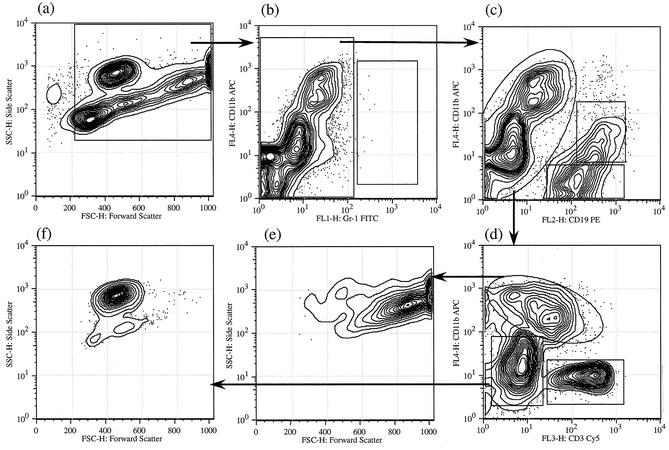
Four-color analysis of peritoneal cell populations at 10 days postinfection. Peritoneal cells obtained 10 days postinfection from a C57BL/6 mouse was stained for CD11b, CD19, Gr1, and CD3. Analysis was performed as described for Fig. 2. Abbreviations are as defined for Fig. 2.
Figure 2a depicts the forward and side scatter profiles of all nucleated cells in the peritoneal cavity of a typical wild-type mouse at 1 day following infection. At least five different cell populations can be readily visualized in this contour plot (a), with some overlaps of the cell populations. Analysis of all of these nucleated cells using two parameters, Gr1 (x axis) and CD11b (y axis) (b), reveals that they fall into two broad classes. One is Gr1high (mean channel fluorescence > 102), and the second is Gr1low (mean channel fluorescence < 102) (b). The distributions of cells between these two gates are approximately equivalent. Cells that are intensely Gr1+ are polymorphonuclear leukocytes, as identified by cell sorting and subsequent cytological evaluation of Giemsa-stained cytospin preparations (data not shown).
The Gr1low population can be further subdivided with antibodies against CD19 and CD11b. This analysis (Fig. 2c) reveals that approximately 25 to 30% of all nucleated cells are CD19+ B lymphocytes. These fall into two subclasses, a population that is CD11b+ CD19+ and a population that is CD11b− CD19+. The CD19− cells can be further analyzed by two-color analysis using CD11b and CD3. A small subset of these cells is CD3+ and are therefore T cells or NK T cells (d). The CD11b+ CD3− cells fall into two classes as analyzed by scatter (e). One of these is relatively small and high in side scatter and can be shown to be eosinophils by sorting and analysis of cytospin preparations. The larger, less-granular cells are macrophages.
Figure 3 is an analysis of PECs 10 days after infection. Indeed, the profiles are similar at any time point after 3 days. A striking contrast in comparison to the population on day 1 can be noted. When the population was analyzed with CD11b and Gr1 (b), it was seen that few if any cells are in the Gr1high class as defined above. Thus, Gr1high cells (polymorphonuclear leukocytes) disappear from the peritoneal cavity by day 3 and do not reappear in response to this particular parasitic agent. Other populations are similar in later days, with some changes in relative numbers as described below.
(ii) Neutrophils.
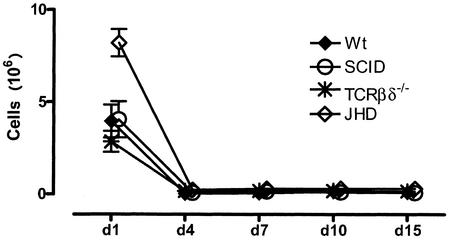
Figure 4 demonstrates the influx of neutrophils into the peritoneal cavity as a function of time. It will be seen that neutrophil numbers peak on day 1 and decline substantially by day 3 in normal mice. No further influx of neutrophils is seen with this particular infectious model. It is worth noting that all the immunodeficient mice that we have used for these analyses mirror the changes in wild mice. Thus, despite their profound immunodeficiency, SCID mice also show a significant influx of neutrophils on day 1, as do TCRβδ−/− and JHD mice. In this particular experiment, JHD mice accumulate more neutrophils than the other groups studied. However this is not a consistent and reproducible finding.
FIG. 4.
Neutrophil influx. Numbers of neutrophils were obtained by enumerating Gr1high cells. Cohorts of B6+/+ (Wt), SCID, TCRβδ−/−, and JHD mice (three to five mice per group) were infected with 50 B. pahangi L3 organisms and necropsied at various days postinfection. Percentages of Gr1+ cells (Fig. 2) were obtained and plotted as a function of time. Error bars represent standard errors of the means.
(iii) Eosinophils.
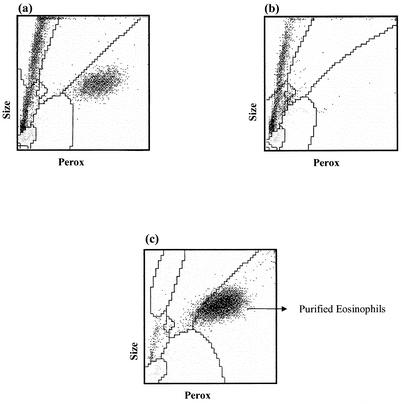
Unlike neutrophils, for which high-level expression of Gr1 is a suitable, unique distinguishing feature, eosinophils have no single feature that can be universally used for monitoring. In our previous publications, we have used forward and side scatter characteristics, followed by isolation by cell sorting, to demonstrate their unique position. The Advia 120 hematology system (Bayer Diagnostics) uses leukocyte peroxidase as a biochemical marker to categorize cells. A typical cytological profile of the peritoneal cavities of wild-type mice at 7 days postinfection is shown in Fig. 5. The population that is high in peroxidase activity (x axis) and of moderate cell size (y axis) is categorized by the manufacturer's software as eosinophils. We have independently confirmed this attribution by analysis of PECs from IL-5 knockout mice and purified eosinophils from IL-5Tg mice, as shown in Fig. 5b and c. Thus, IL-5 knockout mice lack cells that fall into this gate. Cytological examination of cells isolated from IL-5Tg mice by depletion of all CD3+ and CD19+ cells reveals that they comprise greater than 80% eosinophils (data not shown). Reanalysis of this purified population on the Advia 120 system is shown in Fig. 5c. It can be seen that these purified eosinophils fall entirely within this gate. By these criteria, we have been able to validate the assignment of this gate to eosinophils.
FIG. 5.
Peroxidase (Perox) staining profile for distinguishing eosinophils. B6+/+ and IL-5−/− mice were necropsied 7 days after infection with B. pahangi. B6+/+ (a) and IL-5−/− (b) mouse PECs were analyzed with the Advia 120 system. Eosinophils from IL-5Tg mice were purified as described in Materials and Methods and analyzed with the Advia 120 system.
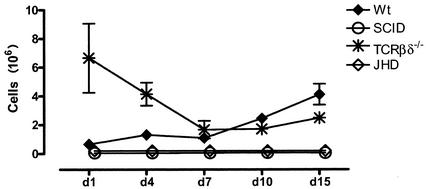
Using their unique position in the Advia 120 system, we have been able to track the influx of eosinophils into the peritoneal cavity. These data are shown in Fig. 6. It can be seen that eosinophils accumulate within the peritoneal cavity on day 1 in a normal mouse. However, the absolute number of eosinophils on day 1 is a fraction of that of neutrophils. Unlike neutrophils, these cells continue to accumulate in the peritoneal cavity, until they form a substantial fraction (25 to 30%) of the total PEC population by day 15.
FIG. 6.
Eosinophil influx. Cohorts of B6+/+ (Wt), SCID, TCRβδ−/−, and JHD mice (three to five mice per group) were infected with 50 B. pahangi L3 organisms and necropsied at various days postinfection Eosinophils were enumerated with the Advia 120 hematology system. Error bars represent standard errors of the means.
The immunodeficient mice used in our studies show interesting deviations from this pattern (Fig. 6). SCID and TCRβδ−/− mice fail to accumulate eosinophils at later time points, even though they do show a substantial influx of eosinophils in the first day. Consistent with the patterns seen with the total cell numbers, B-cell-deficient mice show some influx of eosinophils. The absolute numbers are lower than those seen in wild-type mice.
(iv) Macrophages.
In a previous publication (17) describing the accumulation of cells in normal mice, Rajan et al. used their unique forward and side scatter parameters to define macrophages. We further sorted these cells based on these two characteristics and demonstrated that the large cells with high granularity were indeed macrophages. We find that two additional phenotypic markers, CD11b and CD19, can be used to confirm their identity on FACS analysis. As is seen in Fig. 2 and 3, macrophages fall in a gate that is defined as CD11bhigh CD19−.
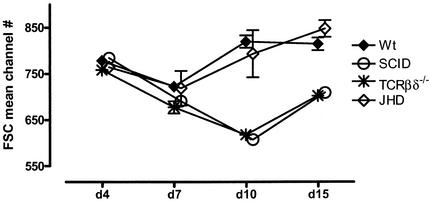
The most interesting feature of the macrophage phenotype during the course of infection is a substantial increase in the size of these cells (Fig. 7). It can be seen that there is an increase in the size of macrophages in wild-type mice, as reflected in the increase in their mean channel position in the forward scatter parameter. Coincident with the decline in worm numbers, they decline in size until they return to baseline around day 15, the time during which most worms are eliminated in wild-type mice. Macrophages remain small in SCID and TCRβδ−/− mice, suggesting an important role for a T-cell-dependent process in this morphological change.
FIG. 7.
Increase in macrophage size following Brugia infection. Macrophages were gated as shown in Fig. 2. Mean channel numbers for forward scatter (FSC) at different time points postinfection are plotted. Error bars represent standard errors of the means. There were three to five mice per group.
(v) B lymphocytes.
As indicated in the initial walkthrough of the logic of our analyses, we have been able to identify B lymphocytes in PECs by the use of a combination of CD19 and CD11b. Cells that are CD19 positive fall into two groups. One population is CD11b+ CD19+; consistent with the literature, we have called these B1 cells. Further documentation that they are indeed B1 cells is revealed by analysis of PECs from CBA/N mice in which there is a specific defect in the production of B1 B lymphocytes (data not shown). In such mice CD11b+ CD19+ cells are missing.
Using this parameter, we have analyzed the appearance of B1 cells in the peritoneal cavities of mice following infection. B1 cells are a predominant population in the peritoneal cavities of normal mice, comprising between 0.5 × 10⁶ and 1 × 10⁶ cells under resting conditions. The number of cells remains reasonably stable for the first 7 days of infection and subsequently increases dramatically until it reaches 4 million at day 15 in wild-type mice (Fig. 8). As expected, SCID mice and JHD mice lack all B lymphocytes and therefore do not show the presence of any B1 cells. The behavior of the B1 cells in TCRβδ−/− knockout mice is of interest. There is a substantial presence of B1 cells in TCRβδ−/− mice at early points after infection. These, however, decline by day 7 and remain below the levels in wild-type mice.
FIG. 8.
B1 cells. B6+/+, SCID, TCRβδ−/−, and JHD mice (three to five in each group) were sacrificed at various time points postinfection, and the percentages of B1 cells were obtained as shown for Fig. 2 and plotted as total cell numbers. Error bars represent standard errors of the means.
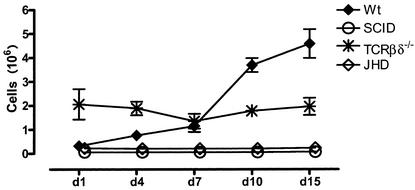
The other subset of B lymphocytes is CD19+ CD11b−. These have been called B2 cells or “conventional” B lymphocytes. B2 cells also increase in wild-type mice through the course of infection to about 4 million cells (Fig. 9). Thus, B1 and B2 cells together comprise 35 to 40% of all nucleated cells in the peritoneal cavities of normal mice. The numbers of B2 cells remain essentially stable in TCRβδ−/− mice. As expected these cells are not seen in SCID or JHD mice.
FIG. 9.
B2 cells. B2 cells in the peritoneal cavities of various strains of mice (three to five in each group) after 1, 4, 7, 10, or 15 days of infection with B. pahangi were obtained as shown for Fig. 2 and plotted as total cell numbers. Error bars represent standard errors of the means.
(vi) T lymphocytes.
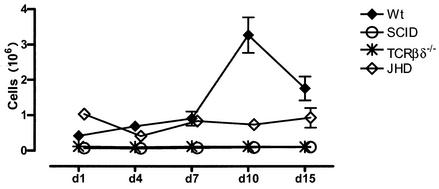
As indicated in our preliminary walkthrough of the logic of our analyses, we have identified T cells by the presence of CD3. Using this parameter, we can evaluate the number of T cells in the peritoneal cavities of mice, as indicated in Fig. 10. It can be seen that T cells are relatively sparse in the peritoneal cavities, representing less than 1 million cells up to day 7. Between days 7 and 10 they increase in number to about 3 million cells and decline somewhat by day 15. As expected SCID and TCRβδ−/− mice do not have any T lymphocytes at any time of infection. The most unexpected finding, however, comes from our analysis of JHD mice. Consistent with what is found for normal mice, there are relatively few T lymphocytes in JHD mice at early time points after infection. However the rise in T-cell numbers that occurs in B6+/+ mice between day 7 and day 15 does not take place in JHD mice. Thus, even though JHD mice should have normal numbers of T lymphocytes, these cells are apparently not attracted to the site of infection in these mice.
FIG. 10.
Kinetics of T-cell influx. T-cell numbers at various time points postinfection were obtained from CD3+ CD11b− cells (as gated in Fig. 2 and 3). There were three to five mice per group. Error bars represent standard errors of the means.
DISCUSSION
Filarial nematodes cause infections in approximately 120 million people worldwide. The mechanisms that underlie host defense against these organisms are not well understood. Over the past several years, we have attempted to develop murine models for this infection, with the aim of dissecting the parameters that underlie host defense. In a recent publication (17), Rajan et al. detailed the time course of infection in two commonly used strains of immunocompetent mice and the cellular responses to infection in the peritoneal cavities of these mice. The intent was to use these data to begin to analyze the deviations from such normalcy in mice with mutations in genes that control various aspects of the immune response, with the hope that these deviations will help us understand the normal processes. We and others have earlier shown that mice that lack T cells (TCRβδ−/− mice), B cells (JHD mice), or both (SCID or RAG-1 knockout mice) are permissive for infection, in contrast to normal immunocompetent mice. In this communication, we describe the early immune responses to filarial infection in these mice and contrast them with that in normal mice.
Our work over the last few years has indicated that the formation of granulomas around larvae is an important mechanism but not necessarily the only mechanism by which worms are eliminated from the immunocompetent host. Granulomas (with morphology very similar to that which we have described) develop in infected jirds (8), rats (11), golden hamsters (12), and dogs and cats (21). Data on the histopathology of human filarial disease are relatively sparse. Wartman reported similar granulomatous reactions around filarial worms in lymph nodes and lymphatics biopsied from American soldiers who contracted the disease during their deployment in the South Pacific islands (25). Thus, the formation of granulomas in response to filarial nematodes appears to be a generalized mammalian response and therefore of relevance to human disease.
It appears that several discrete steps are involved for the formation of these nodular structures: (i) accumulation of leukocytes in the peritoneal cavity, (ii) morphological changes in the leukocytes at the site of infection, (iii) adhesion of cells to the worms, and (iv) formation of the fully structured granuloma.
None of the mutants that we have used in this study (SCID, TCRβδ−/−, and JHD) form substantial numbers of granulomas. This failure is also correlated with greater permissiveness than that for wild-type mice. In the first two strains, the failure to form granulomas may be due to the impaired cell recruitment after day 7. In contrast, significant cellular infiltration takes place in JHD mice, even though it is considerably delayed and not as robust as that in wild-type mice. Thus, it appears that the defect in mice that lack T lymphocytes (alone as in TCRβδ−/− mice or in combination as in SCID mice) is predominantly in the failure to accumulate the correct type of cellular influx at the site of infection, whereas in JHD mice it is a combination of not acquiring the correct number of cells and a second, downstream lesion that we have not yet characterized.
Several points are worth noting in terms of the cellular influx. It appears that it has two very distinct phases, with different constituents in the two phases. The early phase appears to be predominantly mediated by an influx of large numbers of neutrophils. It is worth noting that this phase takes place in all mutants, irrespective of the nature of the defect in adaptive immunity. It is worth further noting that the neutrophil influx decays rapidly in all mice until, by day 3, few if any neutrophils are seen. Neutrophils do not reappear in the peritoneal cavity in this particular disease. In view of the considerable attention (4, 20, 22) that has been paid to the Wolbachia endosymbiont in filarial nematodes and the possibility that the lipopolysaccharide of this organism may be responsible for the inflammatory response to these organisms, it worth noting that the subsequent phases, during which there must be death of the parasite and release of Wolbachia, are not associated with a secondary influx of neutrophils.
Another fact worth noting is the influx of eosinophils relatively early in inflammation. This, however, may be a murine peculiarity. It has been noted by other investigators (16, 19) that the early inflammatory influx in mice is characterized by the presence of eosinophils, which are not seen in primates, including humans.
Our use of the immunodeficient animals has thus helped us understand the checkpoints in host immunity. It is clear that, whereas the predominant components of the granuloma are macrophages and eosinophils, cells of the adaptive immune system play crucial roles in their arrival in the peritoneal cavity, as well as in assisting them to adhere to the larvae and perhaps form the granuloma. In a previous study, Paciorkowski et al. have shown that mice that lack B lymphocytes do not eliminate worms (15). These recent studies on the early phases of the host response lead us to the somewhat unexpected discovery that mice that lack B cells do not accumulate T cells at the site of infection. These data have striking resemblance to other models of inflammation in which a role would not have been predicted for B cells. Tsuji et al. (23) have conducted a detailed analysis of the delayed hypersensitivity (DTH) response, a quintessential Th1 response. Surprisingly, mice that lack B lymphocytes do not develop a full-fledged DTH response to haptens such as oxazolone and picric acid. Despite the fact that the effector phase of this response is mediated by Th1 cells, their data suggest that the initiation of the response requires the presence of B cells in the host. Another model that appears not to be mediated by adaptive immunity is the ischemia-reperfusion model (3). In this model, ligation or clamping of the arterial supply, followed by release, results in tissue injury. Despite the fact that this appears to be mediated entirely by vascular events, recent data suggest that the extent of tissue injury is drastically diminished in mice that do not have B lymphocytes. Here, it appears that “natural” antibodies play a critical role in the initiation of inflammation by processes that remain to be fully elucidated. It appears that our model falls into this emerging paradigm that B lymphocytes and/or their products may play critical roles in the development of full-fledged inflammatory responses. Finally, in a model that is closely related to the lymphatic filarial infection presented herein, Hall et al. (7) have recently shown that corneal inflammation in mice sensitized to Onchocerca volvulus antigens is muted in mice without B lymphocytes.
Our work raises the question of the universality of the phenomena we are describing. Are the data true for peritoneal infection in general and to what extent are they specific for filarial infection? We are currently investigating this issue.
In conclusion, Brugia infection in peritoneal cavities of mice results in an exuberant inflammatory reaction, with a rapid accumulation of B1 and B2 cells, T cells, macrophages, and eosinophils. T cells seem to be critical in facilitating the influx of eosinophils to the site of infection. They also seem to be important in causing the increase in macrophage size later in infection, which might have significant functional implications in the defense against Brugia infections. B cells or B-cell products, unexpectedly, seem to be critical in facilitating the influx of T cells to the site of infection. We believe that the FACS analysis of peritoneal cells described in this paper will serve as a helpful method to allow for rapid, simple, and quantitative enumeration of several different cell populations when studying immune responses in the murine peritoneal cavity.
Acknowledgments
This work was made possible by grants AI 39705 and AI 42362 to T.V.R.
Editor: W. A. Petri, Jr.
REFERENCES
- 1.Al-Qaoud, K. M., A. Taubert, H. Zahner, B. Fleischer, and A. Hoerauf. 1997. Infection of BALB/c mice with the filarial nematode Litomosoides sigmodontis: role of CD4+ T cells in controlling larval development. Infect. Immun. 65:2457-2461. [DOI] [PMC free article] [PubMed] [Google Scholar]
- 2.Babu, S., L. D. Shultz, T. R. Klei, and T. V. Rajan. 1999. Immunity in experimental murine filariasis: roles of T and B cells revisited. Infect. Immun. 67:3166-3167. [DOI] [PMC free article] [PubMed] [Google Scholar]
- 3.Barrington, R., M. Zhang, M. Fischer, and M. C. Carroll. 2001. The role of complement in inflammation and adaptive immunity. Immunol. Rev. 180:5-15. [DOI] [PubMed] [Google Scholar]
- 4.Brattig, N. W., D. W. Buttner, and A. Hoerauf. 2001. Neutrophil accumulation around Onchocerca worms and chemotaxis of neutrophils are dependent on Wolbachia endobacteria. Microbes Infect. 3:439-446. [DOI] [PubMed] [Google Scholar]
- 5.Carlisle, M. S., D. D. McGregor, and J. A. Appleton. 1991. Intestinal mucus entrapment of Trichinella spiralis larvae induced by specific antibodies. Immunology 74:546-551. [PMC free article] [PubMed] [Google Scholar]
- 6.Finkelman, F. D., T. Shea-Donohue, J. Goldhill, C. A. Sullivan, S. C. Morris, K. B. Madden, W. C. Gause, and J. F. Urban, Jr. 1997. Cytokine regulation of host defense against parasitic gastrointestinal nematodes: lessons from studies with rodent models. Annu. Rev. Immunol. 15:505-533. [DOI] [PubMed] [Google Scholar]
- 7.Hall, L. R., J. H. Lass, E. Diaconu, E. R. Strine, and E. Pearlman. 1999. An essential role for antibody in neutrophil and eosinophil recruitment to the cornea: B cell-deficient (microMT) mice fail to develop Th2-dependent, helminth-mediated keratitis. J. Immunol. 163:4970-4975. [PubMed] [Google Scholar]
- 8.Jeffers, G. W., T. R. Klei, F. M. Enright, and W. G. Henk. 1987. The granulomatous inflammatory response in jirds, Meriones unguiculatus, to Brugia pahangi: an ultrastructural and histochemical comparison of the reaction in the lymphatics and peritoneal cavity. J. Parasitol. 73:1220-1233. [PubMed] [Google Scholar]
- 9.Kopf, M., F. Brombacher, P. D. Hodgkin, A. J. Ramsay, E. A. Milbourne, W. J. Dai, K. S. Ovington, C. A. Behm, G. Kohler, I. G. Young, and K. I. Matthaei. 1996. IL-5-deficient mice have a developmental defect in CD5+ B-1 cells and lack eosinophilia but have normal antibody and cytotoxic T cell responses. Immunity 4:15-24. [DOI] [PubMed] [Google Scholar]
- 10.Lee, J. J., M. P. McGarry, S. C. Farmer, K. L. Denzler, K. A. Larson, P. E. Carrigan, I. E. Brenneise, M. A. Horton, A. Haczku, E. W. Gelfand, G. D. Leikauf, and N. A. Lee. 1997. Interleukin-5 expression in the lung epithelium of transgenic mice leads to pulmonary changes pathognomonic of asthma. J. Exp. Med. 185:2143-2156. [DOI] [PMC free article] [PubMed] [Google Scholar]
- 11.Mackenzie, C. D., S. L. Oxenham, A. Gatrill, S. Andrew, D. Grennan, and D. A. Denham. 1985. Mononuclear and multinuclear macrophages in filarial infections. Immunol. Lett. 11:239-246. [DOI] [PubMed] [Google Scholar]
- 12.Malone, J. B., J. R. Leininger, and W. L. Chapman, Jr. 1976. Brugia pahangi: histopathological study of golden hamsters. Exp. Parasitol. 40:62-73. [DOI] [PubMed] [Google Scholar]
- 13.Nelson, F. K., D. L. Greiner, L. D. Shultz, and T. V. Rajan. 1991. The immunodeficient scid mouse as a model for human lymphatic filariasis. J. Exp. Med. 173:659-663. [DOI] [PMC free article] [PubMed] [Google Scholar]
- 14.Ottesen, E. A., B. O. Duke, M. Karam, and K. Behbehani. 1997. Strategies and tools for the control/elimination of lymphatic filariasis. Bull. W. H. O. 75:491-503. [PMC free article] [PubMed] [Google Scholar]
- 15.Paciorkowski, N., P. Porte, L. D. Shultz, and T. V. Rajan. 2000. B1 B lymphocytes play a critical role in host protection against lymphatic filarial parasites. J. Exp. Med. 191:731-736. [DOI] [PMC free article] [PubMed] [Google Scholar]
- 16.Padilla, A., T. Govezensky, E. Sciutto, L. F. Jimenez-Garcia, M. E. Gonsebatt, P. Ramirez, and C. Larralde. 2001. Kinetics and characterization of cellular responses in the peritoneal cavity of mice infected with Taenia crassiceps. J. Parasitol. 87:591-599. [DOI] [PubMed] [Google Scholar]
- 17.Rajan, T. V., L. Ganley, N. Paciorkowski, L. Spencer, T. R. Klei, and L. D. Shultz. 2002. Brugian infections in the peritoneal cavities of laboratory mice: kinetics of infection and cellular responses. Exp. Parasitol. 100:235-247. [DOI] [PubMed] [Google Scholar]
- 18.Rajan, T. V., and N. Paciorkowski. 2000. Role of B lymphocytes in host protection against the human filarial parasite, Brugia malayi. Curr. Top. Microbiol. Immunol. 252:179-187. [DOI] [PubMed] [Google Scholar]
- 19.Sabin, E. A., M. A. Kopf, and E. J. Pearce. 1996. Schistosoma mansoni egg-induced early IL-4 production is dependent upon IL-5 and eosinophils. J. Exp. Med. 184:1871-1878. [DOI] [PMC free article] [PubMed] [Google Scholar]
- 20.Saint Andre, A., N. M. Blackwell, L. R. Hall, A. Hoerauf, N. W. Brattig, L. Volkmann, M. J. Taylor, L. Ford, A. G. Hise, J. H. Lass, E. Diaconu, and E. Pearlman. 2002. The role of endosymbiotic Wolbachia bacteria in the pathogenesis of river blindness. Science 295:1892-1895. [DOI] [PubMed] [Google Scholar]
- 21.Schacher, J. F., and P. F. Sahyoun. 1967. A chronological study of the histopathology of filarial disease in cats and dogs caused by Brugia pahangi (Buckley and Edeson, 1956). Trans. R Soc. Trop. Med. Hyg. 61:234-243. [DOI] [PubMed] [Google Scholar]
- 22.Taylor, M. J., H. F. Cross, and K. Bilo. 2000. Inflammatory responses induced by the filarial nematode Brugia malayi are mediated by lipopolysaccharide-like activity from endosymbiotic Wolbachia bacteria. J. Exp. Med. 191:1429-1436. [DOI] [PMC free article] [PubMed] [Google Scholar]
- 23.Tsuji, R. F., M. Szczepanik, I. Kawikova, V. Paliwal, R. A. Campos, A. Itakura, M. Akahira-Azuma, N. Baumgarth, L. A. Herzenberg, and P. W. Askenase. 2002. B cell-dependent T cell responses: IgM antibodies are required to elicit contact sensitivity. J. Exp. Med. 196:1277-1290. [DOI] [PMC free article] [PubMed] [Google Scholar]
- 24.Vickery, A. C., A. L. Vincent, and W. A. Sodeman, Jr. 1983. Effect of immune reconstitution on resistance to Brugia pahangi in congenitally athymic nude mice. J. Parasitol. 69:478-485. [PubMed] [Google Scholar]
- 25.Wartman, W. B. 1947. Filariasis in American armed forces in World War II. Medicine 26:333-394. [DOI] [PubMed] [Google Scholar]
- 26.Yates, J. A., K. A. Schmitz, F. K. Nelson, and T. V. Rajan. 1994. Infectivity and normal development of third stage Brugia malayi maintained in vitro. J. Parasitol. 80:891-894. [PubMed] [Google Scholar]


