Abstract
GTP is known to be a potent inhibitor of the protein crosslinking activity of transglutaminase (TG), probably the most abundant G protein in the human red cell. Nucleotide binding to TG was examined by fluorescence spectroscopy and anisotropy in mixtures of TG with methylanthraniloyl analogs of GTP and GDP. A characteristic feature was the appearance of a major energy transfer band (λexc, max = 290 nm, λem = 444 nm) from protein tryptophans to the bound nucleotides. Quenching of the bound fluorophore (λexc = 360 nm, λem = 444 nm) by acrylamide was barely different from that of free ligand. However, major changes were observed in anisotropy, which was used to demonstrate a facile exchange between bound and free nucleotides and to evaluate affinity constants for the binding of methylanthraniloyl GTP and GDP to TG.
Because of its abundance and exceptionally high affinity for plasma fibronectin (1, 2), the transglutaminase (TG; EC 2.3.2.13) discharged from human erythrocytes seems to play a critical role in wound healing. When released from the lysed red cells at the site of injury, the combination of TG and fibronectin forms ternary complexes with collagen (3), and by interactions with β1- and β3-integrins, TG also promotes the anchoring of fibronectin to cell surfaces and facilitates cell spreading (4). Thus, independently from its protein crosslinking potential, the red cell-derived TG serves as a cement in establishing a provisional matrix in the wound. Eventually, the TG-catalyzed fusion of proteins by Nɛ(γ-glutamyl)lysine bridges would add to the stability of extracellular elements (5).
Within the red cell, the activity of TG can be turned on by increasing the concentration of Ca2+, and with the crosslinking of membrane-associated proteins (band 3, ankyrin, spectrin, 4.1), the reaction produces an irreversible loss of deformability (6–9). GTP is a potent allosteric inhibitor of the enzyme, lowering its affinity for Ca2+ (10, 11). The question as to whether the enzymatic crosslinking of membrane proteins could in some situations be a significant factor in the destruction of erythrocytes cannot be answered as yet without knowing the actual concentrations of Ca2+ and GTP prevailing in the cells just a few minutes before their being eliminated from the circulation. Experiments with other systems suggest that this type of TG can be activated rapidly (12). For the moment, the notion pointing to the possible involvement of TG in the process of cell destruction rests on the isolation of Nɛ(γ-glutamyl)lysine crosslinks, the characteristic products of TG action, from red cell membrane polymers of a sickle cell (13) and a hemoglobin-Köln patient (14); in both conditions, the life span of the erythrocyte is greatly reduced. The fava bean-induced hemolytic crisis in subjects deficient in glucose-6-phosphate dehydrogenase seems to be another example (15). It is also interesting that the selective depletion of GTP in the red cell is a persistent feature of hemolytic anemias associated with hereditary disorders of purine metabolism (16). When released from inhibition by GTP, crosslinking by TG and cell destruction could perhaps be triggered more readily in the GTP-deprived erythrocytes (and, for that matter, also in the nerve cells of such patients, e.g., those with Lesch–Nyhan syndrome) than in normal cells.
Some tissue (class II) TGs related to the one isolated from the human erythrocyte have been shown to be capable of performing G protein-like activities in transducing signals from epinephrine (17–21) and thromboxane (22). Inasmuch as their molecular masses are much higher than those of the well known heterotrimeric Gαs, this family of GTP/GDP binding proteins is collectively referred to as Gh.
The purpose of the present investigation was to gain a deeper insight into the nucleotide binding properties of erythrocyte TG/Gh by employing methylanthraniloyl (mant) analogs of GTP and GDP. These environmentally sensitive fluorescent probes have been used to explore the reactions of several G proteins, such as ras (23, 24), rho (25, 26), and dynamin (27). The heterotrimeric Go (28–30), the predominant species of Gα in the human brain, and the retinal Gα subunit of transducin interact rather weakly with mantGTP (31), because residues from the helical domain of Gαs would need to make contact with the 2′ and 3′ hydroxyls in the ribose of the nucleotide (32). Examining interactions of mantGTP and mantGDP with TG/Gh is all the more interesting, because models of the protein do not show any structural features resembling the GTP/GDP binding pockets of other G proteins (33, 34). In addition, our fluorescence studies revealed a facile exchange between TG-bound and free nucleotides and provided the means for measuring nucleotide-binding constants.
Materials and Methods
TG was purified from human red cells by affinity chromatography, employing a fragment of human fibronectin as described (2, 35). The enzyme was stored in small aliquots in 20 mM imidazole-HCl/1 mM EDTA/10% (vol/vol) glycerol, pH 7.5 at −80°C. Protein concentration was determined by the BCA method (Pierce) with BSA (Pierce) as the standard. The fluorescent nucleotide analogs 2′-(or-3′)-O-(N-methylanthraniloyl)guanosine-5′-triphosphate, trisodium salt (mantGTP), and 2′(or-3′)-O-(N-methylanthraniloyl)guanosine-5′-diphosphate, disodium salt (mantGDP), were obtained from Molecular Probes as a solution (5 mM) in 50 mM Tris⋅HCl, pH 7.5. Stock solutions (50–100 mM) of GTP, GDP, GMP, and guanosine-5′-O-thiotriphosphate (GTPγS) from Sigma were made in water and stored at −80°C. In all experiments with nucleotides, equimolar concentrations of MgCl2 were used. Acrylamide (30% vol/vol solution) was purchased from Roche Molecular Biochemicals. Buffer solutions were Millipore-filtered through nitrocellulose (0.45-μm pore size).
Fluorescence measurements were carried out with an SLM 8000 C double-emission spectrofluorometer (SLM–Aminco, Urbana, IL). Excitation and emission spectra were recorded (20°C) in a microcuvette (5-mm light path) in 150-μl solutions of 10 mM sodium phosphate/100 mM NaCl, pH 8.0, containing mantGTP/Mg2+ or mantGDP/Mg2+ with and without TG added. Control spectra were also obtained for solutions of TG. Polarization experiments were performed with constant stirring of solutions of the mant nucleotides (0.1 μM) in 1 ml of the pH 8 buffer, followed by injections of aliquots of TG. Release of bound mant nucleotides from complexes with TG was examined by injecting GTPγS, GDP, or GMP. Data were subjected to a 10-pass smoothing routine as described (2).
Results and Discussion
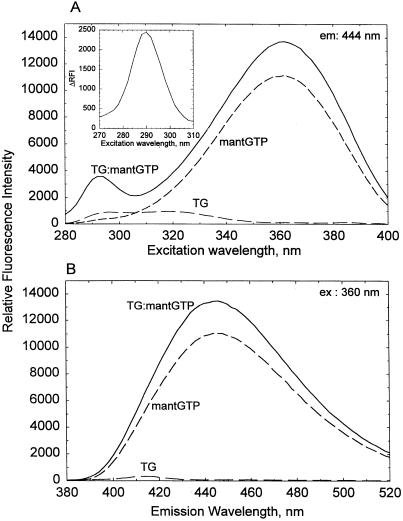
The major reorganization that occurs with the binding of GTP or GDP in the human red cell TG molecule is best reflected in a large anodic shift in the mobility of the protein in nondenaturing electrophoresis, a shift much larger than would be accounted for simply by the acquisition of two to three extra negative charges from binding the nucleotides (36). The addition of mant analogs to TG produced the same mobility changes, indicative of the fact that the mant-substituted nucleotides were just as effective as GTP or GDP in inducing a conversion of the nucleotide-free, slowly migrating form of TG to the fast, nucleotide-bound form of the protein. As illustrated for mantGTP in Fig. 1, the addition of these nucleotides to TG also caused significant changes in the excitation (Fig. 1A) and emission (Fig. 1B) spectra of the mant fluorophore. With excitation at 360 nm, under the conditions of this particular experiment, the intensity of the rather broad emission band (λem ≈ 444 nm) increased somewhat on addition of TG (by a mean value of about 2,374 ± 80 from 10,043 ± 989, n = 7, for mantGTP and by 1,194 ± 185 from 10,799 ± 1,279, n = 7, for mantGDP). However, the most prominent feature of the spectral changes observed in mixtures of TG with the mant nucleotides was the appearance of a new excitation band with 290-nm maximum. A difference spectrum for this band is presented in Fig. 1A Inset for TG:mantGTP; the TG:mantGDP mixture showed a smaller increase for this band. All of the above changes were specific for the interactions of TG with the mant nucleotides, because they could be abolished by addition of GTPγS or GDP.
Figure 1.
Fluorescence spectra for mantGTP and TG. (A) Excitation with λ = 444-nm emission. (B) Emission with λ = 360-nm excitation. Recordings were made at 20°C with TG (1 μM) and mantGTP (0.5 μM) separately and with the two combined (solid line); the solutions (150 μl) also contained 10 mM sodium phosphate, pH 8/100 mM NaCl/0.5 μM MgCl2. (A Inset) An energy transfer band (λmax = 290 nm) calculated from the difference of excitation intensities between the mixtures of TG with mantGTP and the sum of TG and mantGTP alone.
Appearance of the 290-nm band (Fig. 1A) can be attributed to energy transfer from the excitation of one or more of the Trp residues in TG to the mant group attached to the ribose residues in the nucleotide analogs. (Although only about 60% of the amino acid sequence of the human red cell TG is available, the known sequences suggest near identity with the human endothelial TG, which contains 13 Trp residues; ref. 37.) In the binding of mantGTP to the human brain Go subunit, both of the two Trp residues in the molecule contribute to energy transfer (30). We find that this transfer band is also present in mixtures of the mant nucleotides with the chicken red cell or the guinea pig liver TG, and it is interesting that, under identical conditions, the intensity of the 290-nm transfer band is twice as high with the chicken TG than with the human protein. Clearly, the Trp residues at conserved positions in these proteins (38) should be the best targets of point mutations for examining the question as to which contributes to the process of energy transfer to the nucleotide binding pocket of TG/Gh. Proximity and/or the alignment between the relevant Trp residues and the mant group might be more favorable for energy transfer in chicken TG than in the human protein. The distribution of conserved Trp residues among the different domains of TG (for definition, see refs. 33 and 34) is most interesting. Seven of the eight conserved Trps are located in the central core domain of the protein (i.e., residues 139–471) which, in addition to the active center residues for crosslinking, also contains the GTP binding residues (34). By contrast, only a single Trp is found in the N-terminal sandwich (residues 1–138), and none are found in the barrel 1 (residues 472–584) and barrel 2 (residues 585–686) domains, C-terminal from the core. Fluorescence energy transfer from Trp to mant is likely to be affected by reorganization of the peptide backbone and side chains of the core with the binding of GTP, Ca2+, and crosslinking substrates. Thus, changes in the 290-nm transfer band (λem = 444 nm) might serve as a sensitive probe with which to monitor the crosstalk among the allosteric centers of this multifunctional protein.
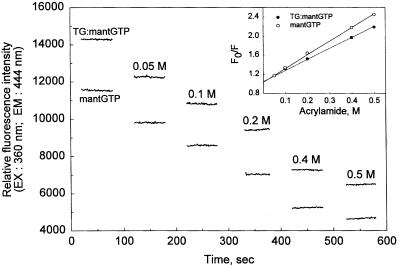
Quenching by acrylamide is often used to probe accessibilities to the nucleotide-binding pockets of proteins. In this regard, striking differences have been demonstrated for the binding of mantATP by the head domains of rabbit heart and Dictyostelium myosins (39). In our case, acrylamide quenching of the protein-bound nucleotide was barely distinguishable from that of the free nucleotide. This finding was true for mantGTP (Fig. 2) as well as for mantGDP, bringing our results more in line with the quenching behavior of mantATP bound by the Dictyostelium myosin motor (39).
Figure 2.
Acrylamide quenching of fluorescence of the TG-bound and free mantGTP. Conditions for recording emission intensities (λ = 444 nm, at 360-nm excitation) were identical to those described in Fig. 1, except for the presence of varying concentrations of acrylamide (0.05–0.5 M, as indicated on the graph). (Inset) Fluorescence changes in the emission intensity (F) with increase of acrylamide concentration, relative to that in the absence of acrylamide: F0.
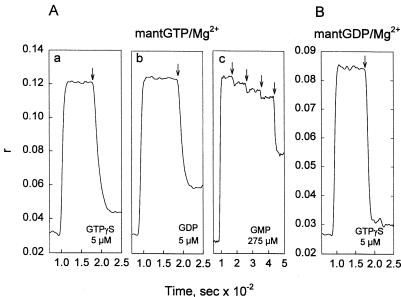
Ease of exchange between bound GDP and free GTP and between bound GTP and free GDP would be a requisite for TG/Gh to perform Gα-like functions in signal transduction. This issue was addressed by examining the anisotropy (r) of mant fluorophore in mixtures of mantGTP or mantGDP with TG, before and after the addition of GTPγS or GDP. The findings presented in Fig. 3 indicate a facile exchange between bound and free nucleotides. Actually, the observed rise and decay of r values are so fast that stop-flow procedures will have to be used for the quantitative evaluation of rates for these reactions. The data in Fig. 3 also demonstrate a large difference in specificities for GTPγS and GDP (Fig. 3 Aa, Ab, and B), on one hand, and GMP (Fig. 3 Ac) on the other. ATP (not shown) was less effective than GMP by a factor of close to 2 in displacing TG-bound mantGTP. The increases in anisotropy (Δr) of about 0.09 for 0.1 μM mantGTP and 0.06 for 0.1 μM mantGDP with 0.15 μM TG could be reduced by 50% when 0.32 μM GTPγS was allowed to compete against mantGTP and 0.21 μM GDP was allowed to compete against mantGDP for binding to TG. Such competition experiments (data not shown) indicate that the mant nucleotides have a somewhat higher affinity for TG than their unsubstituted counterparts and that the mant group also contributes slightly to binding to the protein.
Figure 3.
Exchange of the TG-bound mant nucleotides for GTPγS, GDP, and GMP, examined by changes in fluorescence anisotropy (r; λexc = 360 nm, λem = 444 nm). The cuvettes contained starting solutions of mantGTP/Mg2+ (0.1 μM; A) or mant/GDP/Mg2+ (0.1 μM; B) in 1 ml of phosphate buffer-NaCl as described in Fig. 1. At about 100 s, 10 μl of TG was injected to a concentration of 0.15 μM; at times marked by vertical arrows, 5 μl of the competing nucleotide was injected, i.e., GTPγS (Aa and B, to 5 μM) and GDP (Ab, to 5 μM). Because of the difficulty in displacing the bound mantGTP with GMP (Ac), multiple additions of the latter were required (to 5, 15, 25, and 275 μM).
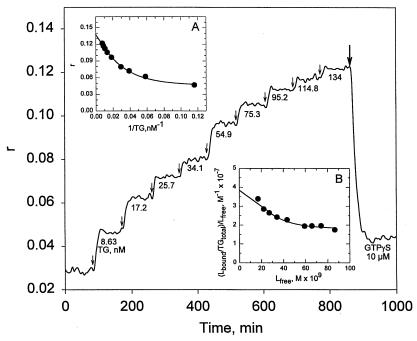
An attempt was also made to exploit anisotropy changes of mant fluorescence for measuring the binding affinities of TG for nucleotides. It was convenient to record r values while raising the concentration of TG by successive injections of the protein into the solution of the mant nucleotide under study. The main graph for the experiment examining the binding of mantGTP to TG in Fig. 4 shows increases of r with each addition of TG. GTPγS was injected (heavy vertical arrow) at the end of the experiment to document the exchangeability of the mant nucleotide. In Fig. 4 Inset A, anisotropy values are plotted against the reciprocals of TG concentrations. Extrapolation to the y axis gives r for the binding of the mantGTP ligand (L) at infinite concentration of TG. With this value, after correction for the 31% enhancement in the emission intensity of the bound state, the fractional binding of the ligand (L bound) could be calculated. Because the concentration of total ligand in the solution is known, the concentration of the bound ligand in molar units and that of free ligand (Lfree) is obtained from Lfree = Ltotal − Lbound.
Figure 4.
Binding of mantGTP/Mg2+ to TG, examined by changes in fluorescence anisotropy. Conditions were the same as described in Fig. 3, except for the fact that the concentration of TG was increased stepwise. There was only a slight change in solution volume (from 1 to 1.066 ml) during the course of titration; times of addition of TG are indicated by the vertical arrows, and its concentrations are given as nM. At the end of the experiment (heavy vertical arrow), GTPγS (10 μM) was injected. (Inset A) A plot of the reciprocal of TG concentrations against r. (Inset B) A graph for calculating binding constant (40).
From the data presented in Fig. 4 Inset B, according to the recommendation of Klotz (40), a stoichiometric binding constant was derived for the TG + mantGTP (L) ⇋ TG: mantGTP (L) equilibrium by extrapolating to the y axis for Lfree = 0. With the regression shown in Fig. 4, K ≈ 4 × 10⁷ M−1 was obtained for the binding of mantGTP to the human red cell TG. Analysis for the binding of mantGDP to the protein gave a similar value.
In a recent article (34), GTP binding has been localized to a 15-residue segment (159-YVLTQQGFIYQGSVK-173) of the protein, with residues S171 and K173 thought to be critical for binding to the nucleotide. Also, some mutations N-terminal to G170 have been shown to be detrimental to binding GTP. However, chicken erythrocyte TG (38) contains a sequence with major differences in key residues: YVLSQQGLIYMGSRD, yet we find that the transamidase activity of this enzyme, in comparison to TGs from other species (35), is perhaps the most sensitive to inhibition by GTP. Moreover, as mentioned earlier, a prominent 290-nm energy transfer band is seen in mixtures of chicken TG with mantGTP or mantGDP, and by following a procedure similar to that described in Fig. 4, a good binding of mantGTP to the protein could be documented. Thus, the definition of critical residues required for the binding of GTP/GDP in TGs would benefit from taking into account the relevant sequences of the chicken protein too.
A clear rationale for the tight binding of GTP by TG would be to keep the crosslinking activity of the enzyme in check as long as the red cell is to remain in the circulation. Release from this allosteric inhibition might happen only when the normal nucleotide metabolism of the cell and its outward directed Ca2+ pumping capacity become impaired. Although its crosslinking substrates are associated with the membrane skeleton, TG itself is isolated from the red cell lysate (2, 35) routinely with a yield of about 1.5 mg per 100 ml of packed cells. Thus, in contrast to the trimeric Gαs (41, 42) in the human erythrocyte, TG is a predominantly cytosolic G protein. Nevertheless, it is conceivable that, under the influence of certain stimuli, TG/Gh might be able to translocate to the membrane without expression of crosslinking activity and might participate in signaling.
Acknowledgments
Thanks are due to Prof. I. M. Klotz for developing the algorithm for the binding constants for situations where the concentration of the ligand is fixed and that of the protein is varied, to Prof. Heidi E. Hamm and Prof. Douglas M. Freymann for the benefit of discussions, and to Mrs. Pauline T. Velasco for help with calculations. This work was supported by National Institutes of Health Grant HL-02212.
Abbreviations
- TG
transglutaminase
- mant
2′ (or 3′)-O-(N-methylanthraniloyl)
Footnotes
Article published online before print: Proc. Natl. Acad. Sci. USA, 10.1073/pnas.140210197.
Article and publication date are at www.pnas.org/cgi/doi/10.1073/pnas.140210197
References
- 1.Lorand L, Dailey J E, Turner P M. Proc Natl Acad Sci USA. 1988;85:1057–1059. doi: 10.1073/pnas.85.4.1057. [DOI] [PMC free article] [PubMed] [Google Scholar]
- 2.Radek J T, Jeong J-M, Murthy S N P, Ingham K C, Lorand L. Proc Natl Acad Sci USA. 1993;90:3152–3156. doi: 10.1073/pnas.90.8.3152. [DOI] [PMC free article] [PubMed] [Google Scholar]
- 3.Turner P M, Lorand L. Biochemistry. 1989;28:628–635. doi: 10.1021/bi00428a032. [DOI] [PubMed] [Google Scholar]
- 4.Akimov S S, Krylov D, Fleischman L F, Belkin A M. J Cell Biol. 2000;148:825–838. doi: 10.1083/jcb.148.4.825. [DOI] [PMC free article] [PubMed] [Google Scholar]
- 5.Aeschlimann D, Paulsson M. J Biol Chem. 1991;266:15308–15317. [PubMed] [Google Scholar]
- 6.Siefring G E, Jr, Apostol A B, Velasco P T, Lorand L. Biochemistry. 1978;17:2598–2604. doi: 10.1021/bi00606a022. [DOI] [PubMed] [Google Scholar]
- 7.Lorand L, Siefring G E, Jr, Lowe-Krentz L. Semin Hematol. 1979;16:65–74. [PubMed] [Google Scholar]
- 8.Smith B D, La Celle P L, Siefring G E, Jr, Lowe-Krentz L, Lorand L. J Membr Biol. 1981;61:75–80. doi: 10.1007/BF02007633. [DOI] [PubMed] [Google Scholar]
- 9.Murthy S N P, Wilson J, Zhang Y, Lorand L. J Biol Chem. 1994;269:22907–22911. [PubMed] [Google Scholar]
- 10.Bergamini C M, Signorini M, Poltronieri L. Biochim Biophys Acta. 1987;916:149–151. doi: 10.1016/0167-4838(87)90222-6. [DOI] [PubMed] [Google Scholar]
- 11.Bergamini C M. FEBS Lett. 1988;239:255–258. doi: 10.1016/0014-5793(88)80928-1. [DOI] [PubMed] [Google Scholar]
- 12.Cariello L, Velasco P T, Wilson J, Parameswaran K N, Karush F, Lorand L. Biochemistry. 1990;29:5103–5108. doi: 10.1021/bi00473a015. [DOI] [PubMed] [Google Scholar]
- 13.Lorand L, Siefring G E, Jr, Lowe-Krentz L. In: Membrane Transport in Erythrocytes, Alfred Benzon Symposium 14. Lassen U V, Ussing H H, Wieth J O, editors. Copenhagen: Munksgaard; 1980. pp. 285–299. [Google Scholar]
- 14.Lorand L, Michalska M, Murthy S N P, Shohet S B, Wilson J. Biochem Biophys Res Commun. 1987;147:602–607. doi: 10.1016/0006-291x(87)90973-9. [DOI] [PubMed] [Google Scholar]
- 15.Turrini F, Naitana A, Mannuzzu L, Pescarmona G, Arese P. Blood. 1985;66:302–305. [PubMed] [Google Scholar]
- 16.Simmonds H A, Fairbanks L D, Morris G S, Webster D R, Harley E H. Clin Chim Acta. 1988;171:197–210. doi: 10.1016/0009-8981(88)90145-3. [DOI] [PubMed] [Google Scholar]
- 17.Im M-J, Graham R M. J Biol Chem. 1990;265:18944–18951. [PubMed] [Google Scholar]
- 18.Im M-J, Riek R P, Graham R M. J Biol Chem. 1990;265:18952–18960. [PubMed] [Google Scholar]
- 19.Nakaoka H, Perez D M, Baek K J, Das T, Husain A, Misono K, Im M-J, Graham R M. Science. 1994;264:1593–1596. doi: 10.1126/science.7911253. [DOI] [PubMed] [Google Scholar]
- 20.Feng J F, Rhee S G, Im M J. J Biol Chem. 1996;271:16451–16454. doi: 10.1074/jbc.271.28.16451. [DOI] [PubMed] [Google Scholar]
- 21.Feng J F, Readon M, Yadav S P, Im M-J. Biochemistry. 1999;38:10743–10749. doi: 10.1021/bi9905009. [DOI] [PubMed] [Google Scholar]
- 22.Vezza R, Habib A, FitzGerald G A. J Biol Chem. 1999;274:12774–12779. doi: 10.1074/jbc.274.18.12774. [DOI] [PubMed] [Google Scholar]
- 23.Neal S E, Eccleston J F, Webb M R. Proc Natl Acad Sci USA. 1990;87:3562–3565. doi: 10.1073/pnas.87.9.3562. [DOI] [PMC free article] [PubMed] [Google Scholar]
- 24.Scheidig A J, Franken S M, Corrie J E T, Reid G P, Wittinghofer A, Pai E F, Goody R S. J Mol Biol. 1995;253:132–150. doi: 10.1006/jmbi.1995.0541. [DOI] [PubMed] [Google Scholar]
- 25.Zhang B, Zheng Y. J Biol Chem. 1998;273:25728–25733. doi: 10.1074/jbc.273.40.25728. [DOI] [PubMed] [Google Scholar]
- 26.Nomanbhoy T K, Erickson J W, Cerione R A. Biochemistry. 1999;38:1744–1750. doi: 10.1021/bi982198u. [DOI] [PubMed] [Google Scholar]
- 27.Binns D D, Barylko B, Grichine N, Atkinson M A, Helms M K, Jameson D M, Eccleston J F, Albanesi J P. J Protein Chem. 1999;18:277–290. doi: 10.1023/a:1021083211267. [DOI] [PubMed] [Google Scholar]
- 28.Remmers A E, Posner R, Neubig R R. J Biol Chem. 1994;269:13771–13778. [PubMed] [Google Scholar]
- 29.Remmers A E, Neubig R R. J Biol Chem. 1996;271:4791–4797. doi: 10.1074/jbc.271.9.4791. [DOI] [PubMed] [Google Scholar]
- 30.Lan K L, Remmers A E, Neubig R R. Biochemistry. 1998;37:837–843. doi: 10.1021/bi972122i. [DOI] [PubMed] [Google Scholar]
- 31.Zera E M, Molloy D P, Angleson J K, Lamture J B, Wensel T G, Malinski J A. J Biol Chem. 1996;271:12925–12931. doi: 10.1074/jbc.271.22.12925. [DOI] [PubMed] [Google Scholar]
- 32.Noel J P, Hamm H E, Sigler P B. Nature (London) 1993;366:654–663. doi: 10.1038/366654a0. [DOI] [PubMed] [Google Scholar]
- 33.Iismaa S E, Chung L, Wu M-J, Teller D C, Yee V C, Graham R M. Biochemistry. 1997;36:11655–11664. doi: 10.1021/bi970545e. [DOI] [PubMed] [Google Scholar]
- 34.Iismaa, S. E., Wu, M.-J., Nanda, N., Church, W. B. & Graham, R. M. (2000) J. Biol. Chem.275, in press. [DOI] [PubMed]
- 35.Murthy S N P, Velasco P T, Lorand L. Exp Eye Res. 1998;67:273–281. doi: 10.1006/exer.1998.0509. [DOI] [PubMed] [Google Scholar]
- 36.Murthy S N P, Lomasney J W, Mak E C, Lorand L. Proc Natl Acad Sci USA. 1999;96:11815–11819. doi: 10.1073/pnas.96.21.11815. [DOI] [PMC free article] [PubMed] [Google Scholar]
- 37.Gentile V, Saydak M, Chiocca E A, Akande O, Birckbichler P J, Lee K N, Stein J P, Davies P J A. J Biol Chem. 1991;266:478–483. [PubMed] [Google Scholar]
- 38.Weraarchakul-Boonmark N, Jeong J-M, Murthy S N P, Engel J D, Lorand L. Proc Natl Acad Sci USA. 1992;89:9804–9808. doi: 10.1073/pnas.89.20.9804. [DOI] [PMC free article] [PubMed] [Google Scholar]
- 39.Bauer C B, Kuhlman P A, Bagshaw C R, Rayment I. J Mol Biol. 1997;274:394–407. doi: 10.1006/jmbi.1997.1325. [DOI] [PubMed] [Google Scholar]
- 40.Klotz I M. Ligand Receptor Energetics. New York: Wiley; 1997. [Google Scholar]
- 41.Birnbaumer L, Grenet D, Ribeiro-Neto F, Codina J. Methods Enzymol. 1994;237:110–130. doi: 10.1016/s0076-6879(94)37056-7. [DOI] [PubMed] [Google Scholar]
- 42.Johnson G J, Leis L A, Dunlop P C. Biochem J. 1996;318:1023–1031. doi: 10.1042/bj3181023. [DOI] [PMC free article] [PubMed] [Google Scholar]


