

Abstract
Aim
To explore the relationship between actual and expected general medical practitioner (GP) practice prescribing rates for statins, angiotensin converting enzyme (ACE) inhibitors, and beta-blockers.
Background
There is a growing body of literature highlighting inequities in GP practice prescribing rates for many drug therapies. The equity of prescribing is of central importance in the area of therapeutics since it explores the interface between those patients who should and those who actually do receive a drug therapy.
Setting
Four primary care trusts (PCTs 1–4) in the North West of England, including 132 GP practices.
Methods
Actual and expected prescribing rates for statins, beta-blockers, and ACE inhibitors were specifically developed for each GP practice.
Results
There were no statistically significant correlations between actual and expected prescribing rates in PCT2 and PCT3, although in PCT1 there were statistically significant correlations for statins (0.286, p < 0.05) and ACE inhibitors (0.381, p < 0.01). In PCT4, correlations were moderate to high for beta-blockers (0.693, p < 0.01), and moderate for statins (0.541, p < 0.05) and ACE inhibitors (0.585, p < 0.01). Scatterplots highlighted large variations between individual GP practices (both within and between PCTs) in terms of the relationship between actual and expected prescribing rates.
Conclusion
This paper highlights variability between PCTs and GP practices in terms of the relationship between actual and expected prescribing rates. The findings from this paper may further advance the suggestion of inequities in prescribing rates for coronary heart disease (CHD) drugs, and studies such as this may be repeated in different therapeutic areas, healthcare settings, and countries.
Keywords: prescribing rates, equity, coronary heart disease, statins, beta-blockers, ACE inhibitor
Introduction
The overriding aim of this paper is to explore the relationship between actual and expected general medical practitioner (GP) practice prescribing rates for statins, angiotensin converting enzyme (ACE) inhibitors, and beta-blockers. These drug groups were chosen because they represent major drug groups recommended for the prevention (primary and secondary) of coronary heart disease (CHD) in the United Kingdom (UK) (Department of Health 2000). Other CHD drug groups were also explored in the main study, although data are only available to calculate expected prescribing rates for these three drug groups.
The actual prescribing rates are based on 1999–2000 prescribing data from 132 GP practices in the North West of England. The expected prescribing rates were calculated from age-sex prescribing rates for these drugs collected in the General Practice Research Database (GPRD), which have been applied to the age-sex patient list data for the GP practices in this study. One may expect a positive relationship between actual and expected prescribing rates, and large deviations from this (ie, high actual and low expected prescribing rates, or low actual and high expected prescribing rates) may be suggestive of inequitable prescribing rates. Although expected prescribing rates are indicative of healthcare supply and/or demand, as opposed to solely healthcare need, they are used in this paper to explore how GP practice prescribing rates differ from what we may expect given the age-sex composition of their patient population.
Separate papers by the authors based on the same study have found inequitable prescribing rates for aspirin, statins, ACE inhibitors, beta blockers, and bendrofluazide (Ward et al 2003, 2004a, 2004b). These papers examined and modeled the associations between actual prescribing rates and indicators of healthcare need, and found inequities on the basis of patient age, ethnicity, and deprivation. In other words, prescribing rates were generally higher in GP practices with lower proportions of patients aged over 75 years, lower proportions of minority ethnic patients, and lower proportions of deprived patients. The current paper explores the separate issue of the association between actual prescribing rates and expected prescribing rates calculated from data in the GPRD, standardized for the age-sex composition of each GP practice. The equity of prescribing rates are explored from a different perspective, using expected prescribing rates rather than indicators of healthcare need.
The importance of equity in the world of therapeutics
One of the most important principles of healthcare systems in the developed world is based around the notion of equity. Within the UK, the National Health Service (NHS) was set up to provide a universal entitlement to the same quality of healthcare services solely on the basis of clinical need (Le Grand 1982; Goddard and Smith 2001). There are large literatures on how to define, operationalize, and measure equity in relation to healthcare services, although equity is generally taken to mean “fair” or “just”.
The concept of equity of prescribing is extremely important in the area of therapeutics, since it informs us of the groups of patients who are currently receiving these drug therapies (and maybe do not need the drugs) and those who are currently not receiving these drug therapies (and maybe do need the drugs). There is a sound evidence base in terms of the effectiveness of drug therapies and which patients may benefit from statins (Byington et al 1995; Shepherd et al 1995; Sacks et al 1996; Ebrahim et al 1998; Pignone et al 2000), ACE inhibitors (Eccles et al 1998; Blood Pressure Lowering Treatment Trialists' Collaboration 2000; Yusuf et al 2000), and beta-blockers (MacMahon et al 1997; Gottlieb et al 1998; Julian 1998; Mehta and Eagle 1998), although our evidence base in terms of who actually receives the drugs in practice is less well developed. Obviously, it is also crucial to understand which patients benefit from the drugs, however, this is not within the remit of this paper. Here, we look at the interface between who could benefit (eg, older populations, South Asian populations, deprived populations, populations with a high prevalence of CHD and/or high mortality rates from CHD) and who actually receives the drugs.
Another way to think about equity is the relationship between healthcare provision and need. On an individual level, a healthcare service would be seen as equitable if it were provided to people with clinical need (and not provided to those with no (or lower) clinical need). In the context of research on prescribing, this would require data for individual patients in terms of drugs prescribed, sociodemographics, medical history, etc. Within the UK, there are no nationally available datasets with these types of data; therefore, research on the equity of prescribing is generally conducted at population (ecological) level. In this way, research attempting to assess the equity of prescribing would explore the relationship between prescribing rates within a defined population and their concomitant healthcare needs. Equity would be explored by comparing different populations with similar prescribing rates and assessing the extent to which their healthcare needs were similar. This is akin to comparative need, which is a domain in the taxonomy of need (Bradshaw 1972, 1994). One may expect that prescribing rates would be higher in populations with high levels of healthcare need and lower in populations with low levels of healthcare need. Therefore, research that explores the relationship between prescribing rates and healthcare need in defined populations will be important in terms of understanding the equity of healthcare.
Literature on the equity of GP practice prescribing rates
There is a growing body of research that has highlighted large variations in overall prescribing rates between GP practices that are partially explained by factors other than healthcare need (Morton-Jones and Pringle 1993; Pringle and Morton-Jones 1994; Majeed et al 1996; Rice et al 2000; Lloyd and Scrivener 2001). Whilst there have been a number of studies that have highlighted large variations in statin prescribing rates between GP practices (Baxter 1998; Majeed et al 2000), only a limited number have gone on to explore the equity of this variation (Bradshaw et al 1999; Majeed et al 2000; Packham et al 2000; Patel et al 2002; Ward et al 2003, 2004a). These studies suggest inequities in prescribing rates on the basis of mortality and morbidity and also on the basis of patient demographics, ethnicity, and socioeconomic status. Indeed, a previous paper by the authors of this paper found that prescribing rates for a number of CHD drugs were negatively associated with a number of proxies of healthcare need, namely, the proportion of patients aged over 75 years, ethnicity, levels of material deprivation, and standardized mortality ratios (SMRs) for CHD (Ward et al 2004a). In other words, GP practices with high rates of CHD mortality, higher proportions of patients aged over 75 years, ethnic minority patients, and materially deprived patients had lower prescribing rates than GP practices with lower mortality rates for CHD, younger patients, less ethnic minority patients, and more affluent patients. Given that each of these variables indicate higher risk of CHD in populations, one may infer that prescribing rates seem to be inequitable and that prescribing in these GP practices confirms the “inverse care law” (Hart 1971).
The findings from this paper may further advance the suggestions of inequities in prescribing rates for CHD drugs, and studies such as this may be repeated in different therapeutic areas, in different healthcare settings, and in different countries.
Context and setting
The planning and provision of healthcare to local populations in England is now the role of primary care trusts (PCTs). Essentially, PCTs are organizations whose main responsibilities are around developing, commissioning, and providing services that are targeted to the needs of local people and ultimately aimed at improving the health (and reducing health inequalities) of local people (Department of Health 1998, 1999). PCTs have taken over these responsibilities from health authorities, which no longer exist (Department of Health 2002), and are responsible for spending 75% of the overall NHS budget in England (Peckham and Taylor 2003).
This study was undertaken in 4 PCTs in England (referred to as PCT1, PCT2, PCT3, and PCT4 throughout this paper), which included 132 GP practices (PCT1 had 50 GP practices, PCT2 24, PCT3 31, and PCT4 27). In terms of patient populations, we excluded patients aged less than 35 years, since prevalence of CHD is particularly low in this age group. In total, there were 353 897 registered patients aged over 35 across all 4 PCTs, and the median list size was 2297 patients aged over 35.
PCT4 was the most deprived of all PCTs and had the highest proportion of patients aged over 75 years and the highest median SMR for CHD. Therefore, PCT4 may be seen as having the highest levels of healthcare need in terms of CHD prescribing. In contrast, PCT1 may be seen as having the lowest levels of healthcare need of all PCTs on the basis of the healthcare needs indicators developed in this study. PCT1 was the least deprived, had the lowest proportions of South Asian groups, and had the lowest median SMR for CHD. However, PCT1 had the highest median percentage of patients aged between 55 and 74 years, which may well be the target age-group for prescribing within CHD. PCT2 and PCT3 were generally in the middle of the other PCTs in terms of healthcare need for CHD drugs.
Data sources and methods
This paper is focussed on the association between actual and expected prescribing rates. This section will focus on the data sources and methods for developing these prescribing rates for statins, beta-blockers, and ACE inhibitors. Local Research Ethics Committee approval was sought and granted for this study.
Developing actual prescribing rates
When an NHS prescription is dispensed in primary care, the prescription form (FP10) is sent to the Prescription Pricing Authority (PPA) for processing. The PPA collates these data and provides them to GP practices and PCTs in the form of Prescribing Analysis and Cost (PACT) data. PACT data are available for all GP practices in England and allow detailed interrogation in terms of drugs prescribed along with their dosages, pack sizes, and formulations. For example, for a specific time period, we can collect data on which statins were prescribed by a GP practice in addition to the dosages and pack sizes. This allows for a complex and timely analysis of PACT data. Useful critiques of PACT data can be found elsewhere (Majeed et al 1997; Chapman 2001).
PACT data were obtained for a number of CHD drugs prescribed in all GP practices in the 4 PCTs for the 12-month period October 1999 to September 2000. This paper is based on prescribing for statins (atorvastatin, cerivastatin, fluvastatin, pravastatin, simvastatin), ACE inhibitors (captopril, enalapril, lisinopril, ramipril, trandolapril), and beta-blockers (atenolol, co-tenidone). All statins available to prescribe on the NHS at the time of the study were included in the study, although cerivastatin was withdrawn from use in the UK in 2001. The category of ACE inhibitor drugs is not exhaustive, although the five drugs used represented the vast majority of prescribing of all ACE inhibitors in the study GP practices. Atenolol represented over 80% of all beta-blocker prescribing in the study GP practices, although prescribing advisers suggested that we also include co-tenidone, which is a combinational product including atenolol and chlorthalidone (a diuretic) and is therefore not strictly just a beta-blocker. Nevertheless, the PACT data collected represents all statin prescribing and the vast majority of ACE inhibitor and beta-blocker prescribing.
The numerator in all prescribing rates was based on a measure of prescription volume, as opposed to prescription cost. The validity of using the number of prescription items or total cost as a measure of prescribing volume has been called into question (Bogle and Harris 1994; Frischer and Chapman 1998) since it does not specify the quantity of prescription medication (eg, number and/or dosage of tablets). Therefore, a measure of prescription volume which calculates the total number of grams prescribed is much more useful. The main options available are defined daily doses (DDDs) (WHO 1991; PSU 1997) and average daily quantities (ADQs) (PSU 1997; PSU 2000; Walley and Roberts 2000). The Prescribing Support Unit website provides up-to-date lists of DDDs and ADQs (www.psu.co.uk) for all drugs for which they have been developed. Within this study, total ADQs were used as the unit of analysis since they represent prescribing practices in the UK, as opposed to DDDs, which represent prescribing practices internationally. The Prescribing Support Unit state that an ADQ “should not be viewed as a suggested dosage, but rather as an analytical unit for comparing prescribing performance” (PSU 2002, p 9).
The denominator in prescribing rates was the regionally specific prevalence-, age-, and sex-standardized prescribing units (PASS-PUs). PASS-PUs were developed within this study and represent the age-sex standardized expected prevalence of treated CHD in each GP practice population (see Table 1) (ONS 1998b).
Table 1.
Prevalence of treated CHD per 1000 patients by age and sex
| 0–34 | 35–44 | 45–54 | 55–64 | 65–74 | 75–84 | 85+ | |
|---|---|---|---|---|---|---|---|
| Male | 0.1 | 5 | 29 | 93.4 | 175.1 | 216.8 | 205.3 |
| Female | 0.1 | 1.8 | 12.6 | 48.3 | 108.1 | 161.6 | 171.7 |
Basically, PASS-PUs are calculated using data from GP practice lists on the age-sex composition of their registered patients and then applying the age-sex rates of treated CHD prevalence data to the practice list data. In so doing, we calculated the expected rates of treated CHD in all GP practices in the study. (See Ward et al 2003 for a full discussion and critique of PASS-PUs.) We found that using PASS-PUs as the denominator in prescribing rates was better than just using total list size, since this did not reflect the age-sex composition of the patients or their expected rates of CHD. In addition, we also found that PASS-PUs were better than other widely used prescribing units such as specific therapeutic group age-sex–related prescribing units (STAR-PUs) (Lloyd et al 1995; PSU 2000) since these are based on historical, cost-based prescribing patterns which may not reflect CHD prevalence.
Overall, the prescribing rate used in this study was total ADQs prescribed per PASS-PU.
Developing expected prescribing rates
Data were collected in the General Practice Research Database (GPRD) on age-sex rates of prescribing for statins, beta-blockers, and ACE inhibitors. The GPRD derives data from a representative sample of GP practices in England (211 GP practices with a combined population of around 1.4 million patients) about the NHS care received by their registered patients (ONS 1998a). This group of GP practices regularly collects data for the GPRD. The age-sex rates of prescribing per 1000 patients are presented in Table 2.
Table 2.
Age-sex prescribing rates for specific CHD drug groups
| Drug group | 35–44 | 45–54 | 55–64 | 65–74 | 75–84 | 85+ | |
|---|---|---|---|---|---|---|---|
| Statins | M | 6.1 | 26.0 | 56.7 | 67.5 | 25.5 | 2.6 |
| F | 2.0 | 10.4 | 38.5 | 57.0 | 21.6 | 2.4 | |
| Beta blockers | M | 20.9 | 55.6 | 103.5 | 139.3 | 119.4 | 54.4 |
| F | 30.0 | 63.5 | 108.6 | 152.0 | 146.4 | 73.6 | |
| ACE inhibitors | M | 11.3 | 40.4 | 94.4 | 149.9 | 170.3 | 134.6 |
| F | 8.0 | 31.0 | 72.7 | 122.0 | 151.3 | 117.5 |
From the data in Table 2, expected prescribing rates were calculated separately for statins, beta-blockers, and ACE inhibitors. The age-sex specific rates in the above table were applied to the same age-sex groups within the registered patient populations of all GP practices in the study. For example, to calculate the expected rate of statin prescribing for a GP practice, the total number of registered patients in each of the age-sex groups was multiplied by the corresponding rate of prescribing for that age-sex group. The individual age-sex expected rates were then summed and divided by the total number of PASS-PUs. In this way, an expected rate of statin prescribing was calculated based on the demographics of the GP practice registered population. In addition, both the actual and expected prescribing rates had the same denominator (PASS-PUs). These calculations were undertaken for the three drug groups across all GP practices in the study.
Data analysis
Associations between actual and expected prescribing rates were calculated using correlation coefficients. They are presented graphically using scatterplots. Univariate analysis revealed that some prescribing rates exhibited a non-parametric distribution, with some GP practices having either particularly high or particularly low prescribing rates. Therefore, the Spearman Rank correlation coefficient was calculated (as opposed to the Pearson Product Moment correlation coefficient) since it does not rely on normally distributed data and is not influenced by outlying data points.
Results
Table 3 presents the correlation coefficients between the actual and expected prescribing rates. Results are presented for each PCT, in addition to the overall dataset. In PCT2 and PCT3, none of the correlations between actual and expected prescribing rates were statistically significant. In PCT1, there were statistically significant correlations for statins and ACE inhibitors; and in PCT4 and the combined dataset, all associations were statistically significant. The results suggest that prescribing rates in PCT4 are the most closely associated with expected prescribing rates, followed by prescribing rates for statins and ACE inhibitors in PCT1. The association between actual and expected prescribing rates for beta-blockers in PCT4 was moderate to high (0.693, p < 0.01), and those for statins and ACE inhibitors were moderate (0.541, p < 0.05 and 0.585, p < 0.01, respectively). In the combined dataset, statins and ACE inhibitors had moderate correlation coefficients (around 0.5, p < 0.01), although beta-blockers had a low coefficient (0.259, p < 0.01).
Table 3.
Correlations between actual and expected prescribing rates
| Drug group | PCT1 | PCT2 | PCT3 | PCT4 | Combined |
|---|---|---|---|---|---|
| Statins | 0.286* | −0.196 | 0.096 | 0.541* | 0.498** |
| ACE inhibitors | 0.381** | −0.073 | 0.017 | 0.585** | 0.484** |
| Beta-blockers | 0.079 | 0.146 | 0.075 | 0.693** | 0.259** |
NOTE:
correlation significant at 0.01 level
correlation significant at 0.05 level.
The results in Table 3 are useful in terms of general associations between actual and expected prescribing rates, although scatterplots help us to identify individual GP practices that seem to be either prescribing higher or lower rates than may be expected. In addition, the scatterplots allow us to visualize the differences between PCTs, which cannot be seen in the correlation coefficients.
Figure 1 presents a scatterplot of actual and expected prescribing rates for statins, whereby each marker on the graph is an individual GP practice. In order that differences or similarities between PCTs can be identified, each GP practice has been marked with their respective PCT.
Figure 1.
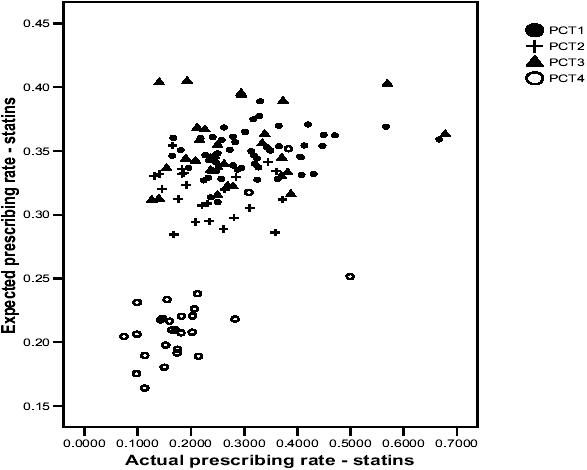
Scatterplot of actual and expected prescribing rates for statins.
The correlation coefficient suggested a modest, positive association, which can be seen on the scatterplot. However, the scatterplot reveals large differences between PCT4 and the other PCTs, and also between individual GP practices within PCTs. For example, in PCT3, there is an almost 7-fold difference in actual prescribing rates between GP practices, although the difference in expected prescribing rates is less than 3-fold. In PCT4, the majority of GP practices are located in the bottom left-hand corner of the graph (low actual and expected prescribing rates) although there are 3 outlying GP practices which seem to be quite different. Two of these GP practices are located amongst GP practices in the other PCTs and another is located on its own, with a suggestion of a relatively high actual prescribing rate in comparison to its expected prescribing rate. If one were to draw a vertical line on the scatterplot, there would be a number of GP practices with the same actual prescribing rate, although the expected prescribing rates would differ markedly.
Figures 2 and 3 present similar patterns to Figure 1, whereby GP practices in PCT4 are generally situated at the bottom left-hand corner of the graphs (with a few exceptions), which suggests that they have lower actual and expected prescribing rates for ACE inhibitors and beta-blockers than GP practices in the other PCTs. However, the actual prescribing rates of many GP practices in PCT4 are similar to many of those in the other PCTs, although the expected prescribing rates in the other PCTs tend to be much higher. Again, one could draw a vertical line on both scatterplots and identify GP practices with similar actual prescribing rates but vastly differing expected prescribing rates. The main message to take from all three scatterplots relates to the variability between GP practices in the association between actual and expected prescribing rates.
Figure 2.
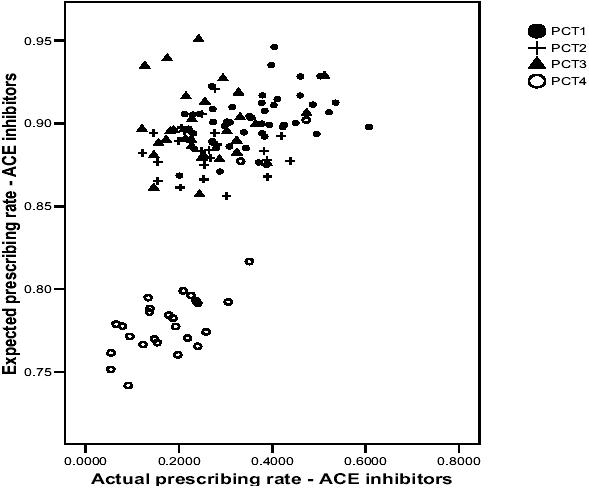
Scatterplot of actual and expected prescribing rates for ACE inhibitors.
Figure 3.
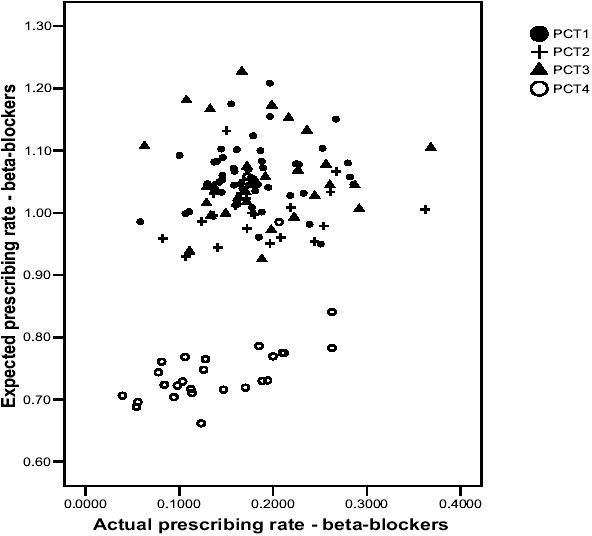
Scatterplot of actual and expected prescribing rates for betablockers.
Discussion and conclusions
Main strengths
First, the study was based on all GP practices in 4 PCTs, rather than a random sample such as those in the GPRD. Therefore, the results are directly applicable to the PCTs and enable them to develop local policies/guidance without the need to infer from GP practices in other areas. Second, we used prescribing rates based on ADQs, which are more applicable to UK general practice, and also based on the expected prevalence of treated CHD (PASS-PUs). As already stated, international comparisons may wish to use DDDs. Third, we developed expected prescribing rates for all GP practices which may be used by the PCTs to audit changes in the equity of prescribing rates over time. Finally, we produced scatterplots which enable the identification of individual GP practices which seem to either have higher or lower actual than expected prescribing rates. Further work could then be undertaken within these GP practices to understand the reasons behind their apparent inequitable prescribing rates, and subsequently, to provide education and support to make their prescribing rates more equitable.
Main weaknesses
First, ecological analysis cannot be used to infer causal relationships or to infer similar relationships at an individual level (the ecological fallacy). Second, PACT data refer only to NHS scripts that have been dispensed at pharmacies, rather than all prescriptions issued by GPs. Third, the data on statin prescribing rates is based on 1999–2000 data, which may be slightly out of date given the recent increases in statin prescribing. However, we have no evidence that this increase has increased the equity of prescribing rates, since it may have increased at a similar rate across all GP practices. Nevertheless, it may be useful to provide data for 2003–2004 to confirm or reject this. An update of prescribing data would also be useful for ACE inhibitors and beta-blockers. Fourth, the data used to develop the expected prescribing rates may not necessarily equate to healthcare need, since prescribing is also influenced by supply and demand elements. Nevertheless, the age-sex prescribing rates are similar to the age-sex rates of treated CHD (see Table 1) and therefore may reflect the demographic nature of CHD. However, even though age seems to be the most important risk factor for CHD (Tunstall-Pedoe et al 1999), these do not take into account the multifactorial nature of CHD risk factors and therefore do not reflect the totality of CHD healthcare needs.
Key points
To our knowledge, this is the first paper reporting associations between actual and expected prescribing rates, and as such, our findings represent new ground in the exploration of the equity of prescribing rates. This paper explored the relationship between actual and expected GP practice prescribing rates for statins, ACE inhibitors, and beta-blockers. In the combined dataset, there was a moderately strong positive correlation (p < 0.01) for statins and ACE inhibitors, and a weaker correlation for beta-blockers (p < 0.01). Within the individual PCTs, there was a large degree of variation. In PCT4, there were moderate to fairly high correlations (p < 0.05) for all three drug groups, although in PCT2 and PCT3 there were no statistically significant associations for any drug groups. In PCT1, there were fairly low correlations (p < 0.05) for statins and ACE inhibitors, although beta-blockers exhibited no association. Therefore, from these findings, we can observe variability between PCTs in terms of the relationship between actual and expected prescribing rates. Increasing rates of actual prescribing are associated with increasing rates of expected prescribing in PCT4, the combined dataset and (to a lesser extent) in PCT1, although this is not the case in PCT2 and PCT3. Therefore, this may be suggestive of inequities in prescribing rates in PCT2 and PCT3, since one would expect higher correlations between actual and expected prescribing rates in these PCTs.
The issue of variability is made even more apparent in the scatterplots, both between PCTs and between individual GP practices. GP practices in PCT4 tended to be located in the bottom left-hand corner of the scatterplots, which indicates lower rates of actual and expected prescribing, whereas GP practices in the other PCTs seemed to be intermingled into a general “cloud” of data points. One of the main purposes of producing the scatterplots was to highlight the point that one could draw a vertical line almost anywhere on the graphs and locate GP practices with very similar actual prescribing rates but vastly different expected prescribing rates. Since the expected prescribing rates are calculated from data which exhibit similar patterns to age-sex CHD prevalence data, this may be suggestive of inequities in prescribing rates.
Whilst the clinical and epidemiological data on statins, beta-blockers, and ACE inhibitors has allowed for the development of evidence-based guidelines and evidence-based prescribing, this paper suggests that in practice, actual prescribing rates may not be related to healthcare need. Further research needs to concentrate on verifying or falsifying these claims on a more micro-level analysis (eg, clinical audit in specific GP practices identified in the study) and on exploring the reasons why such a relationship exists (eg, qualitative studies with GPs, practice nurses, and patients in the identified GP practices). This strategy may enable educational tools to be developed that would facilitate more evidence-based prescribing, but may also identify particular patient groups who do not present symptoms of CHD (ie, unmet need) and therefore may require educational outreach or targeted screening to increase their consultations and ultimately prescribing to these groups. Although we have focussed on three drugs for the prevention of CHD, a similar approach may be taken in any number of therapeutic areas to explore the equity of prescribing or other healthcare services.
Acknowledgments
We thank all NHS staff who provided access to both PACT data and data on GP practice lists. Paul Ward received a Health Services Research Training Fellowship from the North West NHS Executive to carry out the study on which this paper is based.
References
- Baxter C, Jones R, Corr L. Time trend analysis and variations in prescribing lipid lowering drugs in general practice. BMJ. 1998;317:1134–5. doi: 10.1136/bmj.317.7166.1134. [DOI] [PMC free article] [PubMed] [Google Scholar]
- Blood Pressure Lowering Treatment Trialists' Collaboration. Effects of ACE inhibitors, calcium antagonists, and other blood-pressure-lowering drugs: results of prospectively designed overviews of randomised trials. Lancet. 2000;356:1955–64. doi: 10.1016/s0140-6736(00)03307-9. [DOI] [PubMed] [Google Scholar]
- Bogle SM, Harris CM. Measuring prescribing: the shortcomings of the item. BMJ. 1994;308:637–40. doi: 10.1136/bmj.308.6929.637. [DOI] [PMC free article] [PubMed] [Google Scholar]
- Bradshaw J. A taxonomy of social need. In: McLachlan G, editor. Problems and progress in medical care. Oxford: Nuffield Provincial Hospital Trust; 1972. [Google Scholar]
- Bradshaw J. The conceptualisation and measurement of need. In: Popay J, Williams G, editors. Researching the people's health. London: Routledge; 1994. [Google Scholar]
- Bradshaw N, Fone DL, Walker R. Explaining variation in statin prescribing: a practice based analysis. Pharm J. 1999;263:R19. [Google Scholar]
- Byington RP, Jukema W, Salonen JT, et al. Reduction in cardiovascular events during pravastatin therapy. Pooled analysis of clinical events of the pravastatin atherosclerosis intervention program. Circulation. 1995;92:2419–25. doi: 10.1161/01.cir.92.9.2419. [DOI] [PubMed] [Google Scholar]
- Chapman SR. Prescribing information systems; making sense of primary care data. J Clin Pharm Ther. 2001;26:235–9. doi: 10.1046/j.1365-2710.2001.00352.x. [DOI] [PubMed] [Google Scholar]
- Department of Health. The new NHS: modern, dependable. London: HMSO; 1998. [Google Scholar]
- Department of Health. Primary care trusts, establishing better services. London: NHS Executive; 1999. [Google Scholar]
- Department of Health. National service frameworks for coronary heart disease. London: The Stationary Office; 2000. [Google Scholar]
- Department of Health. Shifting the balance of power: next steps. London: The Stationary Office; 2002. [Google Scholar]
- Ebrahim S, Davey-Smith G, McCabe C, et al. Cholesterol and coronary heart disease: screening and treatment. Q Health Care. 1998;7:232–9. doi: 10.1136/qshc.7.4.232. [DOI] [PMC free article] [PubMed] [Google Scholar]
- Eccles M, Freemantle N, Mason J. North of England evidence based development project: guideline for angiotensin converting enzyme inhibitors in primary care management of adults with symptomatic heart failure. BMJ. 1998;316:1369–75. doi: 10.1136/bmj.316.7141.1369. [DOI] [PMC free article] [PubMed] [Google Scholar]
- Frischer M, Chapman SR. Issues and directions in prescribing analysis. In: Panton R, Chapman SR, editors. Medicines management. London: Pharmaceutical Pr; 1998. [Google Scholar]
- Goddard M, Smith P. Equity of access to health care services: theory and evidence from the UK. Soc Sci Med. 2001;53:1149–62. doi: 10.1016/s0277-9536(00)00415-9. [DOI] [PubMed] [Google Scholar]
- Gottlieb SS, McCarter RJ, Vogel RA. Effect of beta-blockade on mortality among high-risk and low-risk patients after myocardial infarction. N Engl J Med. 1998;339:489–97. doi: 10.1056/NEJM199808203390801. [DOI] [PubMed] [Google Scholar]
- Hart TJ. The inverse care law. Lancet. 1971;1:405–12. doi: 10.1016/s0140-6736(71)92410-x. [DOI] [PubMed] [Google Scholar]
- Julian D. An integrated approach to the management of patients after the acute phase of myocardial infarction. In: Yusuf S, Cairns J, Camm A, et al., editors. Evidence-based cardiology. London: BMJ Publ Group; 1998. [Google Scholar]
- Le Grand J. The strategy of equality. London: Allen and Unwin; 1982. [Google Scholar]
- Lloyd DC, Harris CM, Roberts DJ. Specific therapeutic group age sex related prescribing units (STAR-PUs): weightings for analysing general practices' prescribing in England. BMJ. 1995;311:991–4. doi: 10.1136/bmj.311.7011.991. [DOI] [PMC free article] [PubMed] [Google Scholar]
- Lloyd DC, Scrivener G. Prescribing at the primary care group level: census data and prescribing indicators. J Clin Pharm Ther. 2001;26:93–101. doi: 10.1046/j.1365-2710.2001.00320.x. [DOI] [PubMed] [Google Scholar]
- MacMahon S, Rodgers A, Neal B, et al. Blood pressure lowering for the secondary prevention of myocardial infarction and stroke. Hypertension. 1997;29:537–8. doi: 10.1161/01.hyp.29.2.537. [DOI] [PubMed] [Google Scholar]
- Majeed A, Cook DG, Evans N. Variations in general practice prescribing costs – implications for setting and monitoring prescribing budgets. Health Trends. 1996;28:52–5. [Google Scholar]
- Majeed A, Evans N, Head P. What can PACT tell us about prescribing in general practice? BMJ. 1997;315:1515–19. doi: 10.1136/bmj.315.7121.1515. [DOI] [PMC free article] [PubMed] [Google Scholar]
- Majeed A, Moser K, Maxwell R. Age, sex and practice variations in the use of statins in general practice in England and Wales. J Public Health Med. 2000;22:275–9. doi: 10.1093/pubmed/22.3.275. [DOI] [PubMed] [Google Scholar]
- Mehta RH, Eagle KA. Secondary prevention in acute myocardial infarction. BMJ. 1998;316:838–42. doi: 10.1136/bmj.316.7134.838. [DOI] [PMC free article] [PubMed] [Google Scholar]
- Morton-Jones T, Pringle M. Explaining variations in prescribing costs across England. BMJ. 1993;306:1731–4. doi: 10.1136/bmj.306.6894.1731. [DOI] [PMC free article] [PubMed] [Google Scholar]
- [ONS] Office for National Statistics. Key statistics from general practice. London: ONS; 1998a. [Google Scholar]
- [ONS] Office for National Statistics. Key statistics from general practice. Table 6A1: Prevalence of treated CHD per 1000 patients by age, sex and country/region, 1994–1998. London: ONS; 1998b. [Google Scholar]
- Packham C, Pearson J, Robinson J, et al. Use of statins in general practices, 1996–8: cross sectional study. BMJ. 2000;320:1583–4. doi: 10.1136/bmj.320.7249.1583. [DOI] [PMC free article] [PubMed] [Google Scholar]
- Patel MG, Wright DJ, Gill PS, et al. Prescribing of lipid lowering drugs to South Asian patients: ecological study. BMJ. 2002;325:25–6. doi: 10.1136/bmj.325.7354.25. [DOI] [PMC free article] [PubMed] [Google Scholar]
- Peckham S, Taylor P. Public health and primary care. In: Orme J, Powell J, Taylor P, et al., editors. Public health for the 21st Century. New Perspectives on policy, participation and practice. Maidenhead: Open Univ Pr; 2003. [Google Scholar]
- Pignone M, Phillips C, Mulrow C. Use of lipid lowering drugs for primary prevention of coronary heart disease: meta-analysis of randomised trials. BMJ. 2000;321:983–6. doi: 10.1136/bmj.321.7267.983. [DOI] [PMC free article] [PubMed] [Google Scholar]
- Pringle M, Morton-Jones T. Using unemployment rates to predict prescribing trends in England. Br J Gen Pract. 1994;44:53–6. [PMC free article] [PubMed] [Google Scholar]
- [PSU] Prescribing Support Unit. Defined daily doses, prescribed daily doses and average daily quantities. Leeds: PSU; 1997. [Google Scholar]
- [PSU] Prescribing Support Unit. Average daily quantities and STAR(97)-PUs. Leeds: PSU; 2000. [Google Scholar]
- Rice N, Dixon P, Lloyd DC, et al. Derivation of a needs based capitation formula for allocating prescribing budgets to health authorities and primary care groups in England: regression analysis. BMJ. 2000;320:284–8. doi: 10.1136/bmj.320.7230.284. [DOI] [PMC free article] [PubMed] [Google Scholar]
- Sacks FM, Pfeffer MA, Moye LA, et al. The effect of pravastatin on coronary events after myocardial infarction in patients with average cholesterol levels. Cholesterol and Recurrent Events Trial Investigators. N Engl J Med. 1996;335:1001–9. doi: 10.1056/NEJM199610033351401. [DOI] [PubMed] [Google Scholar]
- Shepherd J, Cobbe S, Ford I, et al. Prevention of coronary heart disease with pravastatin in men with hypercholesterolemia. West of Scotland Coronary Prevention Study Group. N Engl J Med. 1995;333:1301–7. doi: 10.1056/NEJM199511163332001. [DOI] [PubMed] [Google Scholar]
- Tunstall-Pedoe H, Kuulasmaa K, Mahonen M, et al. Contribution of trends in survival and coronary-event rates to changes in coronary heart disease mortality: 10-year results from 37 WHO MONICA project populations. Monitoring trends and determinants in cardiovascular disease. Lancet. 1999;353:1547–57. doi: 10.1016/s0140-6736(99)04021-0. [DOI] [PubMed] [Google Scholar]
- Walley T, Roberts DJ. Average daily quantities: a tool for measuring prescribing volume in England. Pharmacoepidemiol Drug Saf. 2000;9:55–8. doi: 10.1002/(SICI)1099-1557(200001/02)9:1<55::AID-PDS467>3.0.CO;2-H. [DOI] [PubMed] [Google Scholar]
- Ward PR, Noyce PR, St Leger AS. Developing prevalence-based prescribing units for analysing variations in general practitioner prescribing: a case study using statins. J Clin Pharm Ther. 2003;28:23–9. doi: 10.1046/j.1365-2710.2003.00451.x. [DOI] [PubMed] [Google Scholar]
- Ward PR, Noyce PR, St Leger AS. Are GP practice prescribing rates for coronary heart disease drugs equitable? A cross sectional analysis in four primary care trusts in England. J Epidemiol Community Health. 2004a;58:89–96. doi: 10.1136/jech.58.2.89. [DOI] [PMC free article] [PubMed] [Google Scholar]
- Ward PR, Noyce PR, St Leger AS. Multivariate regression analysis of associations between GP prescribing rates for CHD drugs and health care needs indicators. J Epidemiol Community Health. 2004b In press. [PMC free article] [PubMed] [Google Scholar]
- [WHO] World Health Organisation. Guideline for defined daily doses. Oslo: WHO Collaborating Centre for Drug Statistics; 1991. [Google Scholar]
- Yusuf S, Sleight P, Pogue J, et al. Effects of an angiotensin-converting-enzyme inhibitor, ramipril, on cardiovascular events in high-risk patients. The Heart Outcomes Prevention Evaluation Study Investigators. N Engl J Med. 2000;342:145–53. doi: 10.1056/NEJM200001203420301. [DOI] [PubMed] [Google Scholar]