

Abstract
Objectives
To illustrate the application of the Differential Item and Test Functioning (DFIT) method using English and Spanish versions of the Mini-Mental State Examination (MMSE).
Subjects
Study participants were 65 years of age or older and lived in North Manhattan, New York. Of the 1578 study participants who were administered the MMSE 665 completed it in Spanish.
Measures
The MMSE contains 20 items that measure the degree of cognitive impairment in the areas of orientation, attention and calculation, registration, recall and language, as well as the ability to follow verbal and written commands.
Research Design
After assessing the dimensionality of the MMSE scale, item response theory person and item parameters were estimated separately for the English and Spanish sample using Samejima’s 2-parameter graded response model. Then the DFIT framework was used to assess differential item functioning (DIF) and differential test functioning (DTF).
Results
Nine items were found to show DIF; these were items that ask the respondent to name the correct season, day of the month, city, state, and 2 nearby streets, recall 3 objects, repeat the phrase no ifs, no ands, no buts, follow the command, “close your eyes,” and the command, “take the paper in your right hand, fold the paper in half with both hands, and put the paper down in your lap.” At the scale level, however, the MMSE did not show differential functioning.
Conclusions
Respondents to the English and Spanish versions of the MMSE are comparable on the basis of scale scores. However, assessments based on individual MMSE items may be misleading.
Keywords: Mini-Mental State Examination, item response theory, Spanish, DIF, DFIT
The effect of biased survey items or multiple-item scales on statistical analyses can be that observed group differences in means, or in the patterns of correlations of a biased item or scale with other variables, are artifactual and substantively misleading. In technical terms, bias is referred to as differential functioning. When differential functioning occurs, the probability of an individual endorsing an item—in the case of a dichotomous item—or endorsing a category—in the case of a polytomous (ordinal) item—is influenced by an individual’s membership in a group as well as an individual’s standing on the latent trait of interest (eg, cognitive disability). For example, if men and women of equal math ability have unequal probabilities of answering a particular item on a math test correctly, then the item functions differently with respect to gender. In the case of the Mini-Mental State Examination (MMSE), items that function differentially may result in the under- or overidentification of cognitive impairment in one group or another.
Various statistical methods grounded in item response theory (IRT) have been described for evaluating differential functioning.1,2 In the present study, we evaluated the Spanish version of the MMSE for differential item functioning (DIF) and differential scale functioning (DTF) using the DFIT framework.3 Whereas most methods for assessing differential functioning focus exclusively on item level evaluations, the DFIT framework provides an approach for simultaneously evaluating differential functioning at both the item and scale levels. Whether item or scale level evaluations are more important to a practitioner will depend on the purpose of the differential functioning analysis. If the analysis is in the context of scale development, in which items are selected from a pool of potential items, DIF may be more important. Typically, items showing DIF are removed from the pool. However, if the purpose of analysis is to examine the comparability of individuals belonging to 2 or more groups using an existing scale, as often is the case in disparities research, then scale level analysis may be of greater interest. Because much of the IRT literature is rooted in educational research, differential functioning at the scale-level is commonly referred to as differential “test” functioning or DTF.
METHODS
The DFIT Framework
The DFIT framework provides estimates of differential functioning at the item and scale levels.3,4 Before the DFIT framework can be applied, however, separate IRT item parameter estimates for a reference group (eg, English) and a comparison (focal) group (eg, Spanish) must be obtained. Because the 2 sets of item parameters are obtained from separately estimated IRT models, they must be placed on a common metric before comparisons to evaluate differential functioning can be made. This process is called linking. Once linked, the 2 sets of item parameters can be used to make item and scale level assessments of differential functioning using the DFIT framework. More detail regarding the estimation of item parameters, and the linking procedure is provided below. An important point is that when using internal methods of DIF detection, such as the likelihood ratio test that is included in many IRT software packages, there is no need for linking because parameters are estimated in a multigroup rather than separate group analysis.
The central premise of the DFIT framework is that differential functioning can be assessed by contrasting a focal group member’s item and scale expected scores, computed using the reference group item parameter (eg, English), with the same member’s scores computed using the focal group item parameters (eg, Spanish). According to Raju et al,3 if items and scales function similarly in the 2 groups, these 2 sets of item parameters will yield similar sets of item and scale scores. The greater the difference between the 2 sets of scores at the scale level, the greater the impact of differential functioning.
In IRT, an item’s true score (t) for polytomously-scored items is the item’s expected score (ESsi), conditional on a survey respondent’s position on the latent trait (eg, cognitive disability) estimated as theta (Θ). Thus the true score (tis) for a polytomously scored item i and examinee s is computed as follows:
| (1) |
where Xik is the score or weight for category k, m is the number of categories, and Pik is the probability of responding in category k. The only difference between the application of the DFIT framework to dichotomous and polytomous items is in the computation of an item’s true score – for dichotomously-scored items, the true score is simply the probability of endorsing an item conditional on a survey respondent’s position on the latent trait scale (Θ). Once item true scores and the scale true score are known the application of the DFIT framework to dichotomous and polytomous items is identical.
Once the item parameters for the reference (R) and the focal (F) groups have been estimated, and the reference group parameters are linked so that they are on the same metric as the focal group parameters, the focal group Θ distribution is used to compute 2 true scores (tis) for every item. That is, for every survey respondent who is a member of the focal group, a true score for each item is computed using the focal group parameters and another is computed using the linked reference group parameters. According to Raju et al,3 if the 2 item true scores are not equal, then an item is functioning differentially.
Summing the expected item scores for items in a scale will yield the scale true test score. Thus the true scale score for a scale (Ts) and respondent s is given by:
| (2) |
where n is the number of items in the scale. Summing the expected item scores generated with the reference group item parameters yields a reference group true scale score (TR), and summing the expected item scores generated with the focal group item parameters yields a focal group true scale score (TS). The null hypothesis for differential functioning at the scale level is:
| (3) |
Using logic analogous to the test for differential functioning at the item level, Raju et al3 argue that if the 2 scale true scores are not equal, then a scale is functioning differentially.
To evaluate differential functioning at the scale level, the DFIT framework defines the DTF index. According to Raju et al,3 the DTF index for an individual respondent s is defined as follows:
| (4) |
whereas the DTF index across all focal group respondents is defined as follows:
| (5) |
or equivalently as:
| (6) |
where fF(θ) is the density function of θ for the focal group. Equation 6 can be rewritten as:
| (7) |
where μD is the difference in the mean scale scores for the focal group respondents and the mean scale scores for the same respondents, using the reference group item parameters; and σD2 is the variance of the difference in scores.
To evaluate differential functioning at the item level, the DFIT framework defines 2 indices: the CDIF index and NCDIF index. According to Raju et al,3 if
| (8) |
where tsiF is the item true score for a focal group respondent s and item i as a member and tsiR is the item true score for the same item and same focal group respondent using the reference group item parameter, then
| (9) |
where n is the number of items in a scale. According to Raju et al,3 Equation 9 can be rewritten as follows:
| (10) |
where Cov (di, D) is the covariance of the difference in item true scores (di) and the difference in scale true scores (D), and μdi and μD are the means of dis and Ds, respectively. When DTF is formulated in this way, it is easy to see how differential functioning at the item level (DIFi) can be written as:
| (11) |
Raju et al3 refer to this formulation of DIF (Equation 11) as compensatory DIF (CDIF). If DIF is expressed as CDIF, then DTF can be rewritten as:
| (12) |
In other words, the CDIF index provides an estimate of each item’s contribution to differential functioning at the scale level and the summation of the CDIF index across all items in a scale is a measure of differential functioning at the scale level (DTF). Because the CDIF index can have a positive or a negative value and items with positive and negative values can cancel each other at the scale level, the CDIF index is referred to as the compensatory DIF index. For example, if one item in a scale yields a CDIF value favoring the focal group and second item yields a CDIF value favoring the reference group, the net effect can be that there is no differential functioning at the scale level, assuming the 2 offsetting effects are of approximately equal magnitude.
The second measure of item level differential functioning proposed by Raju et al3 is referred to as noncompensatory DIF (NCDIF). In contrast to the CDIF index, the NCDIF index assumes that all items other than the one under study are free from differential functioning. The NCDIF index may only take on positive values, thus offsetting DIF effects are not possible with the NCDIF index. In the dichotomous case, NCDIF is closely related to other existing DIF indices such as Lord’s χ2 and the unsigned area. Assuming all other items are free from DIF (eg, dj = 0 for all j ≠ i where i is the item being studied), equation 10 can be rewritten as:
| (13) |
NCDIF is computed in the same fashion as the unsigned probability difference (UPD).5 It provides descriptive information comparable to an effect size or weighted magnitude of the DIF in the region of the ICC reflecting the highest focal group response. The latter method sums the squared difference in conditional probabilities between the reference group and the studied (focal) group. For each subject in the focal group, 2 true scores are computed, one based on the subject’s estimated location and slope parameters for the focal group, and the other based on the estimated location and slope parameters for the reference group. In summary, each subject’s difference score is squared, and these squared difference scores are summed for all subjects to obtain NCDIF. NCDIF is useful for identification of items with DIF and when evaluating individual items for retention or elimination.
Information from the CDIF indices can be used at the scale level to decide which items to drop from a scale to render differential functioning nonsignificant. Because the value of CDIF for a given item reflects the contribution of other items to DTF as well as its own, an item removal index (2CDIF-NCDIF) that accounts for this dependency, and therefore, contains that item’s total contribution to DTF has been proposed.6 The item removal index is used to drop items from a scale, beginning with items with the largest removal index value, until the DTF index is no longer significant. According to this procedure, items that are removed are designated as displaying DIF based on the CDIF and DTF indices. This index is relevant if the value of DTF exceeds the cutoff, which for this example is 0.558 (see the section “Assessment of Differential Functioning”). This index was not used for item selection for this example, because the cutoff was not exceeded.
Participants
The data for these analyses came from a case registry study of dementia developed among individuals 65 years and older living in 13 census tracks in North Manhattan, New York. The data set is described in more detail elsewhere in this special issue. Analyses were performed comparing item responses of those individuals interviewed in Spanish (n = 665) with those individuals interviewed in English (n = 913).
Among respondents completing the English version of the MMSE, 2.4% (n = 22) were missing responses to at least one item; among the respondents completing the Spanish version of the MMSE, 1.5% (n = 10) were missing responses to at least one item. However, because IRT programs can estimate person and item parameters from the remaining set of items with answers, it was not necessary to delete any respondents from the IRT analyses because of missing values (ie, case-wise deletion), nor was it necessary to impute values for items with missing responses. All respondents (n = 1578) were included in the IRT analysis.
Instrument
For a detailed description of the MMSE, please see the companion article by Ramirez et al7 In brief, the MMSE contains 20 items that, in aggregate, measure the degree of cognitive impairment in the areas of orientation, attention and calculation, registration, recall and language, as well as the ability to follow verbal and written commands.8 In the present analyses, the “WORLD backwards” and “serial 7s” items were examined separately, resulting in a total of 21 items rather than 20.
Analysis Plan
Descriptive Statistics
Descriptive statistics, including the number of response categories for each item, item means and standard deviations, item-scale correlations corrected for overlap, and the coefficient alpha with item deletion, are provided (Table 1). In all analyses, dichotomous items were coded 0 or 1, polytomous items with 4 response categories were coded 0, 1, 2, and 3 and polytomous items with 6 response categories were coded 0, 1, 2, 3, 4, and 5. For all items, a higher score indicates a greater degree of cognitive impairment.
TABLE 1.
Descriptive Statistics for English and Spanish MMSE Items
|
English (Alpha = 0.89) |
Spanish (Alpha = 0.87) |
|||||||||
|---|---|---|---|---|---|---|---|---|---|---|
| Item | Item Content | Categories | Mean | SD | Item-Test | Alpha* | Mean | SD | Item-Test | Alpha* |
| MMSE 1 | Doesn’t state year correct | 2 | 0.30 | 0.46 | 0.69 | 0.88 | 0.26 | 0.44 | 0.68 | 0.86 |
| MMSE 2 | Doesn’t state season correct | 2 | 0.28 | 0.45 | 0.67 | 0.89 | 0.42 | 0.49 | 0.52 | 0.86 |
| MMSE 3 | Doesn’t state correct day of month | 2 | 0.50 | 0.50 | 0.54 | 0.89 | 0.37 | 0.48 | 0.58 | 0.86 |
| MMSE 4 | Doesn’t state correct day of week | 2 | 0.28 | 0.45 | 0.67 | 0.89 | 0.24 | 0.42 | 0.62 | 0.86 |
| MMSE 5 | Doesn’t state correct month | 2 | 0.28 | 0.45 | 0.66 | 0.89 | 0.25 | 0.43 | 0.64 | 0.86 |
| MMSE 6 | Doesn’t state correct state | 2 | 0.20 | 0.40 | 0.61 | 0.89 | 0.43 | 0.50 | 0.43 | 0.86 |
| MMSE 7 | Doesn’t state correct city | 2 | 0.12 | 0.33 | 0.66 | 0.89 | 0.16 | 0.37 | 0.63 | 0.86 |
| MMSE 8 | Doesn’t state 2 nearby streets | 2 | 0.28 | 0.45 | 0.68 | 0.89 | 0.27 | 0.44 | 0.65 | 0.86 |
| MMSE 9 | Doesn’t state correct floor | 2 | 0.19 | 0.39 | 0.68 | 0.89 | 0.13 | 0.34 | 0.62 | 0.86 |
| MMSE 10 | Doesn’t correctly identify type of place | 2 | 0.21 | 0.41 | 0.67 | 0.89 | 0.14 | 0.34 | 0.62 | 0.86 |
| MMSE 11 | Apple, table, penny errors | 4 | 0.35 | 0.91 | 0.62 | 0.88 | 0.22 | 0.75 | 0.62 | 0.86 |
| MMSE 12 | Errors in serial 7 subtraction | 6 | 2.98 | 1.86 | 0.56 | 0.90 | 2.88 | 1.79 | 0.50 | 0.88 |
| MMSE 13 | Errors in spelling WORLD backwards | 6 | 2.21 | 1.91 | 0.71 | 0.89 | 2.25 | 1.88 | 0.64 | 0.87 |
| MMSE 14 | Errors in recalling 3 objects | 4 | 2.14 | 1.11 | 0.48 | 0.89 | 1.86 | 1.14 | 0.45 | 0.86 |
| MMSE 15 | Doesn’t name pencil | 2 | 0.11 | 0.31 | 0.64 | 0.89 | 0.05 | 0.23 | 0.58 | 0.86 |
| MMSE 16 | Doesn’t name wristwatch | 2 | 0.12 | 0.33 | 0.68 | 0.89 | 0.06 | 0.24 | 0.60 | 0.86 |
| MMSE 17 | Errors in repeating phrase | 2 | 0.39 | 0.49 | 0.48 | 0.89 | 0.11 | 0.31 | 0.54 | 0.86 |
| MMSE 18 | Doesn’t close eyes | 2 | 0.18 | 0.39 | 0.69 | 0.89 | 0.19 | 0.39 | 0.66 | 0.86 |
| MMSE 19 | Errors following instructions with paper | 4 | 0.83 | 1.00 | 0.72 | 0.88 | 0.54 | 0.87 | 0.63 | 0.85 |
| MMSE 20 | Error writing complete sentence | 2 | 0.29 | 0.46 | 0.69 | 0.89 | 0.30 | 0.46 | 0.61 | 0.86 |
| MMSE 21 | Error copying design | 2 | 0.56 | 0.50 | 0.49 | 0.89 | 0.54 | 0.50 | 0.44 | 0.86 |
Alpha if item deleted form scale.
Assessing the Dimensionality of the Data
Before implementing the DFIT framework it is necessary to determine whether a one-dimensional IRT model is appropriate for the English and Spanish MMSE data. Although multidimensional IRT models have been described,9 only one-dimensional IRT models have been used in the context of the DFIT framework. In a one-dimension scale, only one latent factor is hypothesized to influence the responses to the items in a scale. Technically, this means that after controlling for the common variance among the items in a scale, the residual error terms are uncorrelated.10
To assess model fit, the following widely used model fit indices associated with confirmatory factor analyses (CFA) were examined: the comparative fit index (CFI), the Tucker-Lewis Fit Index (TLI), the root mean square error of approximation (RMSEA) and the standardized root mean square residual (SRMR). According to Yu11 the following cutoffs indicate good model fit in categorical data: TLI >0.95, CFI >0.95, RMSEA <0.06, and SRMR <0.08. MPLUS12 in addition to other CFA methods were used to examine dimensionality (see also the companion paper by Jones et al13 in this special issue). The fit of a one factor model to the English and Spanish MMSE data was tested using CFA; these results are summarized in the work by Ramirez et al.7 The results of these analyses indicated that the data were sufficiently one-dimensional to proceed with IRT analyses.
Estimation of IRT Models
Samejima’s 2-parameter graded response model,14,15 as implemented in PARSCALE 4.1,16 was used to obtain person and item parameters. Generally, the program was run using default settings. The 2 exceptions were that the maximum number of estimation cycles was increased to 200 and the range and number of estimation quadratures was increased to −6.0 to 6.0 at 0.25 intervals.
The graded response model provides estimates of theta (eg, cognitive impairment) for every respondent in the sample, one slope parameter and j-1 threshold parameters—where j is the number of response options—for every item in the scale. For example, the graded response model yields one slope (α) and one location parameter (b1) for dichotomous items and one slope (α) and 5 category threshold parameters (b1, b2, b3, b4, b5) for polytomous items with 6 response options. Person and item parameters were estimated separately for the English and Spanish samples. Because a latent variable (theta) is estimated, there is no predetermined metric for the disability distribution; thus, to identify the model, PARSCALE arbitrarily assigns the theta scale a distribution with a mean of 0 and a standard deviation of 1.0 with respect to the sample being analyzed.
Linking of Metrics
The arbitrary assignment of a mean of 0 and a standard deviation of 1.0 to English and Spanish theta distributions has important implications for conducting differential functioning analyses. Before the theta and item parameters for these 2 populations can be compared, the focal group’s (ie, Spanish) theta estimates and item parameters must be placed on the same metric as the reference group’s (ie, English) theta estimates and item parameters. This can be accomplished using a linear transformation, once the necessary linking constants have been estimated.
Several methods for estimating linking constants have been described: regression methods, mean and sigma methods, robust mean and sigma methods and characteristics curve methods.10 In the present study, we use the EQUATE program developed by Baker,17 based on Stocking and Lord’s18 iterative test characteristic curve linking procedure to estimate needed linking constants.
Once the theta estimates and item parameters for the 2 groups are placed on the same metric, the items can be analyzed for DIF using the NCDIF index and the scale can be analyzed for DTF using the CDIF and DTF indices. The NCDIF, CDIF and DTF indices were estimated using the DFIT5P software program developed by Raju.19 If some items are subsequently found to have DIF, using DFIT or other DIF software, the initial set of linking constants may be biased because some DIF items were used to estimate the linking constants. To address the problem, the linking constants were iteratively re-estimated, excluding with each iteration items identified with DIF, until all items with DIF had been eliminated from the procedure for estimating the linking constants. The remaining set of non-DIF items are commonly referred to as anchor items. Following procedures used in previous studies, the NCDIF index was used to identify and eliminate items with DIF, and the DFIT results assessing scale level differential functioning were based on the final set of linking constants.6,20,21
Assessment of Differential Functioning
Raju et al3 has proposed χ2 tests for assessing the statistical significance for the DFIT indices. In Monte Carlo simulation studies, however, Fleer22 found that these χ2 tests were overly sensitive for large sample sizes. Based on subsequent simulation studies, Fleer22 and Flowers et al23 have established cutoff values for the NCDIF and DTF indices—akin to those used in confirmatory factor analysis to assess model fit—that vary by the number of response options. For example, for dichotomous items the NCDIF cutoff is 0.006, for polytomous items with 4 response options the cutoff is 0.054; and for polytomous items with 6 response options the cutoff is 0.150. The cutoff for DTF, on the other hand, is computed by summing the NCDIF cutoff values for all items in a scale. For the MMSE scale that has sixteen dichotomous items, 3 polytomous items with 4 response options and 2 polytomous items with 6 response options, the DTF cutoff was 0.558 ([16 × 0.006] + [3 × 0.054] + [2 × 0.150]).
Summary of Steps in the Analyses
To assist the reader in understanding the use of this method, summarized below are the steps in the DIF detection process:
Perform an assessment of scale dimensionality;
Perform IRT analyses to obtain parameters and disability estimates; perform analyses separately for each group (PARSCALE16 was used in this step);
Equate the parameters (Baker’s EQUATE17 program was used in this step);
Perform DFIT analysis (DFIT5P19 was used);
Identify items that are relatively DIF-free, using NCDIF cutoffs (Table 2);
Examine CDIF and DTF to determine if values exceed the cutoff, indicating differential test (scale) functioning (in this example, DTF was 0.215, below the cutoff of 0.558);
If DTF is more than the cutoff, examine the removal index to identify items that might be removed;
Calculate expected item scores; sum the expected item scores to obtain an expected test (scale) score for each group, separately;
Plot the expected scale scores against theta (disability) for each group (see Fig. 3).
TABLE 2.
Final DFIT Results for MMSE English Versus Spanish
| Item | NCDIF Cutoff | NCDIF | CDIF | Removal Index (2CDIF-NCDIF) |
|---|---|---|---|---|
| MMSE 1 | 0.006 | 0.001 | 0.005 | 0.009 |
| MMSE 2 | 0.006 | 0.060* | −0.074 | −0.208 |
| MMSE 3 | 0.006 | 0.030* | 0.074 | 0.118 |
| MMSE 4 | 0.006 | 0.000 | 0.000 | 0.000 |
| MMSE 5 | 0.006 | 0.003 | 0.004 | 0.005 |
| MMSE 6 | 0.006 | 0.112* | −0.091 | −0.294 |
| MMSE 7 | 0.006 | 0.025* | −0.011 | −0.047 |
| MMSE 8 | 0.006 | 0.005† | −0.001 | −0.007 |
| MMSE 9 | 0.006 | 0.001 | 0.002 | 0.003 |
| MMSE 10 | 0.006 | 0.003 | 0.002 | 0.001 |
| MMSE 11 | 0.054 | 0.008 | 0.000 | −0.008 |
| MMSE 12 | 0.150 | 0.011 | 0.032 | 0.053 |
| MMSE 13 | 0.150 | 0.021 | −0.024 | −0.069 |
| MMSE 14 | 0.054 | 0.106* | 0.127 | 0.148 |
| MMSE 15 | 0.006 | 0.002 | 0.004 | 0.006 |
| MMSE 16 | 0.006 | 0.004 | 0.006 | 0.008 |
| MMSE 17 | 0.006 | 0.098* | 0.076 | 0.054 |
| MMSE 18 | 0.006 | 0.010* | −0.003 | −0.016 |
| MMSE 19 | 0.054 | 0.087* | 0.095 | 0.103 |
| MMSE 20 | 0.006 | 0.003 | −0.014 | −0.031 |
| MMSE 21 | 0.006 | 0.000 | 0.006 | 0.012 |
| DTF cutoff | 0.558 | |||
| Scale DTF | 0.215 |
NCDIF value exceeded NCDIF cutoff in final run of the DFIT program.
NCDIF value exceeded NCDIF cutoff in an earlier run of the DFIT program, and was therefore not included in the anchor set, although it evidenced only borderline DIF in the final run.
FIGURE 3.
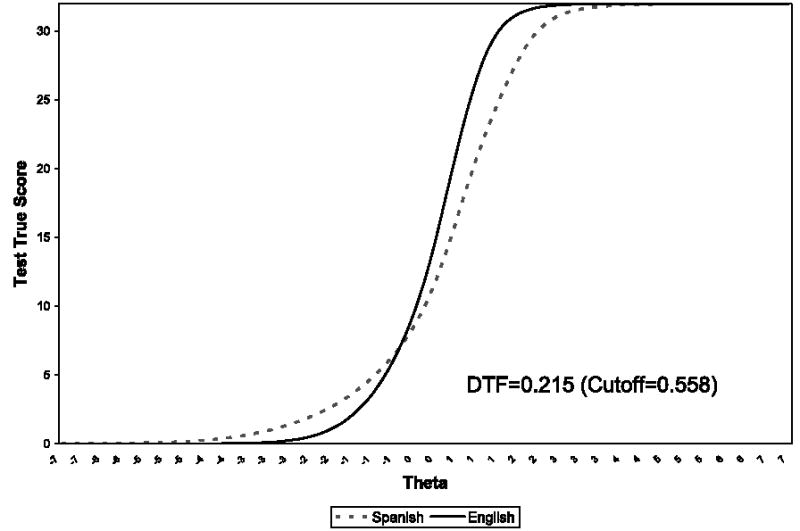
The English and Spanish test response functions for the Mini-Mental State Examination.
RESULTS
Descriptive Results
For the English sample, the overall mean scale score was 12.73, with a standard deviation of 9.28. Scores ranged from 0 to 35; the corrected item-test correlations ranged from 0.48 to 0.72; and the alphas after item deletion ranged from 0.85 to 0.88 (Table 1). For the Spanish sample, the overall mean scale score was 11.64 with a standard deviation of 8.30, and scores ranged from 0 to 35; the corrected item-scale correlations ranged from 0.43 to 0.68; and the alphas with item deletion ranged from 0.88 to 0.90. Both the English and Spanish corrected item-test correlations and alphas with item deletion are consistent with well behaved scales – that is, all the English and Spanish items are moderately to strongly correlated with the English and Spanish scale scores, respectively.
DFIT Results
The results of the differential functioning analyses are shown in Table 2. After 2 iterations, the following 9 items were identified as showing DIF based on the NCDIF index, and thus were excluded from the procedure for estimating the linking constants: MMSE 2–3, MMSE 6–8, MMSE14, MMSE 17–19. The remaining twelve non-DIF (anchor) items were used to estimate the final linking constants: MMSE 1, MMSE 4–5, MMSE 9–13, MMSE 15–16, and MMSE 20–21.
Despite finding 9 items with DIF, there was no differential functioning at the scale level. The DTF index, computed by summing the CDIF values for all twenty-one items, was 0.215, less than the DTF cutoff of 0.558 for the scale. As Table 2 shows, about half of the MMSE items with NCDIF values over the cutoff had positive CDIF values (eg, items 3, 14, 17, and 19) whereas the other half had negative values (eg, items 2, 6, 7, 8, and 18). A positive CDIF value indicates that an English respondent is more likely to endorse (answer incorrectly) a dichotomous item—or respond in category k or higher to a polytomous item—than a Spanish respondent of the same theta level.
As previously stated, Raju’s NCDIF statistic is similar to Lord’s χ2 statistic24 and to Raju’s area statistics (SA and UA),25 in that all of these tests assume all other items in the test are unbiased except for the individual item being tested. Based on simulations, Flowers et al4 showed that NCDIF estimates are more stable than are estimates of CDIF. As a comparison, Lord’s χ2 24 and Raju’s signed and unsigned area tests25 were calculated for the 16 dichotomous items in the scale (items 1–10, 15–18, and 20, 21). All 3 of these tests were significant at P < 0.01 for items 2, 3, 6, 7, and 17. These results are consistent with the NCDIF results for these items.
To graphically illustrate the differential functioning in the MMSE items and scale, the item response functions (IRF) for 2 items (one item with significant DIF and one without significant DIF), and the test response function for the MMSE scale were plotted. Figure 1 shows the IRFs for the English and Spanish versions of MMSE 6. Based on the NCDIF index, MMSE 6 shows a significant degree of DIF. Inspection of the IRFs reveals that compared with the Spanish MMSE 6, the English MMSE 6 is more discriminating (ie, the slope of the English IRF at the inflection point is steeper) and the Spanish MMSE 6 is more difficult (ie, the probability of an incorrect response at most values of cognitive disability is greater for the Spanish speakers than for the English speakers). When items differ with respect to discrimination, items are said to show nonuniform DIF. When items differ with respect to difficulty, they are said to show uniform DIF. Thus MMSE 6 shows both uniform and nonuniform DIF.
FIGURE 1.
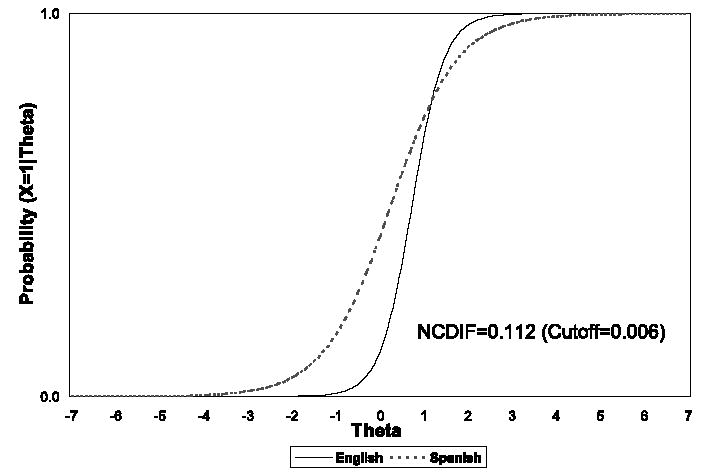
The English and Spanish item response functions for MMSE 6 (State the Correct City).
Figure 2 shows the IRFs for English and Spanish versions of MMSE 4. Although MMSE4 does not show a significant degree of DIF based on the NCDIF index, inspection of the English and Spanish IRFs reveals a small degree of nonuniformity in the curves. By comparing the areas between the English and Spanish curves for MMSE 6 and MMSE 4, it is apparent that MMSE6 has a greater degree of nonuniformity in the English and Spanish IRFs than MMSE 4, consistent with significant NCDIF in MMSE 6 but not MMSE 4 (see also the paper by Orlando Edelen and colleagues26 in this special issue).
FIGURE 2.
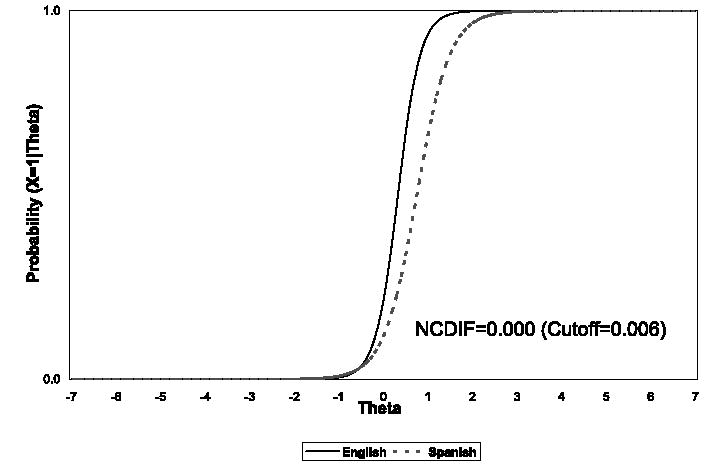
The English and Spanish item response functions for MMSE 4 (State Correct Day of Week).
Figure 3 shows the scale response functions for the English and for the Spanish versions of the MMSE scale. The English and Spanish scale response functions deviate by a small degree, but not enough surpass the DTF index cutoff.
SUMMARY
Using the DFIT framework, 9 of the 21 items that make up the MMSE showed significant DIF: name the correct season, day of the month, city, state, and 2 nearby streets, recall 3 objects, repeat the phrase no ifs, no ands, no buts, follow the command, “close your eyes”, and the command, “take the paper in your right hand, fold the paper in half with both hands, and put the paper down in your lap.” As a result, comparisons between English and Spanish respondents based on these items individually may not be comparable, and could lead to the over- or under-identification of cognitive impairment.
Offsetting effects among the items in the MMSE with DIF, however, result in a trivial degree of differential functioning at the scale level. Inspection of the CDIF indices for the English and Spanish MMSE items with DIF shows that about half have positive CDIF values while other half have negative CDIF values. When summed across the scale, these opposing forms of DIF cancel each other out, resulting in little differential functioning at the scale level. As a result, assessments of cognitive functioning among respondents to the English and Spanish versions of the MMSE are comparable at the scale level.
The psychometric analyses conducted for this study do not provide many clues as to why certain items function differently across the groups analyzed. In general, DIF can occur for a number of reasons including differences in the meaning of items, differences in the cognitive processes used in responding, differences in the appropriateness of response scales, problems in translation or interpretation, and inappropriate data collection procedures.27 Qualitative methods such as focus groups and cognitive interviews are necessary to assess the reasons underlying DIF. Some possible explanations for DIF are provided in Ramirez and colleagues7 and Jones13 in this special issue.
Strengths and Limitations of the DFIT Framework
One of the main strengths of the DFIT framework is that it provides an approach for assessing differential functioning at both the item and scale level. As this study illustrates, the presence of items showing differential functioning within a scale does not necessarily mean that differential functioning will be present at the scale level. Depending on the objectives of the researcher, item or scale level differential functioning may be of greater interest. For example, researchers interested in comparing English and Spanish subjects, using the MMSE for analyses of relationships of cognitive impairment with other variables, will be more concerned with differential functioning at the scale level. On the other hand, a researcher developing a new scale may use the results of item-level differential functioning analyses to identify problematic items in a candidate item pool for either elimination or modification. Finally, a clinician using individual items for assessment should be concerned about item-level DIF. Unlike the other IRT-based methods for assessing DIF discussed in this issue, the DFIT indices (NCDIF, CDIF) reflect the magnitude of differential functioning in additional to identifying items showing differential functioning, and therefore provide guidance regarding the impact an item has on scale differential functioning. This information can be used to prioritize items for removal of modification.
Another advantage of the NCDIF, CDIF and the DTF over earlier tests (Lord’s χ2 and the area statistics such as Raju’s signed and unsigned area test) is that they are based on the actual distribution of the ability estimates within the group for which we want to estimate DIF, rather than on the entire theoretical range of theta. For example, if most members of the focal group fall within the range of theta between −1 and 0, rather than from −1 to +1 on the continuum, the area statistics and Lord’s χ2 will give an inaccurate estimate of DIF. Similar to other indices of DIF such as area statistics and Lord’s χ2, an assumption of NCDIF is that all other items in the test are unbiased, except for the particular item being tested. CDIF makes no such assumption.
There are 2 noteworthy limitations to the DFIT framework. First, it lacks valid statistical tests for its indices. This is similar to the problem faced by methods for confirmatory factor analysis. χ2 statistics have been developed, but frequently are too sensitive to sample size, requiring the development and use of practical fit indices. Unlike CFA, however, the DFIT framework is relatively new and only a limited number of indices to assess item and scale level differential functioning exist. Future research using the DFIT framework should attempt to further refine and test the NCDIF, CDIF, and DTF indices.
Second, the procedure required to implement the DFIT framework is complicated, requiring 3 separate computer programs, 2 of which only run in the MS-DOS environment. The newest implementation of MULTILOG includes a MS Windows GUI interface, though the program code required to implement the program remains arcane. The parameter linking procedure is iterative and requires the use of both the EQUATE and the DFIT software; other model-based methods do not require prior equating because simultaneous parameter estimation is performed. The logistical problems posed by implementing such a complicated set of computations will be daunting to many researchers interested in conducting research using the DFIT framework and provide ample opportunity for errors. Developers of the DFIT framework should consider unifying and simplifying the procedures, and appropriate sponsors should consider funding this work.
Footnotes
Supported by the UCLA/DREW Project EXPORT, National Center on Minority Health & Health Disparities, (P20MD0014801) and the Institute on Aging (NIA)-funded Resource Centers for Minority Aging Research at UCLA (AG21684) and Columbia University (AG15294). Dr. Morales also received partial support for this research from a Robert Wood Johnson Medical Minority Faculty Development Program Fellowship award.
References
- 1.Clauser BE, Mazor KM. Using statistical procedures to identify differentially functioning test items. Educ Meas: Issues Pract. 1998;17:31–44. [Google Scholar]
- 2.Millsap RE, Everson HT. Methodology review: statistical approaches for assessing measurement bias. Appl Psychol Meas. 1993;17:297–334. [Google Scholar]
- 3.Raju NS, van der Linden WJ, Fleer PF. IRT-based internal measures of differential functioning of items and tests. Appl Psychol Meas. 1995;19:353–368. [Google Scholar]
- 4.Flowers CP, Oshima TC, Raju NS. A description and demonstration of the polytomous-DFIT framework. Appl Psychol Meas. 1999;23:309–326. [Google Scholar]
- 5.Camilli G, Shepard LA. Methods of Identifying Biased Test Items. Thousand Oaks, CA: Sage Publications; 1994. [Google Scholar]
- 6.Ellis BB, Mead AD. Assessment of the measurement equivalence of a Spanish translation of the 16PF questionnaire. Educ Psychol Meas. 2000;60:787–807. [Google Scholar]
- 7.Ramirez M, Teresi JA, Holmes D, et al. Differential Item Functioning (DIF) and the Mini-Mental State Examination (MMSE): overview, sample and issues of translation. Med Care. 2006;44(Suppl 3):S95–S106. doi: 10.1097/01.mlr.0000245181.96133.db. [DOI] [PubMed] [Google Scholar]
- 8.Folstein MF, Folstein SE, McHugh PR. Mini-Mental State: a practical guide for grading the cognitive state of patients for the clinician. J Psychiatr Res. 1975;12:189–198. doi: 10.1016/0022-3956(75)90026-6. [DOI] [PubMed] [Google Scholar]
- 9.van der Linden WJ, Hambleton RK. Handbook of Modern Item Response Theory. New York, NY: Springer Verlag; 1997. [Google Scholar]
- 10.Hambleton RK, Swaminathan H, Rodgers HJ. Fundamentals of Item Response Theory. Newbury Park, CA: Sage Publications; 1991. [Google Scholar]
- 11.Yu C. Evaluating cutoff criteria of model fit indices for latent variable models with binary and continuous outcomes. [dissertation] University of California at Los Angeles; Los Angeles, CA: 2002. [Google Scholar]
- 12.Muthén LK, Muthén BO. Mplus User’s Guide. 2nd ed. Los Angeles, CA: Muthén & Muthén; 2001. [Google Scholar]
- 13.Jones RN. Identification of measurement differences between English and Spanish language versions of the Mini-Mental State Examination: detecting differential item functioning using MIMIC modeling. Med Care. 2006;44(Suppl 3):S124–S133. doi: 10.1097/01.mlr.0000245250.50114.0f. [DOI] [PubMed] [Google Scholar]
- 14.Samejima F. Estimation of latent ability using a response pattern of graded scores. Psychometrika Monogr. 1969:17. [Google Scholar]
- 15.Samejima F. A new family of models for the multiple-choice item. Research Report No. 79-4. Department of Psychology, University of Tennessee; 1979. [Google Scholar]
- 16.du Toit M. IRT from SSI. Lincolnwood, IL: Scientific Software International; 2003. [Google Scholar]
- 17.Baker FB. EQUATE 2.1: Computer program for equating two metrics in item response theory [Computer program] Madison: University of Wisconsin, Laboratory of Experimental Design; 1995. [Google Scholar]
- 18.Stocking ML, Lord FM. Developing a common metric in item response theory. Appl Psychol Meas. 1983;7:201–210. [Google Scholar]
- 19.Raju NS. DFIT5P: A Fortran program for calculating dichotomous DIF/DTF [computer program] Chicago, IL: Illinois Institute of Technology; 1999. [Google Scholar]
- 20.Candell GL, Drasgow F. An iterative procedure for linking metrics and assessing item bias in item response theory. Appl Psychol Meas. 1988;12:253–260. [Google Scholar]
- 21.Collins WC, Edwards JE, Raju NS. Assessing differential functioning in a satisfaction scale. J Appl Psychol. 2000;85:451–461. doi: 10.1037/0021-9010.85.3.451. [DOI] [PubMed] [Google Scholar]
- 22.Fleer PF. A Monte Carlo assessment of a new measure of item and test bias. #x0005B;dissertation] Illinois Institute of Technology. Dissertation Abstracts International. 1993;54-04B:2266. [Google Scholar]
- 23.Flowers CP, Oshima TC, Raju NS. A Monte Carlo assessment of DFIT with dichotomously-scored unidimensional tests. [dissertation] Georgia State University; Atlanta, GA: 1995. [Google Scholar]
- 24.Lord FM. Applications of Item Response Theory to Practical Testing Problems. Hillsdale, NJ: Lawrence Erlbaum; 1980. [Google Scholar]
- 25.Raju NS. The area between two item characteristic curves. Psychometrika. 1988;53:495–502. [Google Scholar]
- 26.Edelen Orlando M, Thissen D, Teresi JA, et al. Identification of differential item functioning using item response theory and the likelihood-based model comparison approach: application to the Mini-Mental State Examination. Med Care. 2006;44(Suppl 3):S134–S142. doi: 10.1097/01.mlr.0000245251.83359.8c. [DOI] [PubMed] [Google Scholar]
- 27.Stewart AL, Nápoles-Springer AM. Advancing health disparities research: can we afford to ignore measurement issues? Med Care. 2003;41:1207–1220. doi: 10.1097/01.MLR.0000093420.27745.48. [DOI] [PubMed] [Google Scholar]