Abstract
The N protein from bacteriophage λ is a key regulator of transcription antitermination. It specifically recognizes a nascent mRNA stem loop termed boxB, enabling RNA polymerase to read through downstream terminators processively. The stacking interaction between Trp-18 of WT N protein and A7 of boxB RNA is crucial for efficient antitermination. Here, we report on the direct probing of the dynamics for this interfacial binding and the correlation of the dynamics with biological functions. Specifically, we examined the influence of structural changes in four peptides on the femtosecond dynamics of boxB RNA (2-aminopurine labeled in different positions), through mutations of critical residues of N peptide (residues 1–22). We then compare their in vivo (Escherichia coli) transcription antitermination activities with the dynamics. The results demonstrate that the RNA–peptide complexes adopt essentially two dynamical conformations with the time scale for interfacial interaction in the two structures being vastly different, 1 ps for the stacked structure and nanosecond for the unstacked one; only the weighted average of the two is detected in NMR by nuclear Overhauser effect experiments. Strikingly, the amplitude of the observed ultrafast dynamics depends on the identity of the amino acid residues that are one helical turn away from Trp-18 in the peptides and is correlated with the level of biological function of their respective full-length proteins.
Macromolecular assemblies play critical roles in biological processes, such as expression (1), recognition (2, 3), and catalysis (4, 5). In these assemblies, the interactions are selective in forming unique structures with dynamics governing the functions. One such complex is that of RNA with proteins. It involves the bacteriophage λ N protein, which binds a cis-acting stem-loop RNA structure (termed boxB) in nascent mRNA coded in the phage genome, and regulates transcription elongation and termination (6–8). With other host protein factors, the complex enables RNA polymerase to read through intrinsic and Rho-dependent terminators in a processive manner (9).
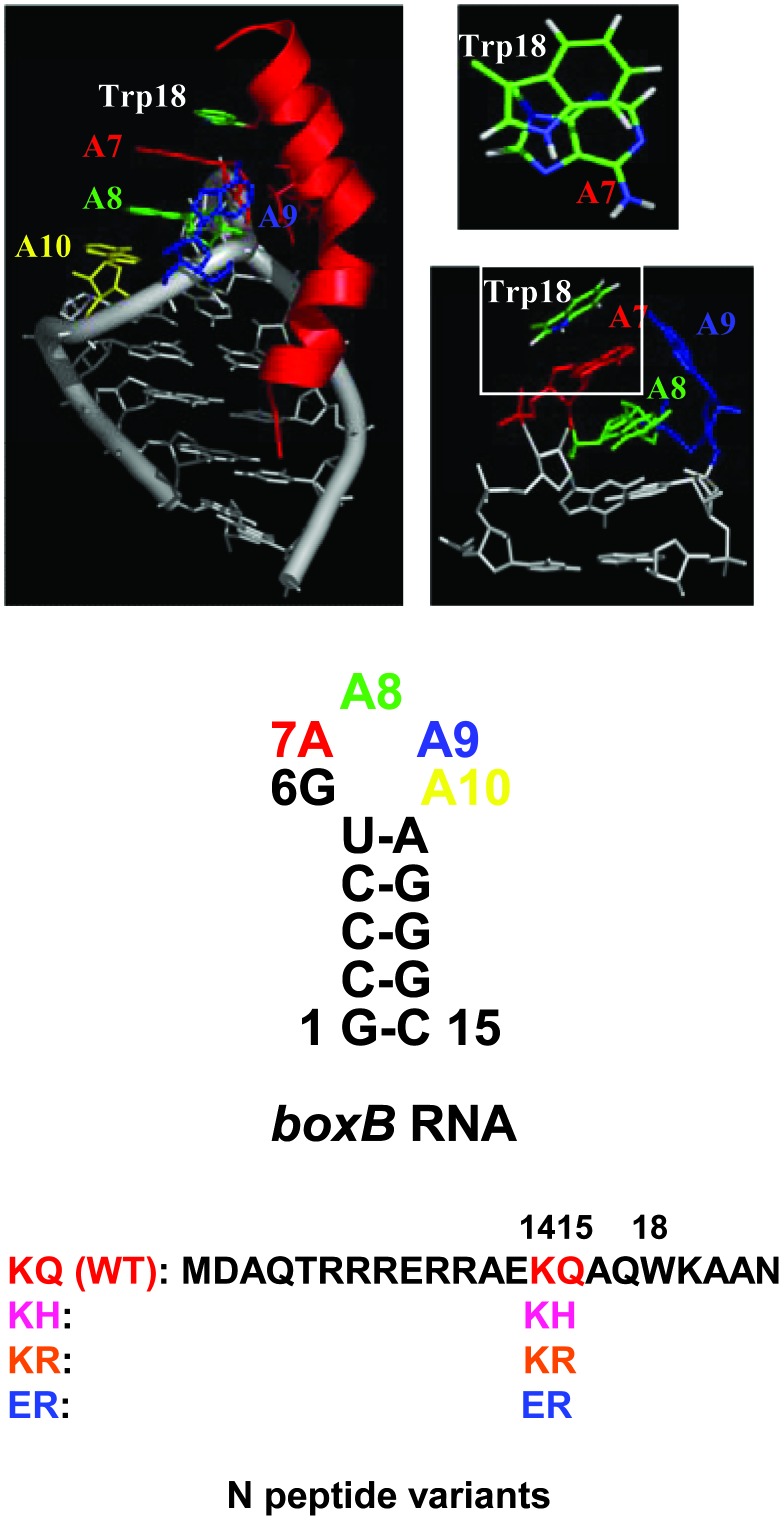
NMR structural studies (10–12) demonstrated that the amino terminal of the N protein (N peptide), which features an arginine-rich motif, binds to the boxB RNA hairpin as a bent α-helix, and this process enforces the purine-rich boxB RNA pentaloop to adopt a canonical GNRA fold (13, 14) with the fourth purine residue extruded (Fig. 1). One unique interaction featured in this RNA–peptide complex is that of the side chain of the tryptophan residue (Trp-18), which directly stacks on adenine 7, extending the RNA π-stack by one residue (Fig. 1). Different peptide ligands can target boxB RNA with strong equilibrium affinities (nanomolar range for dissociation constant) similar to the WT (15), as we have shown by in vitro protein selection via mRNA display (16, 17). However, examination of the energetics and structures by NMR, CD, and steady-state fluorescence on some of the selected 14/15 mutants (Fig. 1) reveal that they have quite a different Trp-18/RNA interface from that of the WT complex. As discussed below, the degree of stacking (Trp-18 on A7) decreases in the order of KQ (WT), KH, KR, and ER. It is the structural changes (stacking) at the Trp-18/A7, rather than binding affinities, that give rise to a wide range of in vivo antitermination activity, as elucidated below.
Fig. 1.
Sequences and structures of boxB RNA, N peptide variants selected for binding to boxB RNA (15), and their complexes used in this study. The WT complex structure is taken from NMR (10, 11). The bases A7, A8, A9, and A10 are colored in red, green, blue, and yellow, respectively; RNA backbone and other base pairs are in gray. The WT N peptide in the complex is represented as red ribbon with side chains of Lys-14, Gln-15, and Trp-18 shown. Structure of the boxB RNA pentaloop with U5-A11 closing base pair is viewed 90° from the full complex; the stacking between Trp-18 and A7 is viewed from the top of the loop.
Questions remain, however, regarding the exact nature of the different RNA–protein interfaces. It is also unclear how the function is correlated with the dynamical time scales of the structures involved, the intramolecular motions, and the interaction with the environment including water (18). Here, we use the fluorescent analogue of adenine, 2-aminopurine (Ap), which has been extensively used as a probe for nucleic acid conformational dynamics (19) and ultrafast electron transfer in DNA (20), to directly examine the femtosecond dynamics of interfacial charge transport between Ap at selected loop positions (by designed replacements) and the tryptophan of the peptides and the other nucleobases in the loop.
Experimental Procedures
Synthesis of RNAs and Peptides. The Ap-labeled RNAs were generated by solid-phase synthesis via standard phosphoramidite chemistry, deprotected, and purified by 20% urea-PAGE. Peptides were made by automated fluorenylmethoxycarbonyl synthesis (Applied Biosystems 432), deprotected, and purified by reversed-phase HPLC on a C18 column. Concentrations of RNAs and peptides were determined by UV absorbance at 260 and 280 nm, respectively. RNA (typically in 200 μM) was annealed in buffer of 50 mM NaCl/10 mM phosphate, pH 6; aliquot of concentrated peptide solutions was added to RNA to form an RNA–peptide complex with a 1:1.5 ratio.
Time-Correlated Single-Photon Counting (TCSPC). The TCSPC measurements were performed by using picosecond pulses from a cavity-dumped dye (DCM) laser. Laser output was at 650 nm and doubled to 325 nm for selective excitation of Ap. The instrument response has a full width at half maximum of ≈120 ps. The fluorescence at 370 nm was collected through a monochromator and detected with a microchannel plate. The excitation light was polarized vertically, and the emission was taken through a polarizer set at magic angle.
Femtosecond Fluorescence Up-Conversion. Femtosecond fluorescence up-conversion procedures have been described, and we used two laser systems (21, 22) for entirely independent sets of experiments. Ap is excited by a pump pulse at 320 nm. The energy of the excitation pulse was kept at ≈60 nJ, but care was taken to ensure that the low-power regime is valid; at higher-power densities, some artifact signals arise even from the peptide/buffer alone. The emission was collected by a pair of parabolic focus mirrors and mixed with the fundamental (800 nm) in the BBO crystal. The up-converted signal (257 or 260 nm) was detected by a photomultiplier after passing through a double-grating monochromator. The pump beam polarization was set at a magic angle with respect to fluorescence polarization set by the BBO crystal. In all of the experiments, the temperature of the sample quartz cell was controlled at 20°C or room temperature, and the samples were stirred. All of the data were fitted to multiexponential decay convoluted by a Gaussian response function as described (21). Transient absorption data have also been obtained and will be detailed elsewhere.
Transcription Antitermination Assay. N WT and mutant strains were constructed by using the two-plasmid reporter system as described (23). All sequences were verified by sequencing. N mutant strains were plated on tryptone agar supplemented with 0.05 mM isopropyl-β-d-galactopyranoside, 0.08 mg/ml 5-bromo-4-chloro-3-indolyl-β-d-galactopyranoside, and the appropriate antibiotics. Plates were scored for blue color. A colorimetric assay based on o-nitrophenyl-β-d-galactopyranoside was also used to quantitate β-galactosidase as a percentage of the WT N reporter construct in the solution (24).
Results and Discussion
We prepared two sets of RNA–peptide complexes. The first set is WT complexes (KQ) with the boxB RNA labeled at positions 7 (Ap-7), 8 (Ap-8), and 9 (Ap-9) individually (Fig. 1). Using these complexes we can probe the different regions of the RNA loop upon WT peptide binding. In the second set, we vary the peptides, with KQ, KH, KR, and ER being the residues at positions 14 and 15 (Fig. 1), all of which are complexed with Ap-7 RNA so we can probe the peptide binding-dependent dynamics at the RNA–peptide interface. We also used Escherichia coli strains that harbor the two-plasmid N expressor/β-galactosidase reporter system (23) to examine the transcription antitermination activity for the respective full-length protein mutants.
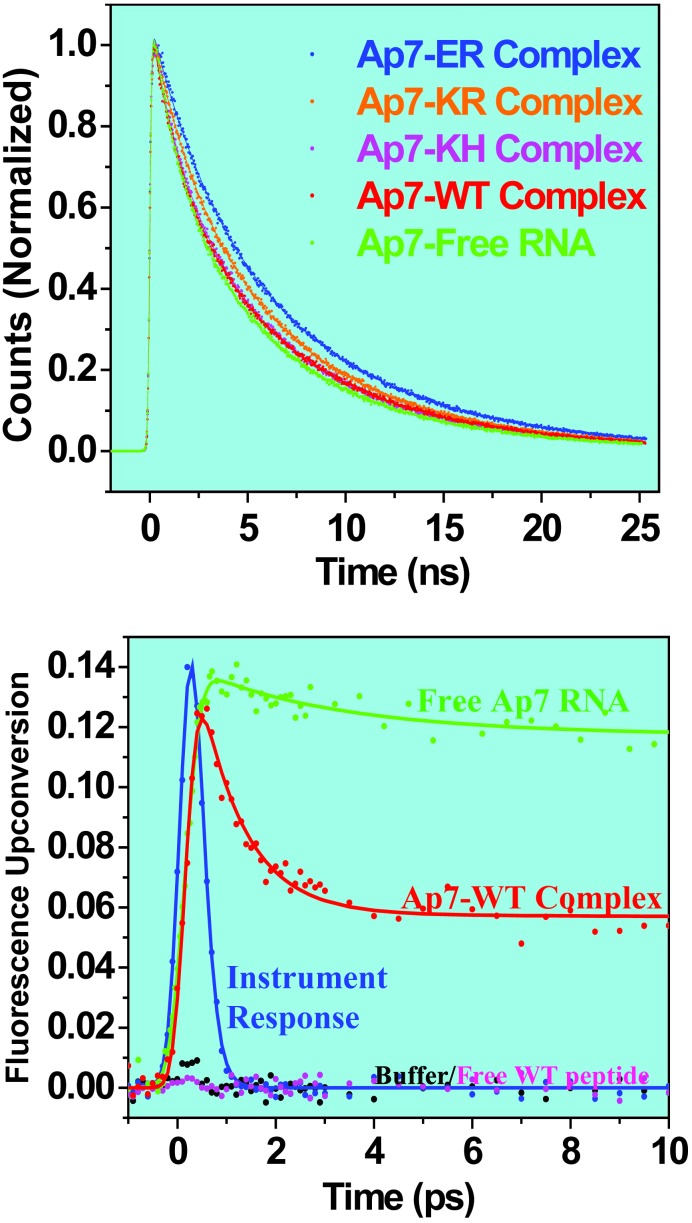
Dynamics of RNA–Peptide Complexes. All RNA–peptide complexes studied here show drastic differences in their dynamics depending on the time scale. We first performed nanosecond time-scale experiments on the series of Ap-7 complexes and the free Ap-7 RNA by using TCSPC techniques. As shown in Fig. 2, the normalized fluorescence decay profiles for all of the systems studied are very similar on the nanosecond time scale. Steady-state fluorescence measurements on these Ap-7 complexes show large differences in their fluorescence intensities, and hence the lack of large changes in the nanosecond decays for all complexes suggests that the dynamics must occur on a much faster time scale.
Fig. 2.
(Upper) TCSPC decay profiles for complexes of peptide variants with Ap-7 boxB RNA. All TCSPC decay curves are normalized at time 0 and exhibit multiple exponential nanosecond decay components. (Lower) Fluorescence up-conversion traces for free Ap7 RNA, free WT peptide, and the complex formed (Ap7-WT). The curves are not normalized. Note that the response of the buffer solution or the free peptide shows no transient signal. The instrument response measured by the Raman signal is shown for comparison.
In Fig. 2, we show femtosecond-resolved transients by up-conversion of Ap7 RNA in buffer, free peptide, buffer alone, and the WT complex. Only the WT complex shows the ultrafast decay (≈60%), elucidating the dynamics for RNA–protein interactions. Accordingly, the multiple nanosecond decays observed on a longer time scale represent the conformations that do not undergo ultrafast decay, and their lifetimes are similar to that of free Ap base. This finding indicates that in solution the RNA–peptide complexes have conformations that feature an unstructured loop, suggesting that the complexes sample other conformational space and are not being localized in a narrow well of a single native folded state. A similar phenomenon has also been observed for Ap incorporated into some double-stranded DNA constructs (20).
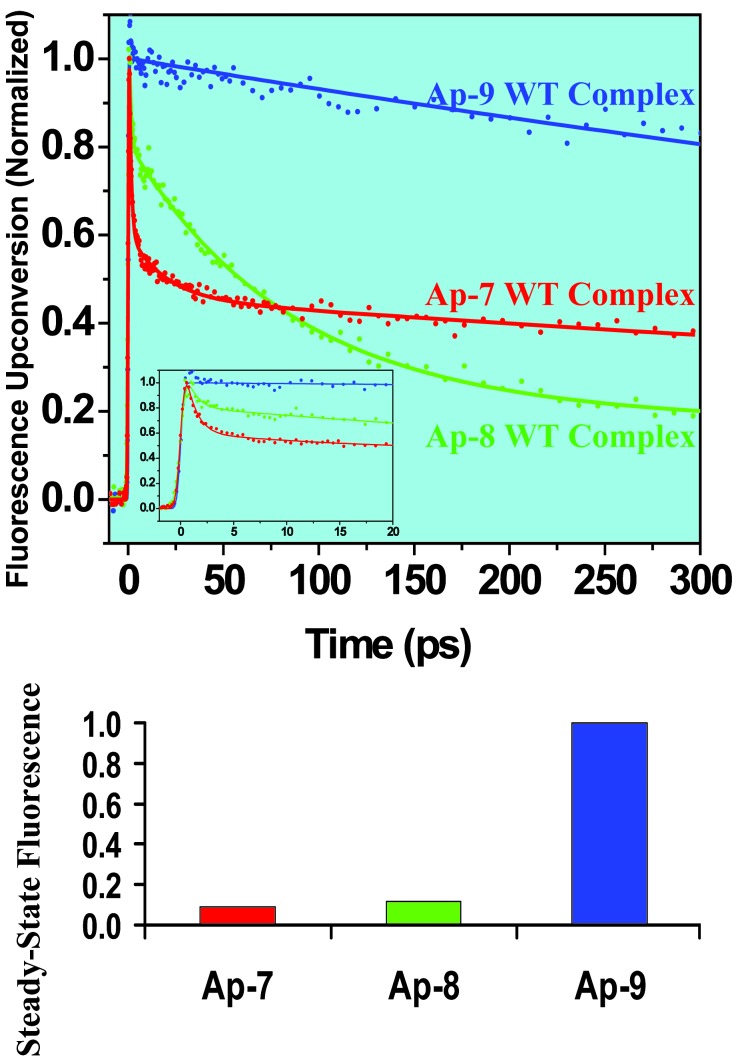
In Figs. 3 and 4, we report the primary dynamics for different Ap positions of RNA complexed with WT peptide and for a series of mutant complexes with different peptides. We first examined the WT complex to monitor the decay behavior of the Ap at the three different positions (at 7, 8, and 9) in the RNA loop (Fig. 1). As shown in Fig. 3, Ap labels at loop positions 7, 8, and 9 exhibit dramatically different decay dynamics. At position 7, it shows an ultrafast (1 ps, 60%) decay component, together with a 30-ps component (10%) and a nanosecond component (30%). At position 8, the ultrafast component (≈0.8 ps) is only 25%, with a 35-ps component (40%) and a subnanosecond component (35%). By contrast, position 9 shows essentially no ultrafast decay and only a nanosecond component.
Fig. 3.
Femtosecond fluorescence up-conversion decays measured for WT peptide complexes with Ap-7, Ap-8, and Ap-9 boxB RNA and corresponding steady-state fluorescence. (Inset) The expansion of the shorter time scale. Steady-state fluorescence intensities are normalized to that of the Ap-9 complex.
Fig. 4.
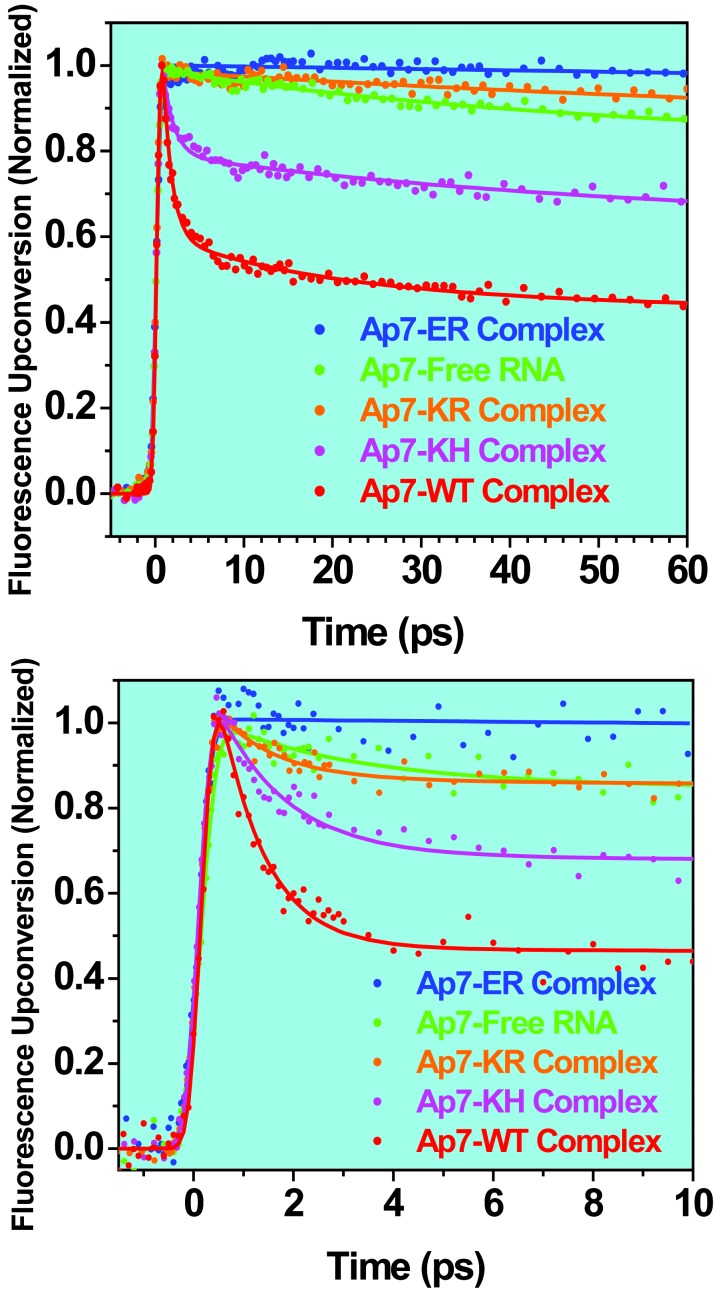
Femtosecond fluorescence up-conversion decays measured for variant complexes with Ap7 boxB RNA and the free RNA. (Upper) Decays were collected to 300 ps, but are shown only to 60 ps. All of the traces were analyzed individually and globally, and the results agree with each other within the uncertainties of the measurements. (Lower) An independent set of experiments showing the same dynamical behavior for complexes with Ap7 RNA, measured for up to 10 ps.
We then performed up-conversion experiments on the free RNA and the mutant complexes. Fig. 4 shows the decay traces for Ap-7 free RNA and complexes. Three decay components are used in the global analysis: an ultrafast ≈1 ps, an intermediate 30 ps, and a nanosecond component. For the ≈1-ps decay component, the WT has the largest (60%) and KH also has a significant population (30%), whereas KR has a relatively small (5%) and ER has near zero contribution. All complexes exhibit low and similar levels of the intermediate 30-ps decay component (5–10%, except 0% for ER). For the slow nanosecond component, WT and KH have the smallest, yet still significant, amplitude (30% and 60%), whereas it is dominant in both KR (90%) and ER (100%) at a level similar to that in free RNA (90%).
Full Range of WT Complex Structures. These results elucidate the nature of the dynamics at the RNA–peptide interface. First, the results for the WT complex with Ap labeled at positions 7, 8, and 9 show the full range of different structures, those “oriented” for interfacial stacking and undergo ultrafast dynamics, and those “nonoriented” and whose decay is insignificant on the femtosecond time scale. The rates reflect the change in stacking. In the WT complex, Trp-18 aromatic side chain from the peptide, and the A7, A8 and A10 bases from the RNA form continuous stacking steps, whereas A9 is extruded (Fig. 1). This stacking pattern provides different electron transfer pathways for Ap at different positions of the loop. From the reduction potential of Ap* (estimated to be 1.5 V vs. NHE) (25) and the oxidation potential of Trp (1.0 V vs. NHE) (26, 27), we obtained the driving force ΔG = -0.5 V for the electron transfer from Trp to Ap*. Compared with the driving force for bases in DNA (28), the observed rates here are consistent with the change in ΔG and the stacking for different positions of Ap.
Second, the up-conversion experiments on the WT complexes reveal the existence of structures other than those suggested by NMR. The NMR solution-phase structure of the WT complex (10, 11) represents a weighted average by the nuclear Overhauser effect detection method. The observed ultrafast dynamics reported here distinguishes the different conformations. The stacked structure is the one giving rise to the ultrafast decay rates, and in fact the values of the rate reported here (1 ps-1 for the WT) indicate a very strong effective interaction between Trp and A7. When comparing with results obtained for Ap with guanine (20), the rate for the WT complex is an order of magnitude larger, elucidating a stronger effective stacking in the complex. The other non-stacking structures are evident in our results of the magnitude of the longtime nanosecond decay component, which is 30% in the WT complex. These observations are consistent with the notion that RNA–protein complexes are inherently dynamical; a single static structure cannot accurately represent the inherent heterogeneity of these macromolecular conformations. It should be noted that the steady-state results (Fig. 3), although consistent with the time-resolved data, do not provide the behavior and rates discussed above.
Peptide Binding-Dependent Dynamics at RNA/Peptide Interface. The dynamics are critically altered depending on the nature of the peptide interface to RNA. The questions of significance are the following: which structures control the recognition of RNA by the different peptides and what are the time scales involved? And, given that we used a peptide library randomized at positions 14 and 15 to select the peptides, is the recognition of RNA by the peptides directed by the active binding site(s) of RNA target, or is it controlled by other conformations? As shown in Fig. 4, the observed ultrafast (1 ps) component is robust for the entire series of complexes (KQ, KH, KR, and ER) but the decrease in its magnitude follows the trend for stacking. The results indicate that the mutant complexes have in common with the WT complex a stacking structure (Fig. 1), and not new conformations, with a population depending on the peptides. This behavior was not evident in NMR observations of up-field shift of Trp-18 indole NH proton (which is sensitive to ring current of A7 underneath) and steady-state quenching results (Fig. 4), which indicate a progressive unstacking of Trp-18 on A7 in the order of KQ, KH, KR, and ER. As will be detailed elsewhere, the NMR shifts reflect an averaging, on the time scale of the experiments, which may give the appearance of systematic unstacking. We conclude that stacking structures are fundamental to all complexes and that the RNA target controls the recognition modes, but this can be modulated by some residues of the peptides.
Conclusions
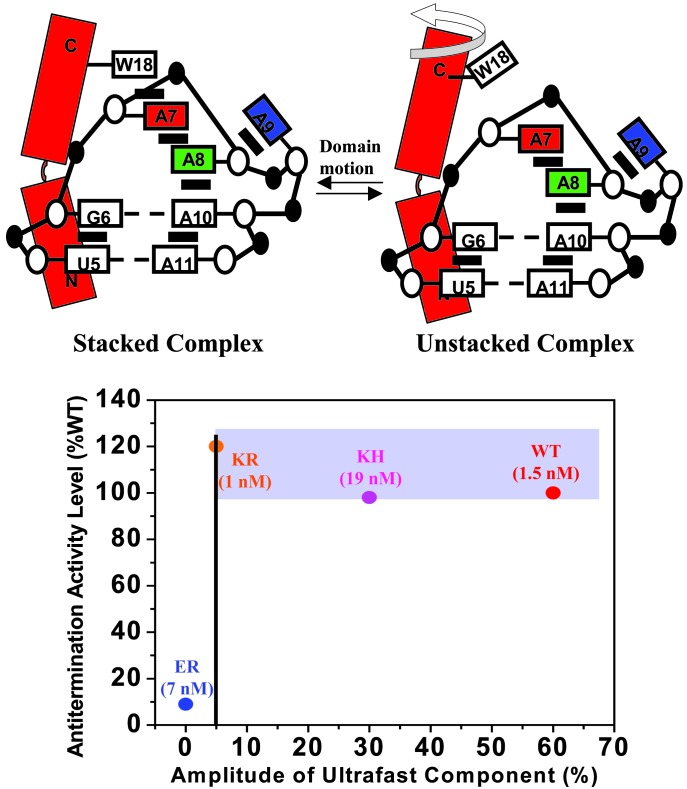
The nature of the structures involved is depicted in Fig. 5. In a two-state representation, we emphasize the stacked and unstacked complexes. The N-terminal portion (residues 1–11) anchors the peptide on the RNA target (with μM affinity; ref. 29), and the C-terminal portion (residues 12–22) may undergo domain motion between a bend α-helix that has Trp-18 stacking at the interface with A7 of RNA and the unstacked complex, where Trp-18 does not stack on A7. One of the unique features of the charge transfer in these RNA–peptide complexes is that the transfer proceeds across the interface between the two biomolecules, RNA, and peptide, and is mediated through a single-stranded stacking structure. Accordingly, the present study expands the repertoire of constructs that we can probe for these interfacial dynamics with femtosecond resolution. As shown above, this is particularly useful for complicated biological assemblies such as the complexes studied here.
Fig. 5.
Two-state model of conformational equilibrium distribution in the RNA–peptide complexes and comparison of the amplitude of the ultrafast dynamic component with the level of in vivo (E. coli) antitermination activity. (Upper) Stacked structure is a schematic representation of the WT complex from NMR studies (10, 11). Domain motion of the C-terminal portion of N peptides switches the stacked structure to the unstacked structure. The latter can undergo further RNA conformational dynamics with an ensemble of structures. (Lower) The KH and KR proteins have full activity when compared with WT, and all three form the biological activity band indicated. In contrast, the level of activity for the ER protein is <10% of that of WT. The vertical line is drawn to highlight a possible onset (see text) for the change in the amplitude of the ultrafast dynamic component, which reflects the fraction of folded (stacked) structures. The affinities (Kd) of peptides to boxB RNA measured in vitro are shown for each complex.
The final conclusion from these results concerns the correlation between the reported dynamics and the transcription antitermination activity for the respective full-length proteins measured in vivo (displayed in Fig. 5). The KH and KR have WT-level activity, but ER has <10% of WT activity. In Fig. 5, we show the biological in vivo activity and the amplitude of the ultrafast component for WT, KH, and ER. The stacking of Trp-18/A7 is a required element to maintain the proper assembly of functional antitermination complex with other protein factors. The relative population of the stacked structure is reflected in a threshold-type behavior. Clearly, correlations of structures and dynamics to functions, as we did here, is the key for elucidating the molecular description of these biological processes.
Acknowledgments
This work was financially supported by the National Science Foundation. H.-C.B. is supported in part by the Wenner-Gren Foundation in Stockholm.
Abbreviations: Ap, aminopurine; TCSPC, time-correlated single-photon counting.
References
- 1.Nagai, K. & Mattaj, I. W. (1994) RNA–Protein Interactions (Oxford Univ. Press, New York).
- 2.Bartel, D. P. & Szostak, J. W. (1994) in RNA–Protein Interactions, eds. Nagai, K. & Mattaj, I. W. (Oxford Univ. Press, New York), pp. 248-268.
- 3.Crothers, D. M. (1998) Proc. Natl. Acad. Sci. USA 95 15163-15165. [DOI] [PMC free article] [PubMed] [Google Scholar]
- 4.Cech, T. R. (1987) Science 236 1532-1539. [DOI] [PubMed] [Google Scholar]
- 5.Lerner, R. A., Benkovic, S. J. & Schultz, P. G. (1991) Science 252 659-667. [DOI] [PubMed] [Google Scholar]
- 6.Greenblatt, J., Nodwell, J. R. & Mason, S. W. (1993) Nature 364 401-406. [DOI] [PubMed] [Google Scholar]
- 7.Friedman, D. I. & Court, D. L. (1995) Mol. Microbiol. 18 191-200. [DOI] [PubMed] [Google Scholar]
- 8.Weisberg, R. A. & Gottesman, M. E. (1999) J. Bacteriol. 181 359-367. [DOI] [PMC free article] [PubMed] [Google Scholar]
- 9.Mogridge, J., Mah, T. F. & Greenblatt, J. (1995) Genes Dev. 9 2831-2845. [DOI] [PubMed] [Google Scholar]
- 10.Legault, P., Li, J., Mogridge, J., Kay, L. E. & Greenblatt, J. (1998) Cell 93 289-299. [DOI] [PubMed] [Google Scholar]
- 11.Scharpf, M., Sticht, H., Schweimer, K., Boehm, M., Hoffmann, S. & Rosch, P. (2000) Eur. J. Biochem. 267 2397-2408. [DOI] [PubMed] [Google Scholar]
- 12.Su, L., Radek, J. T., Hallenga, K., Hermanto, P., Chan, G., Labeots, L. A. & Weiss, M. A. (1997) Biochemistry 36 12722-12732. [DOI] [PubMed] [Google Scholar]
- 13.Jucker, F. M., Heus, H. A., Yip, P. F., Moors, E. H. & Pardi, A. (1996) J. Mol. Biol. 264 968-980. [DOI] [PubMed] [Google Scholar]
- 14.Heus, H. A. & Pardi, A. (1991) Science 253 191-194. [DOI] [PubMed] [Google Scholar]
- 15.Barrick, J. E., Takahashi, T. T., Ren, J., Xia, T. & Roberts, R. W. (2001) Proc. Natl. Acad. Sci. USA 98 12374-12378. [DOI] [PMC free article] [PubMed] [Google Scholar]
- 16.Roberts, R. W. & Szostak, J. W. (1997) Proc. Natl. Acad. Sci. USA 94 12297-12302. [DOI] [PMC free article] [PubMed] [Google Scholar]
- 17.Barrick, J. E., Takahashi, T. T., Balakin, A. & Roberts, R. W. (2001) Methods 23 287-293. [DOI] [PubMed] [Google Scholar]
- 18.Clary, D. C. & Meijer, A. J. H. M. (2002) J. Chem. Phys. 116 9829-9838. [Google Scholar]
- 19.Menger, M., Eckstein, F. & Porschke, D. (2000) Biochemistry 39 4500-4507. [DOI] [PubMed] [Google Scholar]
- 20.Wan, C., Fiebig, T., Schiemann, O., Barton, J. K. & Zewail, A. H. (2000) Proc. Natl. Acad. Sci. USA 97 14052-14055. [DOI] [PMC free article] [PubMed] [Google Scholar]
- 21.Fiebig, T., Wan, C. & Zewail, A. H. (2002) Chemphyschem. 3 781-788. [DOI] [PubMed] [Google Scholar]
- 22.Pal, S. K., Peon, J. & Zewail, A. H. (2002) Proc. Natl. Acad. Sci. USA 99 1763-1768. [DOI] [PMC free article] [PubMed] [Google Scholar]
- 23.Franklin, N. C. (1993) J. Mol. Biol. 231 343-360. [DOI] [PubMed] [Google Scholar]
- 24.Peled-Zehavi, H., Smith, C. A., Harada, K. & Frankel, A. D. (2000) Methods Enzymol. 318 297-308. [DOI] [PubMed] [Google Scholar]
- 25.Kelley, S. O. & Barton, J. K. (1999) Science 283 375-381. [DOI] [PubMed] [Google Scholar]
- 26.DeFelippis, M. R., Murthy, C. P., Faraggi, M. & Klapper, M. H. (1989) Biochemistry 28 4847-4853. [DOI] [PubMed] [Google Scholar]
- 27.Jovanovic, S. V., Steenken, S. & Simic, M. G. (1991) J. Phys. Chem. 95 684-687. [Google Scholar]
- 28.Steenken, S. & Jovanovic, S. V. (1997) J. Am. Chem. Soc. 119 617-618. [Google Scholar]
- 29.Austin, R. J., Xia, T., Ren, J., Takahashi, T. T. & Roberts, R. W. (2002) J. Am. Chem. Soc. 124 10966-10967. [DOI] [PubMed] [Google Scholar]


