

Abstract
We hypothesized that formation of advanced glycation end products (AGEs) associated with diabetes reduces matrix degradation by metalloproteinases (MMPs) and contributes to the impairment of ischemia-induced angiogenesis. Mice were treated or not with streptozotocin (40 mg/kg) and streptozotocin plus aminoguanidine (AGEs formation blocker, 50 mg/kg). After 8 weeks of treatment, hindlimb ischemia was induced by right femoral artery ligature. Plasma AGE levels were strongly elevated in diabetic mice when compared with control mice (579 ± 21 versus 47 ± 4 pmol/ml, respectively; P < 0.01). Treatment with aminoguanidine reduced AGE plasma levels when compared with untreated diabetic mice (P < 0.001). After 28 days of ischemia, ischemic/nonischemic leg angiographic score, capillary density, and laser Doppler skin-perfusion ratios were 1.4-, 1.5-, and 1.4-fold decreased in diabetic mice in reference to controls (P < 0.01). Treatment with aminoguanidine completely normalized ischemia-induced angiogenesis in diabetic mice. We next analyzed the role of proteolysis in AGE formation-induced hampered neovascularization process. After 3 days of ischemia, MMP-2 activity and MMP-3 and MMP-13 protein levels were increased in untreated and aminoguanidine-treated diabetic mice when compared with controls (P < 0.05). Despite this activation of the MMP pathway, collagenolysis was decreased in untreated diabetic mice. Conversely, treatment of diabetic mice with aminoguanidine restored collagenolysis toward levels found in control mice. In conclusion, blockade of AGE formation by aminoguanidine normalizes impaired ischemia-induced angiogenesis in diabetic mice. This effect is probably mediated by restoration of matrix degradation processes that are disturbed as a result of AGE accumulation.
Cardiovascular complications are the leading cause of morbidity and mortality in patients with diabetes mellitus. In fact, up to 80% of deaths in patients with diabetes are closely associated with vascular disease (1). The ability of the organism to form a collateral network of blood vessels constitutes an important response to vascular occlusive disease and determines to a large part the severity of tissue ischemia. The development of new vessels is significantly reduced in diabetic patients with coronary or peripheral artery disease (2, 3). This probably contributes to the severe course of limb ischemia in diabetic patients, in which peripheral artery disease often results in foot ulceration and lower extremity amputation (1). Only a few studies have specifically evaluated the effect of diabetes on angiogenesis in ischemic vascular disease. Moreover, the mechanisms by which diabetes could limit the formation of new blood vessels remain largely undefined.
Increased formation of advanced glycation end products (AGEs) is generally regarded as one of the main mechanisms responsible for vascular damage in patients with diabetes (4). Three of the major biochemical pathways implicated in the pathogenesis of vascular damage (the hexosamine, AGE-formation, and diacylglycerol–protein kinase C pathway) can be inhibited by a thiamine derivative. The ability to inhibit these pathways prevented diabetic retinopathy (5). Glycation of extracellular matrix is a consequence of prolonged exhibition of matrix components to elevated glucose levels that react with proteins by a nonenzymatic, posttranslational modification process called nonenzymatic glycation. This process is purely adventitious and therefore is likely to be more important in proteins possessing a long biological half-life such as collagen (6). This structural alteration of the extracellular-matrix components has a number of effects including altered cell–matrix interactions (6), changes in arterial mechanical properties (7, 8), and a decrease in vascular permeability (9). AGE formation has also been shown to reduce the proteolysis of the glycated proteins (10) and therefore may affect the angiogenic reaction.
Indeed, matrix degradation by proteolysis is a key event in new vessel growth, enabling endothelial cell migration and vascular remodeling (11). Specialized pathways of degrading macromolecules of the extracellular matrix involve a group of proteolytic enzymes known as metalloproteinases (MMPs) including gelatinases, MMP-2, and MMP-9, which are able to degrade the extracellular-matrix components of the basement membrane, stromelysin (MMP-3, MMP-10, and MMP-11), and collagenases such as MMP-1, MMP-8, and MMP-13 (a major interstitial collagenase in rodents). Interstitial collagenases mediate the initial step of collagen degradation by cleaving triple-helical fibrils of interstitial collagen types I–III at a single site, resulting in the generation of three-fourths- and one-fourths-length fragments (12, 13). These fragments then become accessible to other proteases such as gelatinases, which together with collagenases further catabolize collagen (13).
Numerous studies have highlighted the key role of the proteolytic reaction in the angiogenic process. MMP-deficient mice exhibit delayed angiogenic responses during development (14). In addition, inhibition of MMP activity is sufficient to block the angiogenic response to basic fibroblast growth factor in rat cornea and to hamper angiogenesis in the ischemic hindlimb of IL-10-deficient mice (15, 16).
We hypothesized that glycation of extracellular matrix in the vessel wall as a result of diabetes inhibits extracellular-matrix degradation by MMPs and thereby impairs neovascularization in response to ischemia and flow obstruction. To test this hypothesis we studied the effect of aminoguanidine treatment, which prevents glycation of extracellular matrix, on new vessel growth after femoral artery ligation in diabetic and nondiabetic mice.
Materials and Methods
Experimental Protocol. C57Bl6 mice (8 weeks old, Iffa Credo) were treated with streptozotocin (STZ) (Sigma) or STZ and an inhibitor of AGE formation [aminoguanidine (Sigma), 50 mg/kg in the drinking water, throughout the study]. Untreated nondiabetic mice served as controls. In an additional set of experiments, aminoguanidine-treated diabetic mice received with doxycycline (30 mg/kg/day in the drinking water) a nonspecific MMP inhibitor. To induce moderate diabetes (i.e., some insulin is produced by the mouse), mice were injected i.p. with 40 mg/kg STZ in 0.05 M Na citrate, pH 4.5, daily for 5 days. Three days after the fifth injection, blood glucose levels were measured. If serum glucose was <9 mmol/liter, mice were injected for an additional twice a week (for 1 week) at the same dosage. Glucose levels were tested every week to ensure serum glucose levels of >10 mmol/liter. Mice with glucose levels <10 mmol/liter were excluded from the study.
After 8 weeks of treatment, right femoral artery ligature was performed for 3 or 28 days in untreated control, STZ-induced diabetic, and aminoguanidine-treated diabetic mice as described (16). Body weight and glucose plasma level were recorded weekly throughout the study.
AGE Measurement. After the mice were killed, the rate of AGE formation was analyzed in blood samples by using an ELISA assay (17). At variance, the anti-AGE antibodies were produced in chicken and immunopurified on an Nε--carboxymethyl lysine albumin affinity column.
Quantification of Angiogenesis. Microangiography. Vessel density was evaluated by high-definition microangiography (Trophy system) at the end of the treatment period as described (16).
Capillary density. Microangiographic analysis was completed by assessment of capillary density in ischemic and nonischemic muscles as described (16).
Laser Doppler perfusion imaging. To provide functional evidence for ischemia-induced changes in vascularization, laser Doppler perfusion imaging experiments were performed as described (16).
Determination of MMP-3, MMP-13, and COL2-3/4C Protein Levels. MMP protein level was assessed by using antibody directed against MMP-3 (dilution of 1:1,000; Santa Cruz Biotechnology) and MMP-13 (dilution of 1:1,000; Santa Cruz Biotechnology). Sites of collagenase cleaved interstitial collagen I were detected by incubation with a polyclonal rabbit antibody reactive to the carboxyl-terminal COL2-3/4C neoepitope generated by cleavage of native collagen by collagenases (dilution of 1:200; HDM Diagnostics and Imaging, Toronto) (12, 13). As a protein loading control, membranes were stripped and incubated with a goat polyclonal antibody directed against total actin (dilution of 1:1,000; Santa Cruz Biotechnology), and a specific chemiluminescent signal was detected as described (16).
Gelatin Zymography. Protein samples were mixed in SDS/PAGE loading buffer (lacking reducing agents), applied to 9% SDS/polyacrylamide gel containing 1 mg/ml gelatin (Bio-Rad), and separated by electrophoresis. Gelatinolytic activity was visualized as clear areas of lysis in the gel. Densitometric analysis was performed by using nih image software as described (16).
Reverse Zymography. Samples analyzed by reverse zymography were electrophoresed on 9% polyacrylamide gel polymerized with 2 mg/ml gelatin used as a source of gelatinases and 160 ng/ml of pro-MMP-2 (Calbiochem). After electrophoresis, gels were washed in Triton X-100 2.5%, incubated in collagenase buffer (50 mmol/liter Tris·HCl, pH 7.5/10 mmol/liter CaCl2/150 mmol/liter NaCl) at 37°C, and stained by using a silver solution. Tissue inhibitor of metalloproteinase (TIMP)-2 appeared as a dark band (21 kDa) corresponding to the area where gelatin degradation by the gelatinases added to the gel is prevented by the inhibitor. Densitometric analysis was performed by using nih image software.
Immunohistochemistry. Frozen tissue sections (7 μm) were incubated with chicken polyclonal antibody directed against AGE formation (dilution of 1:100) and FITC-conjugated species-specific secondary antibody (dilution of 1:20). Costaining then was performed with a mouse monoclonal antibody directed against collagen type I (dilution of 1:50) and Texas red-conjugated species-specific secondary antibody (dilution of 1:20).
Sites of collagenase cleaved interstitial type I collagen were detected by staining with a polyclonal rabbit antibody reactive to the carboxyl-terminal COL2-3/4 collagen fragments (dilution of 1:200). Immunostains were visualized by using avidin-biotin horse-radish peroxidase visualization systems (Vectastain ABC kit elite, Vector Laboratories) and then analyzed in randomly chosen fields of a definite area by using histolab software.
Collagen Morphometry. Frozen tissue sections (7 μm) were incubated for 30 min in 0.1% Sirius red F3B (Gurr, London) in saturated picric acid. After rinsing twice in distilled water and in ethanol 100%, sections were briefly dehydrated with Toluene and put under coverslips. Each field was digitized by a gray-level camera (3CCD, Sony, Tokyo) mounted on a light microscope (NS 400, Nachet, Dijon, France). Collagen then was quantified at ×40 magnification with digital image-analysis software (histolab).
Statistical Analysis. Results are expressed as mean ± SEM. One-way ANOVA was used to compare each parameter. Post hoc Bonferroni's t test comparisons then were performed to identify which group differences account for the significant overall ANOVA. A value of P < 0.05 was considered significant.
Results
Physiological Data. As shown in Table 1, body weight was reduced by 10% in treated and untreated diabetic mice when compared with control mice (P < 0.05). There was comparable hyperglycemia in both diabetic groups (P < 0.001, when compared with controls). The AGE plasma level was increased by 12.3-fold in diabetic animals compared with control mice (P < 0.001). As expected, aminoguanidine treatment decreased by 4.2-fold AGE plasma level in reference to untreated diabetic mice (P < 0.001). By using immunohistochemistry, we observed AGE formation within the interstitial space around myocytes and capillaries and also evidenced a marked AGE accumulation in hindlimbs of diabetic animals. The merger of AGEs and collagen staining patterns reveals colocalization in muscle tissue, providing evidences for AGE crosslinking of collagen in the ischemic hindlimbs of diabetic mice.
Table 1. Physiological data.
| Control | SPTZ | SPTZ + AG | |
|---|---|---|---|
| Weight, g | 29.5±0.8 | 27.3±0.4* | 27.5±0.5* |
| Glycemia, mmol/liter | 7.4±1.2 | 12.7±0.7† | 12.6±0.3† |
| AGEs, pmol/ml | 47±4 | 579±21† | 138±21‡ |
Values are mean ± SEM; □ = 7 per group. AG, aminoguanidine
, □ < 0.05 and
, □ < 0.001 versus control group
, □ < 0.001 versus STZ-treated (SPTZ) mice
Analysis of Native Angiogenesis (Fig. 1)
Fig. 1.

(A) Ischemic/nonischemic angiographic score ratio. (B) Ischemic/nonischemic capillary density ratio. (C) Ischemic/nonischemic foot blood flow expressed as a ratio of blood flow in ischemic limb to that in nonischemic limb. Values are mean ± SEM; n = 7 per group. *, P < 0.05 versus control (C) group at day 28; †, P < 0.05 versus STZ-treated animals (SPTZ) at day 28; ≠, P < 0.05 versus STZ and aminoguanidine-treated mice (SPTZ+AG) at day 28. SPTZ+AG+MMPi, doxycycline (nonselective MMP inhibitor) and aminoguanidine-treated diabetic mice.
Microangiography. Day 3. The angiographic score was not significantly different in the three groups.
Day 28. The ischemic/nonischemic leg angiographic score ratio was decreased by 1.4-fold in diabetic mice when compared with control animals (P < 0.05). Interestingly, aminoguanidine treatment increased by 1.4-fold vessel density when compared with untreated diabetic mice (P < 0.05) and restored the angiographic score to a level similar to that observed in control animals.
Capillary density. Microangiographic data were confirmed by capillary density analysis.
Day 3. Capillary number was unchanged in either group.
Day 28. The ischemic/nonischemic leg capillary number ratio was decreased by 1.5-fold in diabetic mice when compared with control animals (P < 0.05). The inhibitor of AGE formation increased by 1.3-fold the capillary number in aminoguanidine-treated diabetic mice compared with untreated diabetic mice (P < 0.05). Therefore, capillary density in aminoguanidine-treated diabetic mice was no longer different from that observed in untreated control animals. Laser Doppler perfusion imaging system. Microangiography and capillary density measurements were associated with changes in blood perfusion.
Day 3. The ischemic/nonischemic foot-perfusion ratio was not significantly different between the groups.
Day 28. Restoration of foot perfusion was significantly lower in diabetic mice versus controls (P < 0.05). Aminoguanidine treatment raised by 1.4-fold the ischemic/nonischemic foot-perfusion ratio in reference to untreated diabetic mice and restored foot perfusion to a level similar from that observed in control animals.
Molecular Mechanisms of AGE Formation-Induced Impairment of the Angiogenic Process in Diabetic Mice. To examine the role of the matrix degradation in AGE formation-induced impairment of the angiogenic process, we analyzed the regulation of the proteolytic process in the ischemic and nonischemic hindlimbs of diabetic mice.
Changes in the Proteolytic Process
MMP-2 activity. Day 3. Gelatin zymographic analysis revealed a major lytic band at 62 kDa, corresponding to the active form of MMP-2, and a minor lytic band of 72 kDa, consistent with the pro form of MMP-2 (Fig. 2A). In the nonischemic limb, no changes in both pro- and active MMP-2 gelatinolytic activities were observed. In the ischemic hindlimb, pro- and active MMP-2 gelatinolytic activities were increased by 2.7- and 1.4-fold, respectively, in diabetic mice compared with the control animals. Aminoguanidine treatment did not affect the enhanced MMP-2 activity associated with diabetes (P = 0.12; Fig. 2B). We could not detect lytic bands at 92 and 82 kDa, consistent with the pro- and active forms of MMP-9 treatment in our experimental conditions.
Fig. 2.

(A Left) Representative gelatin zymographic analysis of protein extract from untreated animals and diabetic mice treated with or without aminoguanidine (AG) at day 3 after ischemia. (Right) Representative reverse-zymography analysis of protein extract from untreated animals and diabetic mice treated with or without aminoguanidine at day 3 after ischemia. (B) Densitometric analysis of zymographic (Left) and reverse-zymographic (Right) gels in ischemic and nonischemic leg at day 3 after femoral artery occlusion in mice. (C) Densitometric analysis of zymographic (Left) and reverse-zymographic (Right) gels in ischemic and nonischemic leg at day 28 after femoral artery occlusion in mice. Values are mean ± SEM; n = 7 per group. *, P < 0.05 versus ischemic control (C) mice. SPTZ, STZ-treated animals; SPTZ + AG, STZ and aminoguanidine-treated mice.
Day 28. Gelatinolytic activity was not changed in any of the groups (Fig. 2C).
TIMP-2. TIMP-2 activity was unaffected in ischemic and nonischemic leg in either group independent of the time point chosen (Fig. 2).
MMP-3. Day 3. In the nonischemic hindlimb, MMP-3 protein content was unaffected in either group. In contrast, in the ischemic leg MMP-3 content was raised 1.4-fold in untreated diabetic mice when compared with control animals (P < 0.05). Administration of aminoguanidine did not modulate a diabetes-induced rise in MMP-3 protein content (P = 0.62; Fig. 3 A and B).
Fig. 3.
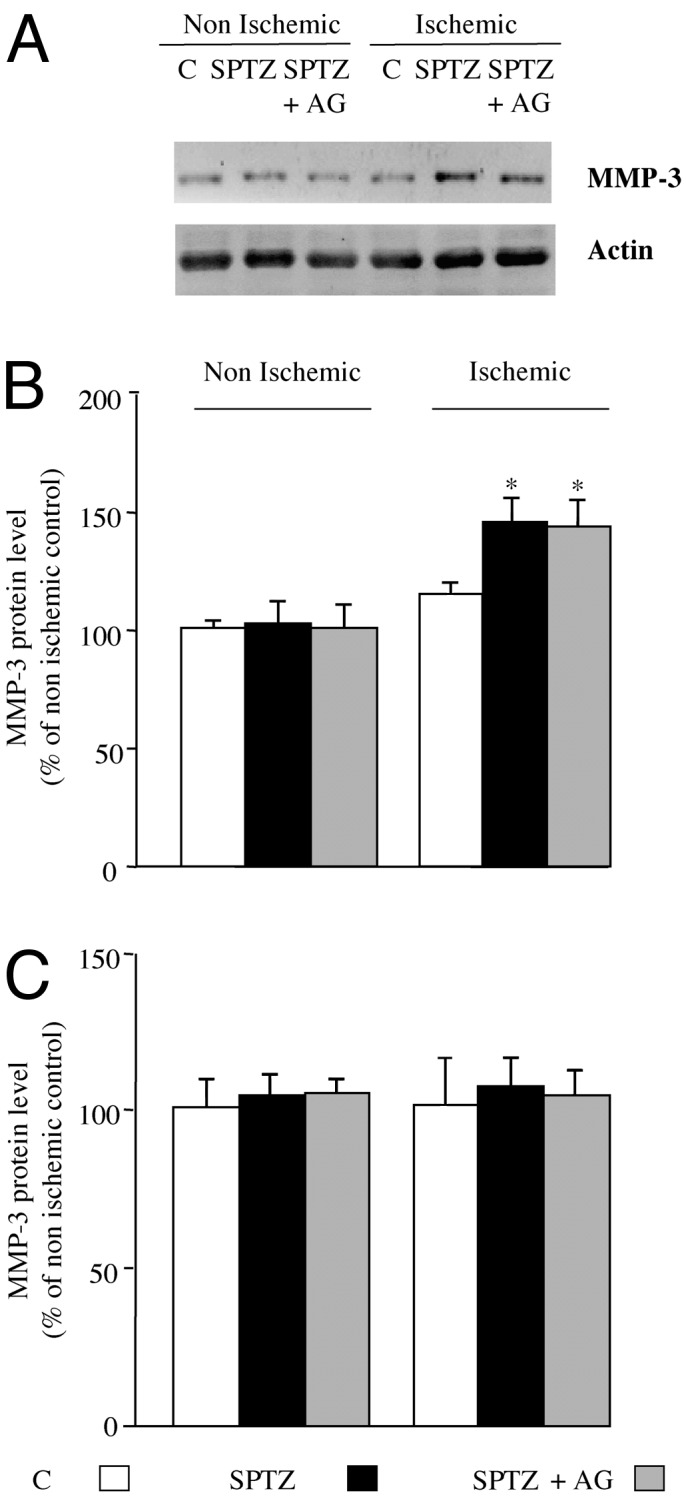
(A) Representative Western blot of MMP-3 and actin protein content in ischemic and nonischemic leg at day 3 after femoral artery occlusion. Quantitative evaluation of MMP-3 expressed as a percentage of nonischemic control (C) at days 3(B) and 28 (C) after ischemia is shown. Values are mean ± SEM; n = 7 per group. *, P < 0.05 versus ischemic control mice. SPTZ, STZ-treated animals; SPTZ+AG, STZ and aminoguanidine-treated mice.
Day 28. At this time point, no changes in MMP-3 protein content were observed in the ischemic and nonischemic leg of either group (Fig. 3C).
MMP-13. Day 3. In the nonischemic hindlimb, MMP-13 protein content was not affected regardless of the treatment. In contrast, in the ischemic leg, MMP-13 level was raised 1.5-fold in untreated diabetic mice in reference to control mice (P < 0.05). Such an increase was unaffected by aminoguanidine treatment (P = 0.79; Fig. 4 A and B).
Fig. 4.

(A) Representative Western blot of MMP-13, three-fourths cleaved collagen, and actin protein content in ischemic and nonischemic leg at day 3 after femoral artery occlusion. (B) Quantitative evaluation of MMP-13 (Left) and three-fourths cleaved collagen (Right) protein levels expressed as a percentage of nonischemic control (C) at day 3 after ischemia. (C) Quantitative evaluation of MMP-13 protein content expressed as a percentage of nonischemic control at day 28 after ischemia. Values are mean ± SEM; n = 7 per group. *, P < 0.05 versus ischemic control mice; †, P < 0.05 versus ischemic diabetic mice. nd, not detected; SPTZ, STZ-treated animals; SPTZ+AG, STZ and aminoguanidine-treated mice.
Day 28. At this time point, no changes in collagenase expression were observed in the ischemic and nonischemic leg of either group (Fig. 4C).
Three-fourths cleaved collagen. Sites of collagenase cleaved interstitial collagen I were detected by incubation with a polyclonal rabbit antibody reactive to the carboxyl-terminal COL2-3/4C neoepitope generated by cleavage of native collagen by collagenases. Three-fourths cleaved collagen protein content reflects, therefore, the collagenolysis reaction as described (13).
At day 3, in nonischemic leg we could not detect a three-fourths cleaved collagen protein level in either group. In the ischemic leg, three-fourths cleaved collagen content was reduced by 1.4-fold in untreated diabetic mice when compared with control animals (P < 0.05). In contrast, treatment with the inhibitor of AGE formation raised by 2-fold three-fourths cleaved collagen content when compared with untreated diabetic mice (P < 0.05). Consequently, no significant changes were observed in three-fourths cleaved collagen protein level between aminoguanidine-treated diabetic mice and control mice (Fig. 3 A and B). These results were consistent with those obtained with immunohistochemistry techniques (Fig. 5 B and D). We observed cleaved collagen within the interstitial space around myocytes and capillaries. We also evidenced a reduced COL2-3/4-positive staining in hindlimbs of diabetic animals, confirming that the collagenolysis process is affected in diabetic mice. In contrast, treatment with AGE-formation inhibitor restored three-fourths cleaved collagen staining to a level similar to that observed in control mice. Accordingly, collagen accumulation was 1.3-fold higher in ischemic skeletal muscle of diabetic animals when compared with control mice (1.98 ± 0.22% versus 1.53 ± 0.03%, respectively, P < 0.05). Treatment of diabetic mice with aminoguanidine reduced collagen content by 1.4-fold in reference to untreated diabetic mice (1.43 ± 0.06%, P < 0.05), underlining the hypothesis that aminoguanidine treatment restored collagen degradation by MMPs (Fig. 4B).
Fig. 5.

Representative photomicrographs of ischemic muscle sections from control (Cont) and treated mice stained with antibody directed against AGEs (A, AGEs appear in green), with Sirius red (B, collagen fibers appear in red), with antibody against AGEs and collagen [C, AGEs appear in green, collagen appears in red, and colocalization (Merge) is revealed by yellow staining; ischemic muscle section of diabetic mice], and with antibody directed against cleaved collagen (D, positive staining appears in brown). (Magnification, ×20.) SPTZ, STZ-treated animals; SPTZ+AG, STZ and aminoguanidine-treated mice.
Requirement of the Proteolytic Process: Effect of MMP Inhibitor. The ischemic/nonischemic leg angiographic score, capillary density, and blood flow perfusion were hampered 1.5-, 1.6-, and 1.4-fold by administration of an MMP inhibitor in aminoguanidine-treated diabetic mice compared with aminoguanidine-treated diabetic mice without MMP inhibitor (P < 0.05; Fig. 1). Therefore, administration of nonselective MMP inhibitor completely abrogated the enhanced angiogenic process observed in aminoguanidine-treated diabetic mice, confirming the requirement for MMP activity and matrix degradation in the proangiogenic effect of aminoguanidine.
Discussion
Our study shows that inhibition of AGE formation with aminoguanidine restores collagenolysis and prevents the impairment in ischemia-induced angiogenesis associated with diabetes.
In this study we demonstrated that inhibition of AGE formation by aminoguanidine treatment restores the angiogenic process associated with ischemia in diabetic mice. Similarly, inhibition of cellular infiltration and neovascularization by glucose was prevented by aminoguanidine in the rat sponge granuloma model underlining the involvement of AGE formation in the abrogated angiogenic reaction observed in diabetes (18). It has been shown that aminoguanidine partially prevented the time-dependent progression of impaired vasodilatation to acetylcholine in STZ-treated animals (19) and normalizes diabetes-induced changes in arteriolar mechanical behavior, as defined by decreased passive compliance and impaired myogenic reactivity of the arterial wall (8). Taken together, these studies highlight the benefits of AGE-formation inhibition on diabetes-induced vascular dysfunction.
Nevertheless, aminoguanidine treatment may induce potential side effects that may interfere with the neovascularization process. Aminoguanidine has been shown to inhibit nitric oxide synthase (NOS). Nevertheless, in in vivo experiments, doses of aminoguanidine required to elicit a considerable inhibition of inducible NOS are rather high: 15–45 mg/kg in rats or up to 400 mg/kg per day in mice (20). In addition, NOS knockout mice are characterized by impaired angiogenesis in response to ischemia (21). NO also contributes to the proangiogenic effect of growth factors or hormones, suggesting that NO is a positive regulator of the neovascularization (21, 22). Hence, it is unlikely that the putative inhibition of NOS by aminoguanidine at a dose of 50 mg/kg per day is involved in its proangiogenic effect in diabetic mice. Aminoguanidine also displays antioxidant properties. Reactive oxygen species (ROS) are involved in the signaling pathways mediating many stress and growth responses including angiogenesis (23). Sponge implant assays demonstrate that vascular endothelial growth factor (VEGF)-induced angiogenesis is reduced significantly in mice treated with antioxidants or in mice deficient for GP91-phox, the membrane component of the NAD(P)H oxidase (24). Hence, ROS production mediates the neovascularization process, precluding the hypothesis that the aminoguanidine proangiogenic effect involved inhibition of ROS production.
In this study we show that a panel of MMPs including MMP-2, MMP-3, and MMP-13 are increased in ischemic limbs of diabetic mice. This result is in line with other findings showing that MMP activity was higher in aortic homogenates and plasma in rat models of diabetes (25). High glucose levels have also been shown to raise MMP activity in cultured cells (25, 26). Nevertheless, despite this raise in MMP content, the quantity of cleaved collagen, reflecting the proteolytic process, was reduced in diabetic animals. This discrepancy between MMP levels and collagenolysis suggests that the extracellular matrix is less sensitive to the degradation process. Glucose-derived crosslinks on collagen drastically alter the structure and function of this matrix protein and among others increase tensile strength (27). The increased physical stability of matrix proteins goes together with increased biochemical stability, hampering protein degradation (28). It therefore is likely that aminoguanidine treatment by preventing AGE formation allows extracellular-matrix degradation and keeps angiogenic responses intact. Administration of nonselective MMP inhibitor completely abrogated the enhanced angiogenic process observed in aminoguanidine-treated diabetic mice, confirming the requirement for MMP activity and matrix degradation in the proangiogenic effect of aminoguanidine. It has been shown that collagenase-resistant collagen constitutes a defective substratum for angiogenesis into fibrillar collagen implants grafted onto chick chorioallantoic membrane (29). In addition, VEGF and basic fibroblast growth factor-induced angiogenesis required specific cleavage of collagen (30). Taken together, these results highlight that matrix degradation is a rate-limiting event in angiogenesis in vivo and suggest that AGE accumulation, by affecting the proteolytic reaction, hampers neovascularization.
Conversely, several lines of evidence suggest that AGE formation might participate in the excessive vascularization in the diabetic retina. AGEs have been reported to increase retinal VEGF gene expression (31) and to stimulate the growth of microvascular endothelial cells or in vivo angiogenesis in the chorioallantoic membrane assay (32–34). Nevertheless, the growth of pericytes of blood vessels is inhibited by AGEs, and the formation of aberrant vessels lacking pericytes is the histological hallmark of the early stages of diabetic retinopathy (34, 35). In addition, AGEs reduce smooth muscle cell proliferation (36). Because the development of a functional vascular structure requires the presence of endothelial cells, smooth muscle cells, and pericytes, it is puzzling that AGE formation may activate the neovascularization process in vivo. Nevertheless, at low doses AGEs induce endothelial cell proliferation and angiogenesis in the chorioallantoic membrane, whereas at high doses AGEs inhibit these processes (32, 35). Hence, one can hypothesize that the local level of AGE accumulation within the tissue may differently control cell proliferation and subsequently the neovascularization reaction. Alternatively, the local microenvironment (i.e., type of tissue, extracellular-matrix abundance, and endothelial cell phenotype) may also influence the effect of AGE accumulation on the local biological process.
Because collateral network formation is a complex process, the mechanisms by which diabetes may affect angiogenesis are potentially diverse. Reduction in new blood vessel formation might result from reduced expression of VEGF, because intramuscular adeno-VEGF gene transfer restores neovascularization in a mouse model of diabetes (3). The ability of monocytes to migrate in response to VEGF-A is attenuated in diabetic patients (37). The subsequent abrogated inflammatory reaction then might participate to the diabetes-related impairment of angiogenesis. Injection of exogenous CD34+ cells can accelerate the rate of restoration of blood flow to ischemic limbs of diabetic mice, suggesting that angioblast dysregulation, death, or dysfunction may also contribute to the altered angiogenic reaction seen in diabetes (38).
In conclusion, this study provides evidence that AGE formation associated with diabetes reduces extracellular-matrix degradation and subsequently abrogates the angiogenic process. These findings provide evidence that inhibition of AGE formation could be used to stimulate collateral vessel formation in the context of ischemia and may constitute an alternative therapeutic strategy to enhance new vessel growth in the setting of diabetes.
Acknowledgments
This work was supported by grants from Institut National de la Santé et de la Recherche Médicale and Université Paris VII. R.T. is a recipient of a Société Française de Pharmacologie fellowship.
This paper was submitted directly (Track II) to the PNAS office.
Abbreviations: AGE, advanced glycation end product; MMP, metalloproteinase; STZ, streptozotocin; TIMP, tissue inhibitor of metalloproteinase; VEGF, vascular endothelial growth factor.
References
- 1.Waltenberger, J. (2001) Cardiovasc. Res. 16 554-560. [DOI] [PubMed] [Google Scholar]
- 2.Abaci, A., Oguzhan, A., Kahraman, S., Eryol, N. K., Unal, S., Arinc, H. & Ergin, A. (1999) Circulation 99 2239-2242. [DOI] [PubMed] [Google Scholar]
- 3.Rivard, A., Silver, M., Chen, D., Kearney, M., Magner, M., Annex, B., Peters, K. & Isner, J. M. (1999) Am. J. Pathol. 154 355-363. [DOI] [PMC free article] [PubMed] [Google Scholar]
- 4.Brownlee, M. (2000) Metabolism 49 9-13. [DOI] [PubMed] [Google Scholar]
- 5.Hammes, H. P., Du, X., Edelstein, D., Tagushi, T., Matsumura, T., Ju, Q., Lin, J., Bierhaus, A., Nawroth, P., Hannak, D., et al. (2003) Nat. Med. 9 294-299. [DOI] [PubMed] [Google Scholar]
- 6.Paul, R. G. & Bailey, A. J. (1996) Int. J. Biochem. Cell Biol. 28 1297-1310. [DOI] [PubMed] [Google Scholar]
- 7.Wolffenbuttel, B. H., Boulanger, C. M, Crijns, F. R, Huijberts, M. S, Poitevin, P., Swennen, G. N., Vasan, S., Egan, J. J., Ulrich, P., Cerami, A. & Levy, B. I. (1998) Proc. Natl. Acad. Sci. USA 95 4630-4634. [DOI] [PMC free article] [PubMed] [Google Scholar]
- 8.Huijberts, M. S., Wollfenbuttel, B. H., Struijker-Boudier, H. A., Crijns, F. R., Kruseman, A. C., Poitevin, P. & Levy, B. I. (1993) J. Clin. Invest. 92 1407-1411. [DOI] [PMC free article] [PubMed] [Google Scholar]
- 9.Huijberts, M. S., Wolffenbuttel, B. H., Crijns, F. R., Nieuwenhuijzen-Kruseman, A. C., Bemelmans, M. H. & Struijker-Boudier, H. A. (1994) Diabetologia 37 10-14. [DOI] [PubMed] [Google Scholar]
- 10.Hammes, H. P., Weiss, A., Hess, S., Araki, S., Horiuchi, N., Brownlee, M. & Preissner, K. T. (1996) Lab. Invest. 75 325-328. [PubMed] [Google Scholar]
- 11.Conway, E. M., Collen, D. & Carmeliet, P. (2001) Cardiovasc. Res. 16 507-521. [DOI] [PubMed] [Google Scholar]
- 12.Billinghurst, R. C., Dahlberg, L., Ionescu, M., Reiner, A., Bourne, R., Rorabeck, C., Mitchell, P., Hambor, J., Diekmann, O., Tschesche, H., et al. (1997) J. Clin. Invest. 99 1534-1545. [DOI] [PMC free article] [PubMed] [Google Scholar]
- 13.Sukhova, G. K., Schonbeck, U., Rabkin, E., Schoen, F. J., Poole, A. R., Billinghurst, R. C. & Libby, P. (1999) Circulation 99 2503-2509. [DOI] [PubMed] [Google Scholar]
- 14.Vu, T. H., Shipley, J. M., Bergers, G., Berger, J. E., Helms, J. A., Hanahan, D., Shapiro, S. D., Senior, R. M. & Werb, Z. (1998) Cell 93 411-422. [DOI] [PMC free article] [PubMed] [Google Scholar]
- 15.Johnson, M. D., Choi Kim, H. R., Chesler, L., Tsao-Wu, G., Bouck, N. & Polverini, P. J. (1994) J. Cell. Physiol. 160 194-202. [DOI] [PubMed] [Google Scholar]
- 16.Silvestre, J. S., Mallat, Z., Tamarat, R., Duriez, M., Tedgui, A. & Levy, B. I. (2001) Circ. Res. 89 259-264. [DOI] [PubMed] [Google Scholar]
- 17.Wautier, M. P., Massin, P., Guillausseau, P., Huijberts, M., Levy, B., Boulanger, E., Laloi-Michelin, M. & Wautier, J. L. (2003) Diabetes Metab. 29 44-52. [DOI] [PubMed] [Google Scholar]
- 18.Teixeira, A. S. & Andrade, S. P. (1999) Life Sci. 64 655-662. [DOI] [PubMed] [Google Scholar]
- 19.Bucala, R., Tracey, K. J. & Cerami, A. (1991) J. Clin. Invest. 87 432-438. [DOI] [PMC free article] [PubMed] [Google Scholar]
- 20.Southan, G. J. & Szabo, C. (1996) Biochem. Pharmacol. 51 383-394. [DOI] [PubMed] [Google Scholar]
- 21.Murohara, T., Takayuki, A., Silver, M., Bauters, C., Masuda, H., Kalka, C., Kearney, M., Chen, D., Chen, D., Symes, J. F., et al. (1998) J. Clin. Invest. 101 2567-2578. [DOI] [PMC free article] [PubMed] [Google Scholar]
- 22.Tamarat, R., Silvestre, J. S., Kubis, N., Benessiano, J., Duriez, M., deGasparo, M., Henrion, D. & Levy, B. I. (2002) Hypertension 39 830-835. [DOI] [PubMed] [Google Scholar]
- 23.Griendling, K. K., Sorescu, D. & Ushio-Fukai, M. (2000) Circ. Res. 17 494-501. [DOI] [PubMed] [Google Scholar]
- 24.Ushio-Fukai, M., Tang, Y., Fukai, T., Dikalov, S. I., Ma, Y., Fujimoto, M., Quinn, M. T., Pagano, P. J., Johnson, C. & Alexander, R. W. (2002) Circ. Res. 91 1160-1167. [DOI] [PubMed] [Google Scholar]
- 25.Uemura, S., Matsushita, H., Li, W., Glassford, A. J., Asagami, T., Lee, K. H., Harrison, D. G. & Tsao, P. S. (2001) Circ. Res. 88 1291-1298. [DOI] [PubMed] [Google Scholar]
- 26.Takahashi, H., Akiba, K., Noguchi, T., Ohmura, T., Takahashi, R., Ezure, Y., Ohara, K. & Zieske, J. D. (2000) Curr. Eye Res. 21 608-615. [PubMed] [Google Scholar]
- 27.Oxlund, H. & Andreassen, T. T. (1992) Diabetologia 35 19-25. [DOI] [PubMed] [Google Scholar]
- 28.Reddy, G. K., Stehno-Bittel, L. & Enwemeka, C. S. (2002) Arch. Biochem. Biophys. 399 174-180. [DOI] [PubMed] [Google Scholar]
- 29.Seandel, M., Noack-Kunnmann, K., Zhu, D., Aimes, R. T. & Quigley, J. P. (2001) Blood 97 2323-2332. [DOI] [PubMed] [Google Scholar]
- 30.Lu, M., Kuroki, M., Amano, S., Tolentino, M., Keough, K., Kim, I., Bucala, R., Adamis, A. P. (1998) J. Clin. Invest. 15 1219-1224. [DOI] [PMC free article] [PubMed] [Google Scholar]
- 31.Treins, C., Giorgetti-Peraldi, S., Murdaca, J. & Van Obberghen, E. (2001) J. Biol. Chem. 23 43836-43841. [DOI] [PubMed] [Google Scholar]
- 32.Okamoto, T., Tanaka, S., Stan, A. C., Koike, T., Kase, M., Makita, Z., Sawa, H., Nagashima, K. (2002) Microvasc. Res. 63 186-195. [DOI] [PubMed] [Google Scholar]
- 33.Yamagishi, S., Yonekura, H., Yamamoto, Y., Katsuno, K., Sato, F., Mita, I., Ooka, H., Satozawa, N., Kawakami, T., Nomura, M. & Yamamoto, H. (1997) J. Biol. Chem. 28 8723-8730. [DOI] [PubMed] [Google Scholar]
- 34.Shepro, D. & Morel, N. M. (1993) FASEB J. 7 1031-1038. [DOI] [PubMed] [Google Scholar]
- 35.Chibber, R., Molinatti, P. A., Rosatto, N., Lambourne, B., Kohner, E. M. (1997) Diabetologia 40 156-164. [DOI] [PubMed] [Google Scholar]
- 36.Sakata, N., Meng, J. & Takebayashi, S. (2000) J. Atheroscler. Thromb. 7 169-176. [DOI] [PubMed] [Google Scholar]
- 37.Waltenberger, J., Lange, J. & Kranz, A. (2000) Circulation 102 185-190. [DOI] [PubMed] [Google Scholar]
- 38.Schatteman, G. C., Hanlon, H. D., Jiao, C., Dodds, S. G. & Christy, B. A. (2000) J. Clin. Invest. 106 571-578. [DOI] [PMC free article] [PubMed] [Google Scholar]