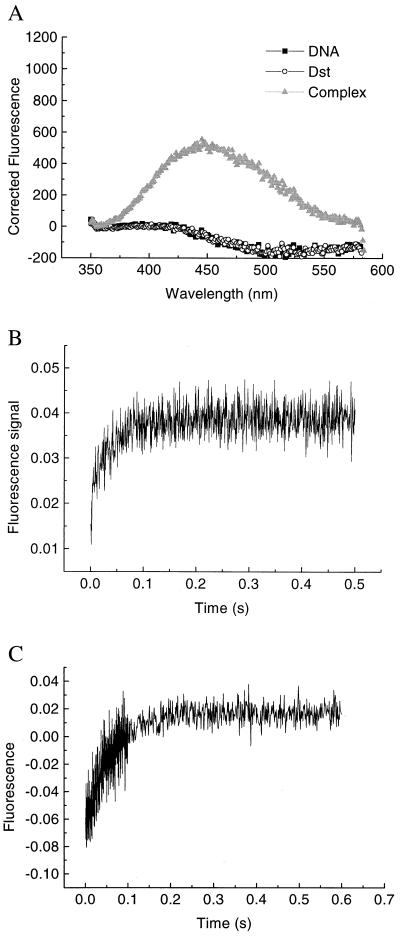
Figure 2.
(A) Steady-state fluorescence change on Dst binding to the 1:1 sites, shown here for a solution containing 2.5 μM each of Dst and DNA. Samples were irradiated at 300 nm with excitation slit at 5 nm and emission slit at 10 nm. (B) Representative fluorescence-detected stopped-flow trace of Dst binding to its 1:1 binding site under excess Dst conditions. The trace shown here corresponds to a reaction in which the final concentration of Dst and 1:1 site was 1.25 μM and 500 nM. (C) Representative stopped-flow trace of the slow phase observable under excess DNA conditions. Shown here [1:1DNA] = 15 μM and [Dst] = 2.5 μM.

