

Abstract
Ca2+ sparks are brief, localized elevations of myoplasmic [Ca2+] caused by release of increments of Ca2+ via sarcoplasmic reticulum Ca2+ release channels in muscle. The properties of individual sparks provide information regarding the opening of sarcoplasmic reticulum Ca2+ channels within functioning cells. Here we use high-speed confocal microscopy to show that individual Ca2+ sparks activated by membrane depolarization in single frog skeletal muscle fibers can be terminated prematurely by repolarization. Thus, either voltage sensor deactivation on repolarization or release channel inactivation during continued depolarization can terminate the Ca2+ release channel activity underlying voltage-activated Ca2+ sparks in skeletal muscle.
In skeletal muscle, electrical depolarization of the transverse (t) tubules, a system of tubular invaginations of the surface membrane, initiates Ca2+ release from the adjacent sarcoplasmic reticulum (SR). Dihydropyridine receptor (DHPR) voltage sensors in the t-tubule membrane (1) sense and respond to the t-tubule membrane depolarization by activating ryanodine receptor (RyR) Ca2+ release channels in the immediately apposed junctional face membrane of the SR (2), thereby allowing release of accumulated Ca2+ from the SR. In skeletal muscle, the DHPR voltage sensors appear to activate the RyR Ca2+ channels via direct or indirect macromolecular interactions, because Ca2+ influx via the t-tubule DHPR is unnecessary for activation of SR Ca2+ release in skeletal muscle (3). This is in contrast to cardiac muscle, in which Ca2+ influx via DHPR Ca2+ channels is necessary for activation of SR Ca2+ release channels (4). Deactivation of the DHPR voltage sensors in skeletal muscle by fiber repolarization terminates Ca2+ release via the SR RyR Ca2+ release channels (5).
It has recently been found that spatio-temporal summation of large numbers of local Ca2+ release events (Ca2+ “sparks”; ref. 6) occurring at high frequencies may underlie the global [Ca2+] transient produced by depolarization of both cardiac (7, 8) and skeletal muscle (9–11). However, whereas it is now well established that voltage sensor activation during depolarization can clearly initiate Ca2+ sparks, it is not known whether voltage sensor deactivation by repolarization can modify the properties of a spark once it has been initiated. We now address this question by using high-speed line-scan confocal microscopy of voltage-clamped segments of frog skeletal muscle fibers. Our results show that Ca2+ sparks initiated close to the time of fiber repolarization have shorter mean rise-times and smaller mean amplitudes than sparks initiated during maintained depolarization, indicating that voltage sensor deactivation can prematurely terminate the Ca2+ release underlying an individual spark. Because at most one voltage sensor was likely to be active per triad in these experiments, closure of the sarcoplasmic reticulum Ca2+ release channel(s) controlled by a single voltage sensor is sufficient to terminate a spark. These observations are consistent with summation of shortened Ca2+ sparks during an action potential and with both the initiation and termination of Ca2+ sparks by voltage sensors during excitation-contraction coupling in frog skeletal muscle.
Experimental Procedures
We used a video-rate confocal microscope in line-scan mode to record the fluorescence (F) of the Ca2+ indicator, fluo-3, in a voltage-clamped frog skeletal muscle fiber as described (12). In brief, cut segments of single frog fibers were dissected from the ileofibularis muscle, were mounted in a double-Vaseline gap voltage-clamp chamber in relaxing solution, were stretched to 3.6–4.0 μm per sarcomere, and were notched just beyond the Vaseline seals in the end pools. The solutions bathing cut ends and intact portion of the fiber in the middle pool of the chamber were then changed respectively to the internal and external solutions used for the experiments. The fiber preparation and solutions were as in ref. 12. The fluorescent Ca2+ indicator dye fluo-3 (50 μM) was included in the end pool solution and was diffused into the fiber during the approximately 40- to 45-min equilibration time between application of the internal solution and the start of data recording.
The fibers were voltage clamped at a holding potential of 0 mV, which inactivated all voltage sensors (13, 14). Restoration of a small fraction of voltage sensors was achieved by appropriately adjusting the duration (0.3–2 s) of a repriming pulse to −90 mV just before application of each depolarizing test pulse (15). The fluo-3 fluorescence was monitored by using a Nikon RCM-8000 video-rate confocal scanner, operating in line-scan mode (12). Each confocal image was generated by scanning a laser spot along the fiber, parallel to the fiber axis, every 63 μs, resulting in line-scan images of 512 × 480 pixels acquired in 30 ms. The voltage-clamp circuit was triggered by a signal synchronized to the confocal scanner so that recording began shortly before the application of the test pulse. The resolution of the confocal system was determined, using subresolution fluorescent beads in air, to be 0.4 μm in the x and y axes, and 0.8 μm along the z axis. Ca2+ sparks recorded with the present high-speed system were identified and analyzed as described (12). The sparks selected for inclusion here had peak amplitudes ≥0.4 (ΔF/F) and rise times ≥0.5 ms, as determined from successful fits of an empirical function (below) to the observed spark time courses.
Results
A repriming protocol was used to activate a small fraction of voltage sensors (15), thereby reducing the frequency of sparks during the pulse. Under these conditions, fewer than 1% of all triads showed any spark activity, and among those active triads, individual sparks were temporally separated. Fig. 1A shows five individual Ca2+ sparks activated during 15-ms depolarizations to +40 mV. Each panel consists of the line-scan “strip” image of the triad containing the spark, presented in pseudocolor, and the time course of the change in fluorescence at the center of the triad (black line above the image), both represented as ΔF/F. Superimposed on the time course record is a nonlinear least squares fit (red line) of the following empirical function, which was fit to the time course of ΔF/F of each identified spark:
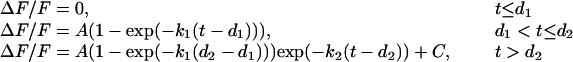 |
where t is time after the start of the pulse. The parameters A, C, k1, k2, d1, and d2 were adjusted to give the best least squares fit to the ΔF/F time course of each identified spark. The result of this fitting procedure provided estimates of the latency to activation after the start of the depolarization (d1), the rise-time (d2 − d1), the peak amplitude [A(1 − exp(−k1 (d2 − d1)))], the initial rate of rise (Ak1), and the time constant of the falling phase (1/k2) of each spark (12). This function has previously been shown to provide a good fit to the observed spark time courses during longer depolarizing pulses (12) and was now found to also provide good fits to sparks elicited by shorter duration depolarizing pulses.
Figure 1.

Ca2+ sparks in frog skeletal muscle. Sparks were recorded during voltage-clamp depolarizations to +40 mV after repriming fibers for 0.3–2 s at −90 mV. Each panel consists of five identified sparks obtained during depolarizations of 15 ms (A) or 3 ms (B). Individual sparks were identified by using selection criteria described in ref. 7 and are displayed as strip images of ΔF/F (below) obtained from high-speed confocal line-scan images, and the time course of ΔF/F averaged over 5 pixels (1.1 μm) at the center of the identified triad (black line, above). Superimposed on each ΔF/F time course is a fit of an empirical function (red line) to the data (12). The fitting procedure provided estimates of the latency, rise time, peak amplitude, and time constant of decline of ΔF/F for each identified spark. The relative timing of the depolarization is shown diagrammatically at the bottom; the repriming interval that preceded each test pulse is not shown.
Ca2+ sparks activated by a large membrane depolarization occur at highest frequency during the first 5–10 ms of the depolarizing pulse, and at a much lower steady frequency later in the pulse (11), so that most of the sparks during a 15-ms pulse occurred well before the end of the pulse. To examine release events that occur in close proximity to the end of a pulse, and thus might be influenced by voltage sensor deactivation on repolarization, we also examined sparks activated during brief (3-ms) depolarizations (Fig. 1B). In addition, sparks were also recorded by using 6- and 60-ms pulses (not shown). The rise-time and amplitude of each spark was determined from fits similar to those in Fig. 1 A and B.
Sparks activated during longer depolarizations showed a broader distribution of rise-times than the rise-time distribution for the 3-ms pulses (Fig. 2A, significance tests in legend), with mean values significantly larger than for the 3-ms pulses (Fig. 2B). Thus, on average, the shortest pulses gave sparks with the shortest rise-times. Fig. 2C shows that the mean peak amplitudes of sparks also were smallest for the shortest depolarizations. During relatively large depolarizations as used here, most sparks are initiated close to the start of the pulse. Thus, the repolarization after the shortest pulses used here was much more likely to occur during the rising phase of a spark than the repolarization after the longer pulses. Because Ca2+ is being released during the rising phase of the spark (16–18), repolarization after the shortest pulses was much more likely to occur during Ca2+ release. Consequently, the shorter mean rise time and smaller mean amplitude of the sparks after the shortest pulse (Fig. 2 B and C) could be accounted for if voltage sensor deactivation halted Ca2+ release during previously initiated Ca2+ sparks.
Figure 2.

Histograms of the rise-time of identified Ca2+ sparks recorded during depolarizations of duration 3, 6, 15, or 60 ms. The solid bars in the panels corresponding to the 6-, 15-, and 60-ms depolarizations represent the rise-time distribution of the 3-ms depolarization, scaled to the maximum value of the open-bar distribution, showing the relative increase of sparks with longer rise-times in the longer depolarizations. (B) The mean rise-time. (C) The mean peak amplitude of Ca2+ sparks as a function of the pulse duration. The points represent the mean ± SEM of 83, 276, 138, or 162 sparks (respectively, for 3-, 6-, 15-, or 60-ms pulses) from 11 fibers. Sparks were recorded for two different pulse durations in each fiber. The rise-time distributions were analyzed by a Kolmogorov–Smirnov test (37), which established their non-normality (P < 0.05). Consequently, the rise-times were compared by two nonparametric tests. A Kruskall–Wallis test indicated an overall significant difference between the rise-times of sparks obtained during depolarizations of 3-, 6-, 15-, and 60-ms (P < 10−5), showing that the observed increase in rise-time results from the increase in pulse duration. A Mann–Whitney test was then applied to perform comparisons between groups. The four comparisons (pulse duration 3 ms versus 6, 15, and 60 ms, and pulse duration 6 ms versus 60) were statistically different (P < 0.01). An additional analysis performed on the spark amplitudes gave similar results.
The latency to activation of a spark within a triad during a depolarization (Fig. 3A) was relatively unaffected by the duration of the depolarizing pulse. However, repolarization dramatically reduced the spark activity after pulses of any duration (Fig. 3A). Thus, voltage sensor deactivation by repolarization prevented the further activation of sparks. This is in agreement with estimates of SR Ca2+ release flux from nonconfocal “macroscopic” measurements (5) in which Ca2+ release was shown to be under tight control of the t-tubular membrane potential.
Figure 3.

(A) Latency histograms of identified Ca2+ sparks for depolarizations of 3, 6, 15, and 60 ms. The relative timing of the depolarization is shown at the top, aligned at the rising edge of the pulse. The latency after the start of the depolarization was determined from the fitting procedure to each identified spark (12), (B–E) Mean values of the rise-time (B), peak (C), initial rate of rise (D), and time constant of decline of fluorescence (E) of Ca2+ sparks, plotted as a function of spark latency relative to the end of the depolarization for all pulse durations (3, 6, 15, and 60 ms). The straight line segments in each panel represent the best fit of a function that identified points of inflection in the data. In B and C, this point is indicated by downward arrows. The timing of the depolarizations is shown at the top, now aligned at the falling edge of the depolarization: i.e., the time of repolarization. The points represent the mean ± SEM of values from a total of 550 sparks from 11 fibers, binned in 1-ms intervals for all pulse durations. However, only six sparks from the 60-ms depolarizations are represented because of the relative paucity of sparks occurring late (>48 ms) in this pulse.
The deactivation of t-tubule voltage sensors after the pulse occurred with a delay caused by the finite charging time of the t-tubular system. The t-tubular system constitutes an electrical conductance and capacitance with distributed series resistance in parallel with the surface membrane (19, 20), so that step voltage changes on the surface membrane are propagated into the t-tubular system, where the voltage sensors that initiate Ca2+ release are localized, with a delay of about 2–4 ms. This delay accounted for the occurrence of spark latencies greater than the pulse duration. Variability of this delay between experiments may have been minimized by routinely focusing near the bottom edge of fibers to achieve optimal confocal recording. The description of the relative time of the pulse is referred to the voltage-clamp command pulse, as shown in Figs. 1 and 3.
For depolarizations of any duration used in this study, sparks that began from 2 ms before the termination of the pulse until a few milliseconds after the end of the command pulse exhibited rise-time durations that became briefer as the spark latency approached and exceeded the end of the pulse (Fig. 3B). Thus, the right-most points in Fig. 3B, representing Ca2+ sparks activated after the end of the command pulse, had the smallest mean rise-times observed in these experiments. This included sparks activated during relatively brief depolarizations (3- to 6-ms pulses), as well as sparks activated during longer depolarizations but having long latencies such that the spark originated close to the time of the termination of the pulse (e.g., Fig. 1A, second and fourth panels from top). The mean peak amplitude of Ca2+ sparks also became smaller the later the spark latency relative to the end of the pulse (Fig. 3C). Because sparks were more likely to be interrupted by repolarization after the shortest pulses, these observations would be consistent with premature closing of the Ca2+ release channels underlying the spark by voltage sensor deactivation at the end of the short pulse.
In contrast to the spark rise time and amplitude, which became smaller as the spark latency approached and exceeded the end of the pulse (Fig. 3 B and C), the initial rate of rise of spark fluorescence (Fig. 3D) and time course of the decline of fluorescence after the peak of the spark (Fig. 3E) were uncorrelated with spark latency relative to the end of the pulse. The former observation shows that the initial Ca2+ flux responsible for generating a spark was, on average, similar for all identified sparks, including those having smaller rise-times and amplitudes and that occurred near the end of the pulse (Fig. 3 A and B). The latter observation is consistent with a mechanism for decline of spark fluorescence determined predominantly by Ca2+ diffusion and binding to intrinsic sites and to the indicator, fluo-3, within myoplasm (16), and thus independent of the time of repolarization relative to the latency of the spark.
Slope changes in the data of Fig. 3 B–E were identified by fitting a function consisting of two contiguous line segments to the data in each panel. The fitting procedure minimized the value of χ2 while advancing the intersection point of the two line segments along the data. Each mean value in Fig. 3 B–E was weighted in inverse proportion to its SD for the fit. The best fit to the data in each panel is shown as straight line segments. The arrows identify a common point of inflection in the data of Fig. 3 B and C, occurring for latencies less than 2 (B) or 3 (C) ms before the time of repolarization. The points to the right and left of the arrows are plotted in Fig. 4 A and B, respectively. For sparks beginning within 2 ms of or after the end of the pulse, and thus likely to have been terminated prematurely by repolarization, there is a linear correlation between the mean rise-time and mean amplitude of sparks starting at different times relative to the end of the pulse (Fig. 4A). This observation constitutes the first demonstration of an anticipated correlation between spark rise-time and peak amplitude (16). When repolarization prematurely terminates the Ca2+ release underlying a spark, both the duration of the rising phase and the amplitude of the spark would be expected to decrease in parallel the earlier the spark is terminated, consistent with the correlation observed here for sparks occurring near the end of the pulse (Fig. 4A).
Figure 4.

The relationship between amplitude and rise-time of Ca2+ sparks. (A) Sparks originating less than 2 ms before, or after the time of repolarization. (B) Sparks originating more than 2 ms before the termination of the depolarization. The points are replotted from Fig. 2 B and C. The lines represent a linear, least-squares fit of a straight line to the data. The slope of the fit in B is not significantly different from zero.
There was no correlation between rise-time and amplitude for sparks beginning well before (>2 ms) the end of the pulse, and thus terminated by voltage-independent mechanisms (Fig. 4B). This lack of correlation has been observed previously and has been attributed (12) to a possible regulation of the amount of Ca2+ released through a SR Ca2+ channel during a relatively long depolarizing pulse (21), in which case channel closing would be nonstochastic. Such a nonstochastic mechanism for channel closing would be consistent with previous observations that repeated sparks recorded at a given spatial location in both skeletal (22) and cardiac (23, 24) muscle, as well as in a skeletal muscle expression system (25), exhibit very similar amplitudes rather than the distribution of amplitudes expected for the distribution of open times associated with a stochastic process.
Discussion
Depolarization of a skeletal muscle fiber activates dihydropyridine receptor (DHPR) voltage sensors in the t-tubules (1) which, in turn, cause ryanodine receptor (RyR) Ca2+ release channels in the SR membrane to open and conduct Ca2+. Under appropriate recording conditions, the opening of Ca2+ release channels is detected as a Ca2+ spark. The present results indicate that the Ca2+ release underlying a spark can be terminated by one of two distinct mechanisms. The first, a voltage-independent mechanism, is probably responsible for terminating sparks that occur during relatively long depolarizations and, in chronically depolarized fibers, during ligand-activation of Ca2+ sparks, which likely accounts for their similar waveform (11, 26). This mechanism probably involves Ca2+-induced inactivation of RyRs (27–29) but is unlikely to involve voltage sensor flickering because spark rise-times are voltage-independent during long depolarizations (11). However, the present results now demonstrate that depolarization-activated sparks can also be terminated by membrane repolarization. This effect can be detected (e.g., Fig. 1A) during brief (≈3-ms) depolarizations when voltage sensor deactivation causes the RyR Ca2+ release channels to close before Ca2+-induced inactivation occurs, resulting in a parallel reduction (Fig. 4A) of both the rise-time (Fig. 3B) and amplitude (Fig. 3C) of the Ca2+ spark.
Fig. 5 shows cartoon representations of the t-tubule-SR junction corresponding to our experimental results. Membrane potential-dependent states of the DHPR voltage sensors in the t-tubule membrane (left membrane in each panel of Fig. 5) and voltage sensor- and ligand-dependent states of the RyR Ca2+ release channels in the apposed SR membrane (right membrane in each panel) are indicated. RyRs coupled to and not coupled to DHPR voltage sensor tetrads may alternate in a double row “checkerboard” array along the t-tubule-SR junction in frog skeletal muscle fibers, as has been shown for toad fish swim bladder (2). Only one of the two rows is shown in Fig. 5. Binding sites mediating Ca2+-dependent activation (a) and inactivation (i) are indicated on each RyR (Fig. 5A). Each panel in Fig. 5 represents a different phase of the voltage pulse protocols used in these experiments. A 0.3- to 2.0-s repolarization to −90 mV from a chronically depolarized holding potential of 0 mV was used to reprime a small fraction of the voltage sensor units (Fig. 5A, top DHPR tetrad), so that at most a single voltage sensor unit was likely to be reprimed per junctional region. During a subsequent large depolarization, any reprimed voltage sensor units would be activated which, in turn, would cause the RyR Ca2+ release channel directly coupled to the activated DHPR to open and conduct Ca2+ (Fig. 5B, top RyR), thereby initiating a Ca2+ spark. Neighboring release channels not coupled to voltage sensors might be activated by Ca2+-induced Ca2+ release caused by locally elevated [Ca2+] and mediated by Ca2+ binding to the a site (Fig. 5B, middle RyR). It is not known whether a Ca2+ spark can be generated by the opening of a single RyR Ca2+ release channel, or whether multiple channels (Fig. 5B) are required (30–32). If the latter, then the multiple channels must be synchronized both in their openings at the start of the spark and in their closings at the peak of the spark to account for the abrupt change in fluorescence time-course at the start and peak of a spark (12).
Figure 5.

Model of SR Ca2+ release channel activity underlying sparks terminated by voltage-dependent and voltage-independent mechanisms. Interactions between the ryanodine receptor (RyR) Ca2+ release channel in the SR membrane (right in each panel) and both the voltage sensor (DHPR tetrad) in the t-tubular membrane (left in each panel) and local Ca2+ (gray dots) are shown, with Ca2+ activation (a) and inactivation (i) sites on each RyR indicated in A. In A, all RyRs (green) are closed. The top RyR is coupled to a single reprimed but not activated DHPR tetrad (blue), which is thus available for activation by depolarization. The middle RyR is not coupled to DHPRs but is available for Ca2+ activation secondary to voltage-activated Ca2+ release. The lower RyR is coupled to a nonreprimed DHPR (chartreuse) and thus is unavailable for voltage activation. On depolarization (B), and the resulting DHPR activation (red), the RyR channel coupled to the activated DHPR tetrad opens (red) to conduct Ca2+, which subsequently activates (a) the neighboring non-DHPR coupled channel (red) by Ca2+-induced Ca2+ release. Both open channels may contribute to the generation of a Ca2+ spark. If the depolarization is maintained (C), the DHPR-coupled RyR closes (gray) by a voltage-independent mechanism, probably related to Ca2+ -induced inactivation (i) of the RyR despite the continued activating influence of the voltage sensor (red). If the depolarization is terminated before the RyR is inactivated, the DHPR closes the RyR by voltage sensor deactivation (e.g., B to A; DHPR deactivation), resulting in a Ca2+ spark of briefer rise-time and smaller amplitude. Idealized ΔF/F time courses of a Ca2+ spark generated by DHPR activation with subsequent DHPR deactivation (Upper) or subsequent RyR inactivation (Lower) are shown. The bar beneath each time-course indicates panels (A–C) that represent each phase of the spark ΔF/F time course.
Fig. 5 presents two different mechanisms of closing of the RyR Ca2+ release channels underlying the sparks as distinguished in the present experiments. Spark termination caused by Ca2+-dependent RyR inactivation (Fig. 5C, top RyR) occurs even when the DHPR voltage sensors remain in the activated state (Fig. 5C, top DHPRs), such as during a long depolarization. In contrast, when the voltage sensor activation is reversed by repolarization (DHPR deactivation) after a short pulse (Fig. 5A), the release channels close sooner, on average, than they would have during maintained activation of the voltage sensors. This results in sparks of briefer rise time and smaller amplitude than those occurring during a long pulse, as indicated by the upper and lower schematic time courses of triadic fluorescence changes in Fig. 5 and as observed in these experiments.
An as yet unanswered question concerns how a channel directly regulated by the voltage sensors can maintain control of neighboring channels activated by Ca2+-induced Ca2+ release. A model (33) for Ca2+ release underlying Ca2+ sparks in skeletal muscle has been proposed to account for openings among multiple RyR Ca2+ release channels, involving direct activation of channels directly coupled to voltage sensors (2), then secondary propagation of activation via Ca2+-induced Ca2+ release to nearby, uncoupled channels. As originally formulated, this model predicts that “repolarization does not stop sparks already in process” (ref. 33, p. 426), which is inconsistent with the present observation that repolarization terminates voltage-activated Ca2+ sparks prematurely. Our observation thus indicates that, if multiple RyR Ca2+ release channels are involved in generating a Ca2+ spark, then release channels not coupled to voltage sensors must be “slaved” to activation/deactivation of adjacent channels that are coupled to active voltage sensors. For example, possible sub-millisecond flickering of the Ca2+-activated channel (34), together with rapid dissipation of locally elevated [Ca2+] in the immediate vicinity of an open Ca2+ channel when the channel closes (35), might provide a mechanistic basis for tight coupling of the open time of the Ca2+-activated channel to that of the neighboring voltage sensor-controlled channel. Such tight coupling would appear to require that propagation to more distant channels is probably not significant.
In contrast to the premature termination of Ca2+ sparks observed here in skeletal muscle, Ca2+ sparks initiated by depolarization of cardiac myocytes are activated by Ca2+ influx via DHPRs. Once initiated by local [Ca2+] elevation, such cardiac sparks are not influenced by further DHPR Ca2+ influx (36) and therefore would not be terminated by repolarization. Thus, the ability of repolarization to prematurely turn off Ca2+ release during Ca2+ sparks that we describe here provides a unique characteristic of skeletal excitation-contraction coupling that serves as a basis for brief Ca2+ release during a skeletal muscle action potential.
Acknowledgments
We thank Dr. Paco Lorente for assistance with statistical procedures and Alex Shtifman for help with Fig. 5. This work was supported by National Institutes of Health Grant NS23346 and National Science Foundation Grant MCB-9724045 to M.F.S, National Institutes of Health Grant AR44197 to M.G.K, and a grant from Fondation pour la Recherche Medicale and Melzer Foundation to A.L.
Abbreviations
- SR
sarcoplasmic reticulum
- t
transverse
- DHPR
dihydropyridine receptor
- RyR
ryanodine receptor
Footnotes
This paper was submitted directly (Track II) to the PNAS office.
References
- 1.Tanabe T, Beam K G, Adams B A, Niidome T, Numa S. Nature (London) 1990;346:567–569. doi: 10.1038/346567a0. [DOI] [PubMed] [Google Scholar]
- 2.Block B A, Imagawa T, Campbell K P, Franzini-Armstrong C. J Cell Biol. 1988;107:2587–2600. doi: 10.1083/jcb.107.6.2587. [DOI] [PMC free article] [PubMed] [Google Scholar]
- 3.Armstrong C M, Bezanilla F M, Horowicz P. Biochim Biophys Acta. 1972;267:605–608. doi: 10.1016/0005-2728(72)90194-6. [DOI] [PubMed] [Google Scholar]
- 4.Bers D M. Excitation-Contraction Coupling and Cardiac Contractile Force. Dordrecht, The Netherlands: Kluwer; 1991. [Google Scholar]
- 5.Klein M G, Simon B J, Schneider M F. J Physiol. 1990;425:599–626. doi: 10.1113/jphysiol.1990.sp018120. [DOI] [PMC free article] [PubMed] [Google Scholar]
- 6.Cheng H, Lederer W J, Cannell M B. Science. 1993;262:740–744. doi: 10.1126/science.8235594. [DOI] [PubMed] [Google Scholar]
- 7.Lopez-Lopez J R, Shacklock P S, Balke C W, Wier W G. Science. 1995;268:1042–1045. doi: 10.1126/science.7754383. [DOI] [PubMed] [Google Scholar]
- 8.Cannell M B, Cheng H, Lederer W J. Science. 1995;268:1045–1049. doi: 10.1126/science.7754384. [DOI] [PubMed] [Google Scholar]
- 9.Tsugorka A, Rios E, Blatter L A. Science. 1995;269:1723–1726. doi: 10.1126/science.7569901. [DOI] [PubMed] [Google Scholar]
- 10.Klein M G, Cheng H, Santana L F, Jiang Y H, Lederer W J, Schneider M F. Nature (London) 1996;379:455–458. doi: 10.1038/379455a0. [DOI] [PubMed] [Google Scholar]
- 11.Klein M G, Lacampagne A, Schneider M F. Proc Natl Acad Sci USA. 1997;94:11061–11066. doi: 10.1073/pnas.94.20.11061. [DOI] [PMC free article] [PubMed] [Google Scholar]
- 12.Lacampagne A, Ward C W, Klein M G, Schneider M F. J Gen Physiol. 1999;113:187–198. doi: 10.1085/jgp.113.2.187. [DOI] [PMC free article] [PubMed] [Google Scholar]
- 13.Hodgkin A L, Horowicz P. J Physiol. 1960;153:386–403. doi: 10.1113/jphysiol.1960.sp006541. [DOI] [PMC free article] [PubMed] [Google Scholar]
- 14.Chandler W K, Rakowski R F, Schneider M F. J Physiol. 1976;254:285–316. doi: 10.1113/jphysiol.1976.sp011233. [DOI] [PMC free article] [PubMed] [Google Scholar]
- 15.Lacampagne A, Lederer W J, Schneider M F, Klein M G. J Physiol (London) 1996;497:581–588. doi: 10.1113/jphysiol.1996.sp021791. [DOI] [PMC free article] [PubMed] [Google Scholar]
- 16.Pratusevich V R, Balke C W. Biophys J. 1996;71:2942–2957. doi: 10.1016/S0006-3495(96)79525-5. [DOI] [PMC free article] [PubMed] [Google Scholar]
- 17.Smith G D, Keizer J E, Stern M D, Lederer W J, Cheng H. Biophys J. 1998;75:15–32. doi: 10.1016/S0006-3495(98)77491-0. [DOI] [PMC free article] [PubMed] [Google Scholar]
- 18.Jiang Y H, Klein M G, Schneider M F. Biophys J. 1999;77:2333–2357. doi: 10.1016/s0006-3495(99)77072-4. [DOI] [PMC free article] [PubMed] [Google Scholar]
- 19.Adrian R H, Chandler W K, Hodgkin A L. J Physiol (London) 1970;208:607–644. doi: 10.1113/jphysiol.1970.sp009139. [DOI] [PMC free article] [PubMed] [Google Scholar]
- 20.Schneider M F. J Gen Physiol. 1970;56:640. doi: 10.1085/jgp.56.5.640. [DOI] [PMC free article] [PubMed] [Google Scholar]
- 21.Jong D-S, Pape P C, Chandler W K, Baylor S M. J Gen Physiol. 1993;102:333–370. doi: 10.1085/jgp.102.2.333. [DOI] [PMC free article] [PubMed] [Google Scholar]
- 22.Klein M G, Lacampagne A, Schneider M F. J Physiol. 1999;515:391–411. doi: 10.1111/j.1469-7793.1999.391ac.x. [DOI] [PMC free article] [PubMed] [Google Scholar]
- 23.Parker I, Wier W G. J Physiol. 1997;505:337–344. doi: 10.1111/j.1469-7793.1997.337bb.x. [DOI] [PMC free article] [PubMed] [Google Scholar]
- 24.Bridge J B, Ershler P R, Cannell M B. J Physiol. 1999;518:469–478. doi: 10.1111/j.1469-7793.1999.0469p.x. [DOI] [PMC free article] [PubMed] [Google Scholar]
- 25.Ward C W, Schneider M F, Castillo D, Protasi F, Wang Y, Chen S R W, Allen P D. J Physiol. 2000;525:91–103. doi: 10.1111/j.1469-7793.2000.t01-2-00091.x. [DOI] [PMC free article] [PubMed] [Google Scholar]
- 26.Lacampagne A, Klein M G, Schneider M F. J Gen Physiol. 1998;111:207–224. doi: 10.1085/jgp.111.2.207. [DOI] [PMC free article] [PubMed] [Google Scholar]
- 27.Schneider M F, Simon B J. J Physiol. 1988;405:727. doi: 10.1113/jphysiol.1988.sp017358. [DOI] [PMC free article] [PubMed] [Google Scholar]
- 28.Meissner G. Annu Rev Physiol. 1994;56:485–508. doi: 10.1146/annurev.ph.56.030194.002413. [DOI] [PubMed] [Google Scholar]
- 29.Jong D-S, Pape P C, Baylor S M, Chandler W K. J Gen Physiol. 1995;106:337–388. doi: 10.1085/jgp.106.2.337. [DOI] [PMC free article] [PubMed] [Google Scholar]
- 30.Marx S O, Ondrias K, Marks A R. Science. 1998;281:818–821. doi: 10.1126/science.281.5378.818. [DOI] [PubMed] [Google Scholar]
- 31.Schneider M F. J Gen Physiol. 1999;113:365. doi: 10.1085/jgp.113.3.365. [DOI] [PMC free article] [PubMed] [Google Scholar]
- 32.Shirokova N, Gonzalez A, Kirsch W G, Rios E, Pizarro G, Stern M D, Cheng H. J Gen Physiol. 1999;113:377–384. doi: 10.1085/jgp.113.3.377. [DOI] [PMC free article] [PubMed] [Google Scholar]
- 33.Stern M D, Pizarro G, Rios E. J Gen Physiol. 1997;110:415–440. doi: 10.1085/jgp.110.4.415. [DOI] [PMC free article] [PubMed] [Google Scholar]
- 34.Fill M D, Stefani E, Nelson T E. Biophys J. 1991;59:1085–1090. doi: 10.1016/S0006-3495(91)82323-2. [DOI] [PMC free article] [PubMed] [Google Scholar]
- 35.Simon S M, Llinas R R. Biophys J. 1985;48:485–498. doi: 10.1016/S0006-3495(85)83804-2. [DOI] [PMC free article] [PubMed] [Google Scholar]
- 36.Sham J S, Song L S, Chen Y, Deng L H, Stern M D, Lakatta E G, Cheng H. Proc Natl Acad Sci USA. 1998;95:15096–15101. doi: 10.1073/pnas.95.25.15096. [DOI] [PMC free article] [PubMed] [Google Scholar]
- 37.Lilliefors H W. J Am Stat Assoc. 1967;62:399. [Google Scholar]