

Abstract
A detailed mathematical model for the fission yeast mitotic cycle is developed based on positive and negative feedback loops by which Cdc13/Cdc2 kinase activates and inactivates itself. Positive feedbacks are created by Cdc13/Cdc2-dependent phosphorylation of specific substrates: inactivating its negative regulators (Rum1, Ste9 and Wee1/Mik1) and activating its positive regulator (Cdc25). A slow negative feedback loop is turned on during mitosis by activation of Slp1/anaphase-promoting complex (APC), which indirectly re-activates the negative regulators, leading to a drop in Cdc13/Cdc2 activity and exit from mitosis. The model explains how fission yeast cells can exit mitosis in the absence of Ste9 (Cdc13 degradation) and Rum1 (an inhibitor of Cdc13/Cdc2). We also show that, if the positive feedback loops accelerating the G2/M transition (through Wee1 and Cdc25) are weak, then cells can reset back to G2 from early stages of mitosis by premature activation of the negative feedback loop. This resetting can happen more than once, resulting in a quantized distribution of cycle times, as observed experimentally in wee1− cdc25Δ mutant cells. Our quantitative description of these quantized cycles demonstrates the utility of mathematical modeling, because these cycles cannot be understood by intuitive arguments alone.
An important feature of the eukaryotic cell cycle is the strict alternation of DNA synthesis (S phase) and mitosis (M phase), enforced by enzymes, called cyclin-dependent kinases (CDKs), that regulate the activities of many proteins involved in the mechanics of genome replication and nuclear division (1). CDKs are active only in partnership with regulatory subunits, called cyclins. In lower eukaryotes like yeasts, there is only one essential CDK subunit (Cdk1), called Cdc2 in fission yeast. Cdc2 combines with three different B-type cyclins (Cig1, Cig2, and Cdc13), but only Cdc13 is essential to drive a complete cell cycle (2). Proper execution of the cell cycle requires that Cdc13/Cdc2 activity oscillates between low (G1), intermediate (S and G2), and high (M) levels (3). These different cell cycle phases are achieved by antagonistic relationships between Cdc13/Cdc2 kinase and its negative regulators (Ste9, Rum1, and Wee1/Mik1) (4). In G1 phase, Cdc13 level is low because Ste9 (also known as Srw1) targets Cdc13 for ubiquitination by the anaphase-promoting complex (APC, also known as cyclosome) and ultimately for degradation by proteasomes. In addition, G1 cells contain abundant Rum1, a stoichiometric inhibitor of the Cdc13/Cdc2 complex (5). At the G1/S transition, both Ste9 (M. Blanco, A. Sanchez-Diaz, and S. Moreno, personal communication) and Rum1 (6) are phosphorylated, which inactivates Ste9 and promotes degradation of Rum1. As a consequence, the Cdc13 level starts to rise and cells enter S phase. However, Cdc13/Cdc2 kinase activity is depressed by phosphorylation of the Tyr-15 residue of Cdc2 by two tyrosine kinases, Wee1 and Mik1, during S and G2 phases. Mik1 is kept active by unreplicated DNA (7), whereas Wee1 is active during early G2. In late G2, Wee1 is phosphorylated and inactivated by Cdc13/Cdc2 (8). The inhibitory phosphate group on Tyr-15 of Cdc2 is removed by a phosphatase, Cdc25, which is activated by Cdc13/Cdc2 at this time (9).
At the end of the cycle, all of the negative regulators are turned back on, Cdc13/Cdc2 kinase activity is lost, and the cell leaves mitosis. The mechanism of activation of the negative regulators is largely unknown in fission yeast. In budding yeast, a phosphatase (Cdc14) has been shown to up-regulate the corresponding negative regulators, Sic1 and Cdh1 (10, 11). Here we propose a similar mechanism working in fission yeast, in which a yet unknown phosphatase, analogous to Cdc14, dephosphorylates Rum1, Ste9, and the tyrosine-modifying enzymes (Wee1, Mik1, and Cdc25). With this model in hand, we show how fission yeast cells exit mitosis in the absence of Ste9 and Rum1. As a bonus, we observe an interesting resetting mechanism from early stages of mitosis back to G2 phase, which explains the curious quantized cycles of fission yeast mutant cells (wee1− cdc25Δ) lacking the major G2/M regulators (12).
The Model
Our present model (Fig. 1) is a combination of several earlier efforts (4, 13, 14). At its core are antagonistic interactions between Cdc13/Cdc2 (M-phase promoting factor, MPF) and its negative regulators, Ste9, Rum1, and Wee1/Mik1. Ste9 targets Cdc13 subunits for ubiquitination by the APC (15, 16). Rum1 is a cyclin-dependent kinase inhibitor, which reversibly binds to Cdc13/Cdc2 and inhibits its activity (17). Wee1 and Mik1 are tyrosine kinases that phosphorylate the Cdc2 subunit on Tyr-15, thereby inhibiting its activity (18, 19). MPF phosphorylates all its negative regulators, and this phosphorylation is either inhibitory, as in the case of Ste9 (M. Blanco et al., personal communication) and Wee1 (8), or promotes degradation of the molecule (Rum1) (6). By inactivating the proteins that oppose it, Cdc13/Cdc2 promotes its own activation (“positive feedback”).
Figure 1.

A molecular mechanism for the regulation of Cdc13-associated kinase activity in fission yeast. All of the events of the fission yeast cell cycle can be orchestrated by fluctuations of the activity of a single cyclin-dependent kinase, Cdc13/Cdc2. Cdc13 is synthesized from amino acids (AA) and combines readily with catalytic subunits, Cdc2, which are assumed to be always present in excess. The activity of Cdc13/Cdc2 is modulated by Rum1 inhibition, by Tyr-15 phosphorylation (via Wee1 and Mik1, which is reversed by Cdc25 and Pyp3; the last molecule is not shown on figure), and by Ste9-dependent cyclin degradation. Other cyclins (Puc1, Cig1, and Cig2, which are represented by X on the figure) in complex with Cdc2 can assist these processes.
In addition to inhibiting its enemies, MPF also activates its friend, Cdc25, the tyrosine phosphatase that converts preMPF (the tyrosine phosphorylated form of Cdc13/Cdc2) into active MPF (20). In the absence of Cdc25, a backup phosphatase, Pyp3, can do the job less effectively (21).
Cdc13/Cdc2 is helped to phosphorylate its enemies by Cdc2 subunits complexed to other cyclins (Puc1, Cig1, and Cig2) (22) that are less sensitive to Rum1 inhibition (23) and/or Ste9/APC-dependent degradation (M. Blanco et al., personal communication). For simplicity, these cyclin/Cdc2 complexes are lumped together in the model as a starter kinase (SK or Cdc2/X), with constant activity. The transition from mitosis to G1 is achieved by a negative feedback loop in which Cdc13/Cdc2 indirectly up-regulates its negative regulators by turning on a protein phosphatase (PP) analogous to Cdc14 in budding yeast (14). In our model, MPF activates Slp1/APC (24), which degrades a hypothetical inhibitor of PP. We propose that in fission yeast PP dephosphorylates the tyrosine-modifying enzymes (Wee1, Mik1, and Cdc25), as well as Rum1 and Ste9, thereby down-regulating the activity of Cdc13/Cdc2.
The mechanism in Fig. 1 is converted into a set of differential equations by using standard principles of biochemical kinetics (Table 1). After specifying the numerical values of numerous rate constants and Michaelis constants in these equations, numerical solution gives the concentrations of the variables as functions of time. Numerical values of the parameters were chosen so that the concentration profiles of cell cycle regulators are consistent with experiments on wild-type (WT) and mutant cells.
Table 1.
A mathematical model of the proposed mechanism (Fig. 1) for the fission yeast cell cycle
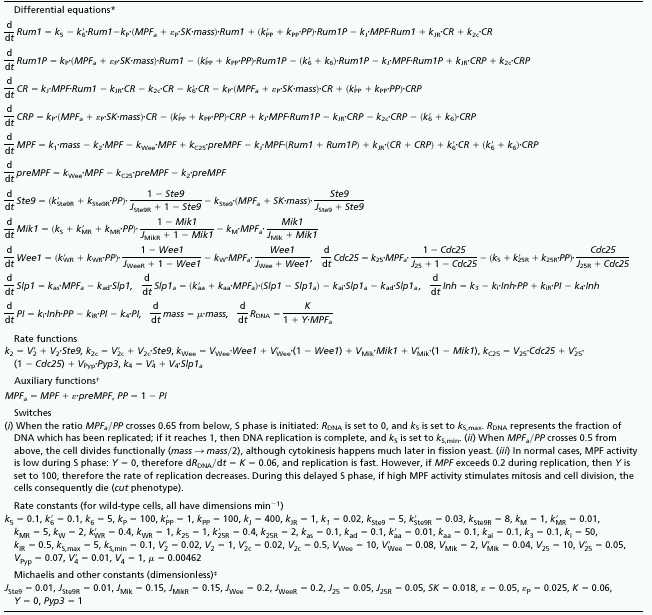 |
Italicized protein names (e.g., Cdc25) refer to the concentration of protein which is a dimensionless number. MPFa, the total kinase activity of MPF and preMPF; Rum1P, concentration of phosphorylated Rum1; CR, concentration of Cdc2/Cdc13/Rum1 trimeric complex; SK, the activity of starter kinases (Cdc2/X); CRP, concentration of Cdc2/Cdc13/Rum1P trimeric complex; Slp1a, the active form of Slp1; Inh, concentration of the inhibitor of PP; PI, concentration of PP/Inh dimer complex.
ɛ, the kinase activity of preMPF compared to MPF.
Because we choose these Michaelis constants all to be considerably smaller than 1, the corresponding enzyme activities, Ste9, Mik1, Wee1, and Cdc25, operate as “ultrasensitive” switches (25), i.e., they tend to be either “on” (activity = 1) or “off” (activity = 0).
Simulations with the Deterministic Model
The simulated cell cycle of WT fission yeast is presented in Fig. 2. The cell is born at a relative mass of 1, grows exponentially in time, and at a mass of 2 divides symmetrically into two identical daughter cells. During the short G1 phase (Fig. 2, Table 2), Cdc13/Cdc2 activity is kept low by high activities of Ste9, Rum1, and Wee1. (Nonetheless, our simplified version of G1/S control in this model overestimates the duration of G1 phase.) Soon after mitosis, Cdc13 level starts to rise as SK switch off Ste9 and promote degradation of Rum1. However, Cdc13/Cdc2 cannot be fully activated because Wee1 and Mik1 remain active. We assume that the tyrosine-phosphorylated form of Cdc13/Cdc2 retains some activity (5% of the unphosphorylated form), and this activity is sufficient to initiate DNA synthesis (with the help of SK). Meanwhile, cells are growing, and larger cells (we assume) synthesize Cdc13 at a faster rate, so the nuclear concentration of Cdc13/Cdc2 increases. When MPF activity in the nucleus reaches a threshold value, it inactivates Wee1 (and Mik1) and activates Cdc25. As a result, preMPF is converted autocatalytically to active MPF, and the cell enters mitosis. Sister chromatids are rapidly aligned on the mitotic spindle, and then MPF activates Slp1/APC, which releases PP from its inactive complex with inhibitor. PP then activates Wee1, Mik1, Ste9, and Rum1, bringing the cell back into G1 phase. Observe that, before mitotic exit, there is a considerable peak in the tyrosine-phosphorylated form of Cdc13/Cdc2 (Fig. 2) because Wee1 and Mik1 get activated slightly earlier than Ste9/APC.
Figure 2.

Numerical simulation of WT cell cycles.
Table 2.
Simulated cell-cycle properties of mutant fission yeast strains
| Strain | Parameter changes* | Mass at birth (relative) | G1† (min) | S† (min) | G2† (min) | M† (min) | Comment |
|---|---|---|---|---|---|---|---|
| WT | — | 1.00 | 38 | 17 | 78 | 17 | |
| wee1ts | VWee = 0.08 | 0.48 | 72 | 18 | 31 | 29 | |
| wee1Δ | VWee = V′Wee = 0 | 0.48 | 73 | 18 | 29 | 30 | |
| mik1Δ | VMik1 = V′Mik = 0 | 0.98 | 39 | 18 | 73 | 20 | |
| mik1Δwee1ts | VMik1 = V′Mik = 0, VWee = 0.08 | No balanced growth, S and M overlap | cut phenotype | ||||
| pyp3Δ | VPyp = 0 | 1.08 | 36 | 18 | 79 | 17 | |
| cdc25ts or cdc25Δ | V25 = 0.05, V′25 = 0.00025 or V25 = V′25 = 0 | — | — | — | ∞ | — | G2 block |
| wee1tscdc25Δ‡ | VWee = 0.08, V25 = V′25 = 0 | 1.22/1.08 | 22/23 | 17/17 | 42/107 | 31/23 | Quantized cycles |
| wee1tscdc25Δpyp3Δ | VWee = 0.08, V25 = V′25 = 0, VPyp = 0 | — | — | — | ∞ | — | G2 block |
| mik1Δwee1tscdc25Δ | VMik1 = V′Mik = 0, VWee = 0.08, V25 = V′25 = 0 | No balanced growth, S and M overlap | cut phenotype | ||||
| wee1tscdc25ts | VWee = 0.08, V25 = 0.05, V′25 = 0.00025 | 0.80 | 37 | 17 | 69 | 27 | |
| wee1Δcdc25Δ | VWee = V′Wee = 0, V25 = V′25 = 0 | 0.76 | 40 | 18 | 65 | 27 | |
| rum1Δ | k5 = 0 | 0.99 | 31 | 17 | 84 | 18 | |
| rum1Δwee1ts | k5 = 0, VWee = 0.08 | 0.41 | 24 | 18 | 77 | 31 | Not viable§ |
| ste9Δ or cdc13dbΔ | V2 = V2c = 0 | 0.84 | 12 | 18 | 102 | 18 | |
| ste9Δwee1ts | V2 = V2c = 0, VWee = 0.08 | 0.30 | 1 | 18 | 98 | 33 | Not viable§ |
| ste9Δrum1Δ | V2 = V2c = 0, k5 = 0 | 0.82 | 12 | 18 | 102 | 18 | |
| ste9Δrum1Δwee1ts | V2 = V2c = 0, k5 = 0, VWee = 0.08 | 0.28 | 0 | 19 | 98 | 33 | Not viable§ |
Parameter changes relative to the WT set (Table 1) are indicated.
The duration of the appropriate cell cycle phase is given. M phase is initiated when MPF crosses 0.5 from below and it finishes 5 min after MPFa/PP drops below 0.5. The rules for the onset and completion of S phase are described in Table 1.
As a consequence of the quantized cycles, these cells do not behave uniformly. Mean values of cells having the short cycle and the longer cycle, respectively, are separated by/. In the long cycle, during the 107-min G2 phase, there is a short period with high MPF, probably indicating an early M-like state (see text).
Cells significantly smaller than a wee1− mutant are considered too small to be viable.
With the parameter set in Table 1, we could easily simulate different cell cycle mutants (temperature-sensitive and loss-of-function) by reducing or zeroing the appropriate parameter values. Table 2 summarizes some properties of these simulations. Because many of these mutants have been described by our earlier model (4), they are not discussed further here.
Because tyrosine phosphorylation plays a role in inactivation of Cdc13/Cdc2 at the end of mitosis, wee1− mutants spend more time in the high Cdc13/Cdc2 activity state (mitosis), compared with WT cells (see all of the mutants with wee1− background in Table 2). This is consistent with experiments showing that wee1− mutants spend more time between mitosis and cytokinesis (26). Our model also correctly describes the phenotypes of mik1Δ, cdc25−, and pyp3Δ single and mik1Δ wee1ts double mutants (Table 2).
The rum1Δ mutant of fission yeast grows normally; however, a rum1Δ wee1ts double mutant, after a shift-up to the restrictive temperature, becomes progressively smaller and dies (Table 2) (27). Deletion of ste9 has a similar effect: viable in wee1+ and lethal in wee1− backgrounds (15, 16). In our simulations, Rum1 cannot accumulate during the short G1 phase in ste9Δ mutants, and consequently ste9Δ wee1ts double mutant cells die similarly to the rum1Δ wee1ts mutant.
Recent observations show that fission yeast survives in the absence of both Rum1 and Ste9 (16), in contrast to the lethality of the homologous budding yeast mutant (cdh1− sic1−) (28). This difference in viability can be attributed to a species-specific difference either in cyclin degradation (Slp1 may be more effective in degrading Cdc13 in fission yeast than is Cdc20 in degrading mitotic cyclins in budding yeast), or in inhibitory tyrosine phosphorylation of Cdk1 (fission yeast activates tyrosine kinases during its normal mitotic cycle, whereas budding yeast does not). We prefer the latter hypothesis, and our simulations of ste9Δ rum1Δ (Fig. 3) show that these cells could indeed down-regulate Cdc13/Cdc2 kinase at the end of mitosis by tyrosine phosphorylation. They are indistinguishable from ste9Δ simple mutants (Table 2), in which Rum1 does not make a comeback at the end of mitosis. Of course, crossing this strain with wee1ts creates a small, nonviable cell at the restrictive temperature (Table 2). Our present model predicts that fission yeast with a single copy of nondegradable cdc13 [cdc13dbΔ mutant (29)] exits mitosis and retains viability (Table 2), similarly to ste9Δ, as confirmed by preliminary experiments (J. M. de Prada, M. Blanco and S. Moreno, personal communication).
Figure 3.

Numerical simulation of ste9Δ rum1Δ double mutant cells.
Fission yeast tolerates even the total absence of Cdc25, if Wee1 activity is also much reduced (30). At 35°C, the division length of wee1ts cdc25Δ double mutant cells is significantly larger, on average, than WT and much more variable (31). Recently, we have shown that quantized cell cycles [with mean cycle times (CT) of 90, 160, and 230 min] underlie this size variability (12), and we proposed that improper regulation of tyrosine phosphorylation could explain this phenomenon (32).
Indeed, our present simulations confirm this proposal: wee1ts cdc25Δ cells cannot adjust their CT to the mass doubling time (Td = 150 min), but instead show shorter (112 min) and longer (170 min) cell cycles in varying occurrence (Fig. 4). Activation of Cdc13/Cdc2 is slow because these mutant cells lack positive feedback in tyrosine modification. However, the negative feedback loop (MPF → Slp1/APC → PP → Mik1, Ste9 and Rum1) is largely intact. In the absence of positive feedback, cell mass has a dramatic effect (through the rate of Cdc13 synthesis) on MPF activation. In small cells, Cdc13 kinase starts to rise, but its activation is slow and Mik1 kinase is turned on prematurely, before Ste9 and Rum1 can be turned on to reset the cell into G1 (we propose that Mik1 is a better substrate of PP, than either Ste9 or Rum1). Inhibitory tyrosine phosphorylation (by Mik1 and residual Wee1 activities) causes a drop in Cdc13/Cdc2 kinase activity and resets the cell into G2 phase rather than to G1 (the sister chromatids are not separated), from whence it must start new preparations for mitosis. Because the cell did not divide, it is larger in the subsequent G2 phase; activation of Cdc13/Cdc2 is faster now and MPF turns on Rum1 and Ste9 as well as Mik1, thus resetting the cell to G1 phase. Possibly the transient activation of Cdc13/Cdc2 halfway through the long cycle initiates some early events of mitosis, because cell elongation slows down in such cells (32), which normally indicates that the cell has entered mitosis (33). It is also noteworthy that periodic chromosome condensation and decondensation was recently observed in an Aspergillus nidulans mutant, corresponding to reversible mitotic entry and exit (34).
Figure 4.

Numerical simulation of wee1ts cdc25Δ double mutant cells.
If relative cell mass at birth is larger than about 1.16 (mass at birth is 1.0 for WT cells), then the first activation of MPF will drive the cell through proper mitosis and reset its progeny to G1 phase. Because the cell has a short CT, less than the mass doubling time, its progeny will be smaller at birth than their mother was at birth. If the daughter cells are born smaller than 1.16, they will start a long cell cycle and give rise to large granddaughters. Hence, both birth size and CT will be highly variable in cultures of wee1ts cdc25Δ cells.
It is worth noting that cycle-time quantization only occurs in the total absence of Cdc25 (V25′ = V25 = 0); wee1ts cdc25ts double mutant cells show a semi-wee phenotype with a 150-min generation time (Table 2), in accordance with experiments (35, 36). There is no experimental data on the behavior of wee1Δ cdc25Δ cells, but the model predicts them to have a semi-wee phenotype (Table 2), suggesting that residual Wee1 activity in wee1− cdc25Δ is required for cycle-time quantization.
In this deterministic model, the CT of individual wee1ts cdc25Δ cells is absolutely determined by cell mass at birth: large cells (relative mass > 1.16) show short cycles, whereas small cells (mass < 1.16) show long cycles. In experiments, no such size threshold is observed: cells of the same mass may have short or long cycles (although very large cells have always the shortest CT) (12). Also, with the parameter values used to simulate Fig. 4, there are no cycles with two resettings to G2 phase, which would account for the 230-min cycles observed experimentally. However, we have found that these quantized cycles are very sensitive to low, constant activity of Pyp3. Slightly smaller VPyp values often result in very long cycles (CT > 220 min) with two resettings to G2 phase. For these reasons, we have introduced some stochastic “noise” into our simulations, to give a better account of quantized cycles. It is worth mentioning that wee1ts cdc25Δ cells become nonviable if either pyp3 or mik1 are deleted (21); our simulations are consistent with the phenotypes of the appropriate triple mutants.
A Stochastic Model
Probably the activities of all proteins involved in our model, as well as the rate constants of the biochemical reactions, are stochastic variables, but it is unnecessary to take all possible stochastic variability into account. Because Pyp3 plays an important role in regulating these quantized cycles, we treat its rate parameter (VPyp) alone as a stochastic variable. From cycle to cycle, we assign to VPyp a random number chosen from a normal distribution with mean 0.07 min-1 and standard deviation 0.02 min-1.
With this stochastic model, we simulated more than 300 cells and plotted CT as a function of birth mass (Fig. 5). To make this figure directly comparable with experimental data in figure 6A from ref. 12, we have assumed that 1 unit of mass corresponds to 8.2-μm cell length. Our model simulates the experimental data very well. In particular, birth length (BL) no longer determines to which group a cell belongs, except for very large cells (BL > 13 μm), which have the minimum CT because they never reset to G2, as observed (12, 32). Our simulations predict a small population of cells with CT > 300 min (three resettings to G2). Such cells have not been observed, perhaps because the durations of the films were not long enough to find them.
Figure 5.

CT vs. BL relationship for simulated wee1ts cdc25Δ cells. This graph should be compared with the experimental data in figure 6A from ref. 12.
Robustness of the Model
Division size of fission yeast depends sensitively on the gene dosages of wee1 and cdc25 (18, 30). Fission yeast tolerates reduced and excess levels of these regulators over wide ranges. To test whether our model is consistent with such robust behavior, we varied the parameters representing turnover numbers of Wee1 and Cdc25 over wide ranges (with all other parameters set to the values in Table 1). Fig. 6 exhibits curves of constant BL on the plane of variable Wee1 and Cdc25 activities. These iso-BL curves run more or less diagonally, with decreasing mass values from left to the right. As a consequence, moving to the right (by increasing Cdc25 activity) or moving down (by reducing Wee1 activity) results in a decrease in BL, as observed (18, 30). Cells show balanced growth and division over wide ranges of Wee1 and Cdc25 activities, demonstrating the robustness of the model. In this broad region of parameter space, CT is always the same as mass-doubling time; only cell masses at birth and division are changing as functions of Wee1 and Cdc25 activities. We have divided the area of balanced growth and division somewhat arbitrarily into two regions: cells smaller than 60% of WT are considered wee, whereas cells in the range 0.6 < BL < 3 are more or less normal.
Figure 6.

Effects of Wee1 and Cdc25 activities on BL and phenotype of fission yeast. Curves represent cells of constant BL (BL = 1.0 for WT cells). The shaded regions represent different phenotypes. Both enzyme activities are expressed as percentage of WT. For Wee1 (ordinate), we varied only the large turnover number (VWee), leaving the small one (Vwee′ ) unchanged. For Cdc25, we varied both (V25′ and V25), keeping their ratio the same as in WT.
Outside the area of balanced growth and division, in the upper left corner of Fig. 6 (BL > 3), cell mass at division increases abruptly, and these cells can be treated as cdc. In the lower right corner, cells show mitotic catastrophe because they activate MPF prematurely and divide before they can finish S phase. This is fully consistent with the cut phenotype found in wee1− cdc25op mutants (30). By contrast, cells in the lower left corner (with low Wee1 and Cdc25 activities) have more than one CT (quantized cycles). Because the area in parameter space of quantized cycles is extensive, the phenomenon is a robust characteristic of our model.
Discussion
The idea of quantized cycles has a long history in cell cycle research (37, 38), but has not been widely accepted for two major reasons: the experimental evidence was not convincing, and the clock driving these quantized cycles was obscure. We think that the situation has changed on both fronts. First, clear evidence for quantized cycles has been observed in wee1− cdc25Δ fission yeast cells (12) and in Xenopus oocytes (39). Second, in this paper we propose that quantized cycles in wee1− cdc25Δ fission yeast cells are simply a consequence of free-running oscillations of an underlying cell cycle engine rather than manifestations of an independent ultradian clock as proposed by Kippert and Hunt (40). Our model is similar to the idea proposed by Shymko et al. (37).
The cell division cycle clearly has an underlying molecular clock that drives major cell cycle events, like DNA replication and mitosis. However the free-running clock is only apparent in cells with an abnormally high protein-to-DNA ratio; for example, early embryos or cdcts yeast cells that have been held temporarily at the restrictive temperature. By contrast, in normal vegetative or somatic cells, the operation of the cell cycle clock is controlled by surveillance mechanisms (checking the replication state of DNA and cell size) that stop the clock at specific cell cycle checkpoints. These checkpoints are stable steady states of the regulatory system. A checkpoint is lifted, and the cell progresses to the next stage of the cycle, only if certain conditions are satisfied. These stable checkpoints are consequences of antagonistic relationships between cell cycle regulators. For example, in WT fission yeast, the positive feedback loops in Cdc2 Tyr-15 phosphorylation create two stable states with low and high Cdk activity, corresponding to interphase and mitosis. As a consequence of positive feedback, the transitions between these two states are all-or-none. The mitotic state is destabilized at the end of mitosis by a slow negative feedback loop, which up-regulates the enemies of MPF. If the positive feedback loops are weak, as in the wee1− cdc25Δ mutant, then the mitotic control network starts to oscillate, as a consequence of an underlying clock mechanism based on the negative feedback loop (41). Although spontaneous oscillations in the cell cycle engine are reminiscent of early embryos, these double mutant cells do not always divide at the period of the limit cycle oscillator, because cell mass exerts a gating effect. If cell mass is too small, then mitosis cannot be completed the first time it is initiated. Instead, the cell reverts to G2, grows larger, and tries again. As a consequence, age at division is clearly quantized in these double mutant cells.
Acknowledgments
We dedicate this paper to Prof. Murdoch Mitchison, who introduced us to cell cycle research. We thank Dr. Sergio Moreno for helpful discussions and communicating unpublished results. Our research was supported by the Howard Hughes Medical Institute (75195-542501), the Hungarian Scientific Research Fund (OTKA F-022176 and T-032015), and the National Science Foundation (DBI-9724085). A.S. is grateful to the Hungarian Higher Education and Research Foundation for a Zoltan Magyary Postdoctoral Fellowship.
Abbreviations
- CDK
cyclin-dependent protein kinase
- MPF
M-phase promoting factor
- APC
anaphase-promoting complex
- PP
protein phosphatase
- WT
wild type
- preMPF
Tyr-15-phosphorylated MPF
- CT
cycle time
- BL
birth length
- SK
starter kinase
Footnotes
This paper was submitted directly (Track II) to the PNAS office.
References
- 1.Nurse P. Cell. 1994;79:547–550. doi: 10.1016/0092-8674(94)90539-8. [DOI] [PubMed] [Google Scholar]
- 2.Fisher D L, Nurse P. EMBO J. 1996;15:850–860. [PMC free article] [PubMed] [Google Scholar]
- 3.Stern B, Nurse P. Trends Genet. 1996;12:345–350. [PubMed] [Google Scholar]
- 4.Novak B, Csikasz-Nagy A, Gyorffy B, Chen K, Tyson J J. Biophys Chem. 1998;72:185–200. doi: 10.1016/s0301-4622(98)00133-1. [DOI] [PubMed] [Google Scholar]
- 5.Correa-Bordes J, Nurse P. Cell. 1995;83:1001–1009. doi: 10.1016/0092-8674(95)90215-5. [DOI] [PubMed] [Google Scholar]
- 6.Benito J, Martin-Castellanos C, Moreno S. EMBO J. 1998;17:482–497. doi: 10.1093/emboj/17.2.482. [DOI] [PMC free article] [PubMed] [Google Scholar]
- 7.Tourret J, McKeon F. Prog Cell Cycle Res. 1996;2:91–97. doi: 10.1007/978-1-4615-5873-6_9. [DOI] [PubMed] [Google Scholar]
- 8.Aligue R, Wu L, Russell P. J Biol Chem. 1997;272:13320–13325. doi: 10.1074/jbc.272.20.13320. [DOI] [PubMed] [Google Scholar]
- 9.Kovelman R, Russell P. Mol Cell Biol. 1996;16:86–93. doi: 10.1128/mcb.16.1.86. [DOI] [PMC free article] [PubMed] [Google Scholar]
- 10.Visintin R, Craig K, Hwang E S, Prinz S, Tyers M, Amon A. Mol Cell. 1998;2:709–718. doi: 10.1016/s1097-2765(00)80286-5. [DOI] [PubMed] [Google Scholar]
- 11.Jaspersen S, Charles J, Morgan D. Curr Biol. 1999;9:227–236. doi: 10.1016/s0960-9822(99)80111-0. [DOI] [PubMed] [Google Scholar]
- 12.Sveiczer A, Novak B, Mitchison J M. J Cell Sci. 1996;109:2947–2957. doi: 10.1242/jcs.109.12.2947. [DOI] [PubMed] [Google Scholar]
- 13.Novak B, Csikasz-Nagy A, Gyorffy B, Nasmyth K, Tyson J J. Philos Trans R Soc London B. 1998;353:2063–2076. doi: 10.1098/rstb.1998.0352. [DOI] [PMC free article] [PubMed] [Google Scholar]
- 14.Novak B, Toth A, Csikasz-Nagy A, Gyorffy B, Tyson J J, Nasmyth K. J Theor Biol. 1999;199:223–233. doi: 10.1006/jtbi.1999.0956. [DOI] [PubMed] [Google Scholar]
- 15.Yamaguchi S, Murakami H, Okayama H. Mol Biol Cell. 1997;8:2475–2486. doi: 10.1091/mbc.8.12.2475. [DOI] [PMC free article] [PubMed] [Google Scholar]
- 16.Kitamura K, Maekawa H, Shimoda C. Mol Biol Cell. 1998;9:1065–1080. doi: 10.1091/mbc.9.5.1065. [DOI] [PMC free article] [PubMed] [Google Scholar]
- 17.Labib K, Moreno S. Trends Cell Biol. 1996;6:62–66. doi: 10.1016/0962-8924(96)81016-6. [DOI] [PubMed] [Google Scholar]
- 18.Russell P, Nurse P. Cell. 1987;49:559–567. doi: 10.1016/0092-8674(87)90458-2. [DOI] [PubMed] [Google Scholar]
- 19.Lundgren K, Walworth N, Booher R, Dembski M, Kirschner M, Beach D. Cell. 1991;64:1111–1122. doi: 10.1016/0092-8674(91)90266-2. [DOI] [PubMed] [Google Scholar]
- 20.Murray A, Hunt T. The Cell Cycle: An Introduction. New York: Freeman; 1993. [Google Scholar]
- 21.Millar J B A, Lanaers G, Russell P. EMBO J. 1992;11:4933–4941. doi: 10.1002/j.1460-2075.1992.tb05600.x. [DOI] [PMC free article] [PubMed] [Google Scholar]
- 22.Fisher D, Nurse P. Semin Cell Biol. 1995;6:73–78. doi: 10.1016/1043-4682(95)90003-9. [DOI] [PubMed] [Google Scholar]
- 23.Martin-Castellanos C, Labib K, Moreno S. EMBO J. 1996;15:839–849. [PMC free article] [PubMed] [Google Scholar]
- 24.Matsumoto T. Mol Cell Biol. 1997;17:742–750. doi: 10.1128/mcb.17.2.742. [DOI] [PMC free article] [PubMed] [Google Scholar]
- 25.Goldbeter A, Koshland D E., Jr Proc Natl Acad Sci USA. 1981;78:6840–6844. doi: 10.1073/pnas.78.11.6840. [DOI] [PMC free article] [PubMed] [Google Scholar]
- 26.Creanor J, Mitchison J M. J Cell Sci. 1994;107:1197–1204. doi: 10.1242/jcs.107.5.1197. [DOI] [PubMed] [Google Scholar]
- 27.Moreno S, Nurse P. Nature (London) 1994;367:236–242. doi: 10.1038/367236a0. [DOI] [PubMed] [Google Scholar]
- 28.Schwab M, Lutum A S, Seufert W. Cell. 1997;90:683–693. doi: 10.1016/s0092-8674(00)80529-2. [DOI] [PubMed] [Google Scholar]
- 29.Yamano H, Gannon J, Hunt T. EMBO J. 1996;15:5268–5279. [PMC free article] [PubMed] [Google Scholar]
- 30.Russell P, Nurse P. Cell. 1986;45:145–153. doi: 10.1016/0092-8674(86)90546-5. [DOI] [PubMed] [Google Scholar]
- 31.Enoch T, Gould K L, Nurse P. Cold Spring Harbor Symp Quant Biol. 1991;56:409–416. doi: 10.1101/sqb.1991.056.01.048. [DOI] [PubMed] [Google Scholar]
- 32.Sveiczer A, Novak B, Mitchison J M. J Cell Sci. 1999;112:1085–1092. doi: 10.1242/jcs.112.7.1085. [DOI] [PubMed] [Google Scholar]
- 33.Mitchison J M, Nurse P. J Cell Sci. 1985;75:357–376. doi: 10.1242/jcs.75.1.357. [DOI] [PubMed] [Google Scholar]
- 34.Ye X S, Fincher R R, Tang A, Osmani A H, Osmani S A. Mol Biol Cell. 1998;9:3019–3030. doi: 10.1091/mbc.9.11.3019. [DOI] [PMC free article] [PubMed] [Google Scholar]
- 35.Fantes P. Nature (London) 1979;279:428–430. doi: 10.1038/279428a0. [DOI] [PubMed] [Google Scholar]
- 36.Grallert A, Grallert B, Ribar B, Sipiczki M. J Bacteriol. 1998;180:892–900. doi: 10.1128/jb.180.4.892-900.1998. [DOI] [PMC free article] [PubMed] [Google Scholar]
- 37.Shymko R M, Klevecz R R, Kaufmann S A. In: Cell Cycle Clocks. Edmunds L N Jr, editor. New York: Dekker; 1984. pp. 273–293. [Google Scholar]
- 38.Lloyd D, Poole R K, Edwards S W. The Cell Division Cycle: Temporal Organization and Control of Cellular Growth and Reproduction. London: Academic; 1982. [Google Scholar]
- 39.Masui Y, Wang P. Biol Cell. 1998;90:537–548. [PubMed] [Google Scholar]
- 40.Kippert F, Hunt P. BioEssays. 2000;22:16–22. doi: 10.1002/(SICI)1521-1878(200001)22:1<16::AID-BIES5>3.0.CO;2-1. [DOI] [PubMed] [Google Scholar]
- 41.Goldbeter A. Proc Natl Acad Sci USA. 1991;88:9107–9111. doi: 10.1073/pnas.88.20.9107. [DOI] [PMC free article] [PubMed] [Google Scholar]