

Abstract
An open question of great interest in biophysics is whether variations in structure cause protein folds to differ in the number of amino acid sequences that can fold to them stably, i.e., in their designability. Recently, we have shown that a novel quantitative measure of a fold's tertiary topology, called its contact trace, strongly correlates with the fold's designability. Here, we investigate the relationship between a fold's contact trace and its relative frequency of usage in mesophilic vs. thermophilic eubacteria. We observe that thermophilic organisms exhibit a bias toward using folds of higher contact trace when compared with mesophiles. We establish this difference both for the distributions of folds at the whole-proteome level and also through more focused structural comparisons of orthologous proteins. Our findings suggest that thermophilic adaptation in bacterial genomes occurs in part through natural selection of more designable folds, pointing to designability as a key component of protein fitness.
Understanding the adaptations that enable thermophilic organisms to survive at extreme temperatures is a challenge that has interested researchers since 1897 (1), and great strides have been made along this line of inquiry since the recent publications of complete genomes for several hyperthermophilic species (2). However, most research in this area has focused on amino acid sequence variations that increase the thermodynamic stability of thermophilic proteins while leaving their structures unchanged (2, 3). Far less is known about what structural differences exist between thermophilic and mesophilic proteomes. One interesting possibility is that a thermophilic bias in structure may manifest as a preference for folds that are able to accommodate a large number of low-energy sequences, because such folds have a higher probability of being able to maintain their stability while adapting by mutation to new pressures. This hypothesis relates to another problem of great interest in biophysics: how the structural topology of a protein fold affects its designability (4–9). Here, we present results that point to an important connection between these two problems. Making use of what is known analytically about the relationship between a fold's topology and its designability and thermostability, we report an adaptation mechanism of thermophillic bacteria: one that proceeds by selection of more designable folds.
Recently, a new theoretical treatment of designability has been developed within the framework of a residue–residue contact Hamiltonian (10). This Hamiltonian is a well established model for protein energetics that defines the conformational energy of a polypeptide chain as the sum of the pairwise interaction energies of all of the amino acid pairs whose α carbons are separated by a distance less than some contact cutoff, typically chosen to be ≈7.5 Å (11). More formally, for a chain of length N with a monomer alphabet containing M amino acid types (of course, M = 20 for real proteins), we can define the energy matrix element Bkl as the energy of interaction between the kth and lth amino acid types and the contact matrix element Cij to be 1 if monomers i and j are in contact, and 0 otherwise. The amino acid sequence for a chain of structural topology C can now be represented by a set of N positive-lattice unit-M-vector {s(1), s(N)}, and the energy of this sequence–structure combination is given by
 |
[1] |
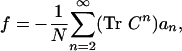
The spectrum of energies of all possible sequences of a protein folded into a given structure is therefore a direct function of the structural topology encoded by its contact matrix. The designability problem for this Hamiltonian was first studied by Wolynes (7), who showed, using a Gaussian approximation to evaluate the partition function in sequence space (12), that designability should correlate directly with the number of contacts per monomer. A similar result was obtained by Shakhnovich using microcanonical ensemble formalism (8). Using both analytical theory and simulations of cubic-lattice polymers, England and Shakhnovich (10) have extended these results by showing that for a large class of potentials B, the free energy per monomer f for the sequence space of a structural topology C is given by
 |
[2] |
where the weights ai are all positive functions that depend on the interaction energies B (the results of refs. 7 and 8 can be recovered by truncating this series at lowest order). This free energy is most negative when the greatest number of sequences lie at low energies. Let us now define the contact trace of a fold at nth-order to be (Tr Cn)/N. In terms of this new terminology, it is clear that by maximizing contact trace, we minimize the sequence space free energy of the structural topology C by pushing a greater number of sequences to lower energies. In other words, contact trace is a strong positive predictor of the number of low-energy sequences a fold can accommodate. These low-energy sequences are in turn more likely to be able to adopt the fold as their ground-state conformation with a large energy gap between their native state conformation and those structurally dissimilar misfolded conformations of lowest energy. Thus, folds of higher contact trace have a greater capacity to accommodate native sequences of exceptionally high thermostability (10). We summarize this by saying that these folds are the most designable ones at high temperatures.
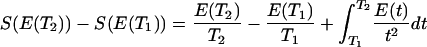
This relationship has been confirmed using a Monte Carlo algorithm to search the 20-monomer sequence spaces of cubic-lattice 27 mers (Fig. 1) (10). A randomly selected starting sequence was randomly subjected to two- and three-monomer permutations that were accepted or rejected according to a Metropolis criterion with respect to energy in the target (native) conformation at a fictitious temperature T (12, 13). The design temperature dependence of the average energy E(T) during the simulation for a given structure was used to calculate the entropy in sequence space (the number of sequences at a given energy in the structure) via
 |
[3] |
(ref. 8). As Fig. 1a shows, when energy decreases, the gap in sequence entropy between high and low trace conformations widens. Thus, higher trace structures have a greater ability to accommodate low-energy sequences, a requirement for thermo-stable proteins (13). Although the result in Eq. 2 was first derived for a restricted class of potentials, the Monte Carlo simulations described above were performed using a potential B, which represented essentially random interactions, indicating that the dependence of designability on contact trace is a far more general phenomenon than its original analytical foundations might suggest. Interestingly, these same high trace structures also exhibit a greater amount of structural regularity and symmetry than do the low trace ones (14) (Fig. 1b). This stems from the fact that the nth order contact trace of a structure is related to the number of n-step closed loops that can be drawn along the contact system, and more regular and symmetrical structures can support greater numbers of such contact loops.
Fig. 1.

(a) Sequence space entropy as a function of energy, measured in difference from its maximum value, for one structure of high contact trace (diamonds) and one of low (circles). The higher trace structure clearly admits a greater number of low-energy sequences (gray shaded region), which in turn leads to a larger number of sequences (obtained by a Monte Carlo design procedure) having the structure as their ground state and to a larger fraction of those sequences having substantial gaps between their ground state and first excited, structurally dissimilar state energies (Inset). Such structures can therefore accommodate a much larger number of foldable, highly thermo-stable sequences. (b) Representative cubic lattice structures of high (Left) and low (Right) contact trace. The higher trace conformations exhibit a marked tendency toward greater structural regularity and symmetry.
The dependence of a structure's sequence spectrum on its contact trace is a phenomenon that may have measurable biological consequences. Thermophilic organisms living at extremely high temperatures must constantly meet an extraordinary demand for thermally stable biomachinery (15, 16) as compared with their mesophilic counterparts who live at more moderate temperatures. We speculated that the force of natural selection may have biased the structural proteomes of thermophilic organisms toward selecting folds of higher contact trace, because these structures are more designable and thus more mutationally plastic and adaptable in a high-temperature environment. We therefore sought to test this hypothesized link between designability and selective fitness by seeing whether the distribution of contact traces in thermophilic structural proteomes was shifted toward higher trace relative to the same distribution for mesophiles.
We began by comparing the utilization of structures in proteomes of thermophilic eubacteria (17–19) living at high temperatures (≈373 K) to those of mesophilic eubacteria (20–22) living at moderate temperatures (≈310 K). Previously, studies investigating the cause of thermostability (23) in proteins from thermophilic eubacteria have either focused in detail on the variation of relatively small families of folds from thermophile to mesophile (24, 25) or else have directed their attention principally toward particular sequence-based means for thermal stabilization (26, 27), such as salt-bridge formation (28, 29) or disulfide bridges (15). In contrast to previous studies, here we focus on comparative analysis of patterns of fold usage across whole thermophilic and mesophilic proteomes by calculating the normalized contact trace distributions for sets of fully sequenced thermophilic and mesophilic genomes. The genomes from which the data were derived were selected at random with the requirements that they be fully sequenced and classified as belonging to the eubacteria kingdom. The thermophilic genomes we used were those of Thermotoga maritima, Thermoanaerobacter tengcongensis, and Aquifex aeolicus. The first mesophilic set (see Fig. 2) consisted of Escherichia coli, Bacillus subtilis, Haemophilus influenzae, Mycobacterium leprae, Mycoplasma pneumoniae, and Listeria monocytogenes, whereas the second (control) mesophilic set consisted of Chlamydia trachomatis, Helicobacter pylori, Rickettsia conorii, Borelia burgdorferi, Clostridium perfringens, and Vibrio cholerae.
Fig. 2.

(a) The normalized distributions of contact density for thermophilic and mesophilic structural proteomes. The thermophilic distribution (red squares) differs from the mesophilic one (blue upward triangles) much more than does the distribution for a control set of mesophiles (blue downward triangles). A Kolmogorov–Smirnov test applied to these curves assigns a P value of 0.00027 to the null hypothesis that the thermophilic and mesophilic curves were generated from the same underlying distribution, whereas the same calculation for the two mesophilic curves leads to a P value of 0.074. (b) The arithmetic difference of the thermophilic (violet circles) and mesophilic (orange leftward triangles) curves with the control mesophilic curve in a.
Designability was measured as the second-order length-scaled contact trace for each domain in the DALI database (14). At this leading order, the contact trace reduces to the contact density (CD), which is the average number of contacts per monomer first suggested in (7) as the main determinant of designability. Although it was also of great interest to study the subtler effects on selective fitness that may derive from the higher-order contact traces, the data set offered prohibitively few folds of equal contact density with differing higher-order topologies for comparison. Calculations of CD were done for each DALI domain by parsing the DALI Protein Data Bank file and calculating a contact matrix based on a 7.5-Å cutoff for α carbons; CD is the trace of the square of the contact matrix, divided by the number of residues in the domain.
The presence or absence of a given protein domain in a given genome was determined through a two-way stringent blast test (E value = 1e-10) like that used for populating the COG (30) database. The test was done on HSSP (14) families that have been aligned to 3D structures of protein domains. The result was further double-checked through COG and Swiss-Prot (31) identification numbers for annotations in fully sequenced genomes. In calculating the CD distributions, each domain was counted a number of times equal to the number of proteomes in which it appeared. One thousand eighty-two domains were counted in thermophilic genomes, 4,291 domains in the first mesophilic set and 3,213 domains for the second (control) mesophilic set.
As predicted, the distribution of contact densities across thermophilic proteomes was shifted toward higher densities (Fig. 2) relative to that of mesophilic proteomes. The difference in average contact density for the two distributions is small (≈2%) but highly significant: a Student's t test assigns a P value of 6.6e-08 to the null hypothesis that the thermophilic and mesophilic sets were drawn from underlying distributions with the same mean value, whereas the same comparison between two disjoint mesophilic data sets gives a P value of 0.47. Furthermore, given that the temperatures at which hyperthermophilic and mesophilic species grow differ by only 15–20% in absolute magnitude, the observed thermodynamic separation of the two types of proteomes is even more remarkable. The shapes of the distributions provide additional evidence in favor of significance. Rather than weaving back and forth across the mesophilic curve, the thermophilic curve remains consistently lesser or equal in value in the lower half of the distribution and consistently greater or equal in value throughout the upper half (Fig. 2b). This behavior results from the fact that those mesophilic domains that do not appear in any thermophilic proteomes are distributed about a relatively low average contact density (Fig. 2a, green curve). Thus, thermophiles appear to avoid making use of many folds with lower contact densities that are used in mesophiles.
We next tested to make sure this effect was not merely the result of any intergenomic variations in assortment of biochemical function. We therefore made the same comparisons of CD distributions within restricted sets of highly conserved metabolic networks (Fig. 3), where metabolic network activity was determined from the KEGG database (32). Strikingly, even within small classes of ubiquitous macromolecules of very similar function, mesophiles and thermophiles could be distinguished by their utilization of proteins with differing contact densities, suggesting that the variation between the two types of genomes is not fully explained by any differences in their respective patterns of biological function. Because there is a difference in contact densities even for functional analogs, we believe that the observed separation between mesophilic and thermophilic proteomes results from the thermophilic natural selection of protein folds that are more designable.
Fig. 3.

(a–c) Normalized CD distributions for domains used by three of the largest metabolic networks in bacteria. As in the genomewide comparison, the thermophilic (red squares) curves are visibly shifted toward higher contact density relative to the mesophilic (blue triangles) curves. (d) The distribution of differences in average contact density between thermophilic and mesophilic realizations of the same metabolic network for all metabolic networks implicated in the use of 20 domains or more. All such differences are positive, suggesting that all metabolic networks studied here use more designable proteins in thermophilic organisms than in their mesophilic counterparts.
In addition to performing the large-scale structural analyses described above, we also investigated several specific cases of designability driven fold selection in thermophiles. In these case studies of orthologous proteins (33), total CD was calculated by taking a length-weighted average of the CDs of all domains in the protein. This was done because domains are more conserved than whole proteins. Orthologous proteins were determined from COG and exact conservation of functionality between organisms according to KEGG.
We found that thermophilic adaptations often proceed by deletions of domains with lower designability and utilization of orthologous proteins with higher designability. An example of this adaptation mechanism can be seen on the 5-methyltetrahydrofolate (MTH) protein (34), which catalyzes methyltetrahydrofolate into methionine and tetrahydrofolate (35). This protein is part of a larger network that is involved in methionine metabolism, a process integral to the survival of both thermophiles and mesophiles. MTH is a multidomain protein whose structure was in part solved by crystallization of several domains from the E. coli bacterium. E. coli and other mesophiles have two domains whose structures are known: the B12-binding domain (36) with CD equal to 4.8 and the AdoMet-binding/activation domain (37) (CD = 4.4). Orthologous genes from thermophiles (17) lack the less designable AdoMet-binding/activation domain altogether. Presumably, the lack of the transferase domain activity is compensated for by the methyltransferase protein (38) also involved in the same reaction (32). This particular adaptation seems to be partly due to either lateral gene transfer (39) or to convergent evolution (17), because it is present in both T. maritima and T. tengcongensis, the latter of which is regarded as a later-diverged thermophile most closely related to mesophilic Bacillus halodurans (17).
We consistently see thermophiles adapting to their environment by deleting less designable domains as outlined in the previous example, but we also observe thermophiles using completely different, more designable folds for the same function. For example, during metabolism of arginine and proline, the cell must convert ornithine to putrescine (40). Ornithine decarboxylase (ODX), the enzyme responsible for catalyzing this reaction, exists in two forms: one with CD = 4.69 (41) used by the earlier-diverged thermophiles Aquifex aeolicus and T. maritima and one with CD = 4.38 (42) used by the mesophillic eubacteria. Strikingly, T. tengcongensis adapts by removing this enzyme altogether. Presumably, it accounts for this loss in the same way as does Arabidopsis thaliana: by utilizing a promiscuous enzyme, ornithine carbomyltransferase (43) (CD = 4.81 (44), Z = 4.1 similarity to mesophilic ODX), to fill the role of ODX. Thus, the thermophilic organisms above adapt at least in part by optimizing designability of the protein fold responsible for ornithine decarboxylation.
It should be noted that it is an open question whether the trends in CD described above derive by happenstance from a correlated structural difference between thermophiles and mesophiles that exists for a reason unrelated to designability. As a case in point, a recent study has observed both that CD correlates positively with protein length, and also that evolutionarily conserved proteins are longer on average than nonconserved ones (45). Yet although solid reasons have been offered for believing that elevated CD confers greater selective fitness on a protein fold, the case for a thermophilic bias toward longer domains is tenuous at best. Furthermore, it has been argued (ref. 46; E. Koonin, private communication) that thermophilic proteins are usually shorter than their mesophilic counterparts, a trend giving rise to lower contact density acting in the opposite direction to the one observed here.
The proposed mechanism of adaptation proceeds by selection of repertoire of more designable folds for thermophilic proteomes. A complementary mechanism(s) is sequence and/or structure adjustment (within the same fold) in thermophilic domains compared with their mesophilic orthologues. An interesting example of such adjustment is presented in ref. 46, which shows that thermophilic proteins feature shorter exposed loops compared with their mesophilic counterparts. This observation was attributed to entropic stabilization of thermophilic proteins (46). Shorter loops can in principle lead to higher contact density. However, we note that this mechanism is additional and complementary to the one described here, because the domains used to represent the thermophilic proteomes in this study were not the thermophilic proteins themselves but the overwhelmingly predominant mesophilic DALI domains that matched them in a blast search and should therefore have exhibited no such loop bias.
We should also point out that we observed here a qualitative trend that points to designability as a factor in thermophilic adaptation. A quantitative description would require, first of all, a detailed evolution model that relates designability to fitness measure and includes evolutionary dynamics considerations. Although such studies were carried out for lattice model proteins (47) with interesting results, their extension to real proteomes remains to be made.
The known link between contact density and designability still remains the best explanation for the observed shift in fold utilization from thermophiles to mesophiles. This finding constitutes a rare instance in which a hypothesis derived from fundamental principles of statistical physics has been shown to bear profoundly on the process of natural selection at the molecular level. Furthermore, new understanding of fold designability allows us to document a method of adaptation used by thermophillic bacteria: the preferential selection of folds that are more mutationally plastic in a high-temperature environment. Although we have established that this adaptation can be achieved through both deletions of protein domains of lower designability and substitutions of whole proteins in favor of more designable solutions, the detailed adaptive mechanisms warrant further study, particularly at the level of the higher-order topological determinants of designability identified in ref. 10. Such an investigation will surely benefit from the rapidly rising number of solved protein structures from thermophilic organisms available in the Protein Data Bank.
Acknowledgments
We thank C. DeLisi, E. Koonin, N. Grishin, and A. Finkelstein for illuminating discussions, and the National Institutes of Health, the National Science Foundation, and Pfizer, Incorporated, for supporting this research.
This paper was submitted directly (Track II) to the PNAS office.
Abbreviation: CD, contact density.
References
- 1.Davis, B. M. (1897) Science 6, 145–157. [DOI] [PubMed] [Google Scholar]
- 2.McDonald, J. H. (2001) Mol. Biol. Evol. 18, 741–749. [DOI] [PubMed] [Google Scholar]
- 3.Chakravarty, S. & Varadarajan, R. (2002) Biochemistry 41, 8152–8161. [DOI] [PubMed] [Google Scholar]
- 4.Li, H., Helling, R., Tang, C. & Wingreen, N. (1996) Science 273, 666–669. [DOI] [PubMed] [Google Scholar]
- 5.Koehl, P. & Levitt, M. (2002) Proc. Natl. Acad. Sci. USA 99, 1280–1285. [DOI] [PMC free article] [PubMed] [Google Scholar]
- 6.Zou, J. & Saven, J. G. (2000) J. Mol. Biol. 296, 281–294. [DOI] [PubMed] [Google Scholar]
- 7.Wolynes, P. G. (1996) Proc. Natl. Acad. Sci. USA 93, 14249–14255. [DOI] [PMC free article] [PubMed] [Google Scholar]
- 8.Shakhnovich, E. I. (1998) Folding Des. 3, R45–R58. [PubMed] [Google Scholar]
- 9.Govindarajan, S. & Goldstein, R. A. (1996) Proc. Natl. Acad. Sci. USA 93, 3341–3345. [DOI] [PMC free article] [PubMed] [Google Scholar]
- 10.England, J. L. & Shakhnovich, E. I. (2003) Phys. Rev. Lett. 90, 218101-01. [DOI] [PubMed] [Google Scholar]
- 11.Miyazawa, S. & Jernigan, R. L. (1985) Macromolecules 18, 534–552. [Google Scholar]
- 12.Shakhnovich, E. I. & Gutin, A. M. (1993) Protein Eng. 6, 793–800. [DOI] [PubMed] [Google Scholar]
- 13.Shakhnovich, E. I. & Gutin, A. M. (1993) Proc. Natl. Acad. Sci. USA 90, 7195–7199. [DOI] [PMC free article] [PubMed] [Google Scholar]
- 14.Holm, L. & Sander, C. (1997) Nucleic Acids Res. 25, 231–234. [DOI] [PMC free article] [PubMed] [Google Scholar]
- 15.Dalhus, B., Saarinen, M., Sauer, U. H., Eklund, P., Johansson, K., Karlsson, A., Ramaswamy, S., Bjork, A., Synstad, B., Naterstad, K., et al. (2002) J. Mol. Biol. 318, 707–721. [DOI] [PubMed] [Google Scholar]
- 16.Bruck, I., Yuzhakov, A., Yurieva, O., Jeruzalmi, D., Skangalis, M., Kuriyan, J. & O'Donnell, M. (2002) J. Biol. Chem. 277, 17334–17348. [DOI] [PubMed] [Google Scholar]
- 17.Bao, Q., Tian, Y., Li, W., Xu, Z., Xuan, Z., Hu, S., Dong, W., Yang, J., Chen, Y., Xue, Y., et al. (2002) Genome Res. 12, 689–700. [DOI] [PMC free article] [PubMed] [Google Scholar]
- 18.Xue, Y., Xu, Y., Liu, Y., Ma, Y. & Zhou, P. (2001) Int. J. Syst. Evol. Microbiol. 51, 1335–1341. [DOI] [PubMed] [Google Scholar]
- 19.Deckert, G., Warren, P. V., Gaasterland, T., Young, W. G., Lenox, A. L., Graham, D. E., Overbeek, R., Snead, M. A., Keller, M., Aujay, M., et al. (1998) Nature 392, 353–358. [DOI] [PubMed] [Google Scholar]
- 20.Blattner, F. R., Plunkett, G., III, Bloch, C. A., Perna, N. T., Burland, V., Riley, M., Collado-Vides, J., Glasner, J. D., Rode, C. K., Mayhew, G. F., et al. (1997) Science 277, 1453–1474. [DOI] [PubMed] [Google Scholar]
- 21.Fleischmann, R. D., Adams, M. D., White, O., Clayton, R. A., Kirkness, E. F., Kerlavage, A. R., Bult, C. J., Tomb, J. F., Dougherty, B. A., Merrick, J. M., et al. (1995) Science 269, 496–512. [DOI] [PubMed] [Google Scholar]
- 22.Himmelreich, R., Hilbert, H., Plagens, H., Pirkl, E., Li, B. C. & Herrmann, R. (1996) Nucleic Acids Res. 24, 4420–4449. [DOI] [PMC free article] [PubMed] [Google Scholar]
- 23.Das, R. & Gerstein, M. (2000) Funct. Integr. Genomics 1, 76–88. [DOI] [PubMed] [Google Scholar]
- 24.Szilagyi, A. & Zavodszky, P. (2000) Struct. Folding Des. 8, 493–504. [DOI] [PubMed] [Google Scholar]
- 25.Gianese, G., Bossa, F. & Pascarella, S. (2002) Proteins 47, 236–249. [DOI] [PubMed] [Google Scholar]
- 26.Gromiha, M. M., Oobatake, M. & Sarai, A. (1999) Biophys. Chem. 82, 51–67. [DOI] [PubMed] [Google Scholar]
- 27.Kawamura, S., Abe, Y., Ueda, T., Masumoto, K., Imoto, T., Yamasaki, N. & Kimura, M. (1998) J. Biol. Chem. 273, 19982–19987. [DOI] [PubMed] [Google Scholar]
- 28.Perl, D., Mueller, U., Heinemann, U. & Schmid, F. X. (2000) Nat. Struct. Biol. 7, 380–383. [DOI] [PubMed] [Google Scholar]
- 29.Delbruck, H., Mueller, U., Perl, D., Schmid, F. X. & Heinemann, U. (2001) J. Mol. Biol. 313, 359–369. [DOI] [PubMed] [Google Scholar]
- 30.Tatusov, R. L., Galperin, M. Y., Natale, D. A. & Koonin, E. V. (2000) Nucleic Acids Res. 28, 33–36. [DOI] [PMC free article] [PubMed] [Google Scholar]
- 31.Gasteiger, E., Jung, E. & Bairoch, A. (2001) Curr. Issues Mol. Biol. 3, 47–55. [PubMed] [Google Scholar]
- 32.Kanehisa, M., Goto, S., Kawashima, S. & Nakaya, A. (2002) Nucleic Acids Res. 30, 42–46. [DOI] [PMC free article] [PubMed] [Google Scholar]
- 33.Natale, D. A., Galperin, M. Y., Tatusov, R. L. & Koonin, E. V. (2000) Genetica 108, 9–17. [DOI] [PubMed] [Google Scholar]
- 34.Old, I. G., Margarita, D., Glass, R. E. & Saint Girons, I. (1990) Gene 87, 15–21. [DOI] [PubMed] [Google Scholar]
- 35.Banerjee, R. V. & Matthews, R. G. (1990) FASEB J. 4, 1450–1459. [DOI] [PubMed] [Google Scholar]
- 36.Drennan, C. L., Huang, S., Drummond, J. T., Matthews, R. G. & Lidwig, M. L. (1994) Science 266, 1669–1674. [DOI] [PubMed] [Google Scholar]
- 37.Dixon, M. M., Huang, S., Matthews, R. G. & Ludwig, M. (1996) Structure (London) 4, 1263–1275. [DOI] [PubMed] [Google Scholar]
- 38.Urbanowski, M. L., Stauffer, L. T., Plamann, L. S. & Stauffer, G. V. (1987) J. Bacteriol. 169, 1391–1397. [DOI] [PMC free article] [PubMed] [Google Scholar]
- 39.Lan, R. & Reeves, P. R. (1996) Mol. Biol. Evol. 13, 47–55. [DOI] [PubMed] [Google Scholar]
- 40.Cataldi, A. A. & Algranati, I. D. (1989) J. Bacteriol. 171, 1998–2002. [DOI] [PMC free article] [PubMed] [Google Scholar]
- 41.Kern, A. D., Oliveira, M. A., Coffino, P. & Hackert, M. L. (1999) Struct. Folding Des. 7, 567–581. [DOI] [PubMed] [Google Scholar]
- 42.Momany, C., Ernst, S., Ghosh, R., Chang, N. L. & Hackert, M. L. (1995) J. Mol. Biol. 252, 643–655. [DOI] [PubMed] [Google Scholar]
- 43.Lipscomb, W. N. (1994) Adv. Enzymol. Relat. Areas Mol. Biol. 68, 67–151. [DOI] [PubMed] [Google Scholar]
- 44.Beernink, P. T., Endrizzi, J. A., Alber, T. & Schachman, H. K. (1999) Proc. Natl. Acad. Sci. USA 96, 5388–5393. [DOI] [PMC free article] [PubMed] [Google Scholar]
- 45.Lipman, D. J., Souvorov, A., Koonin, E. V., Panchenko, A. R. & Tatusova, T. A. (2002) BMC Evol. Biol. 2, 20. [DOI] [PMC free article] [PubMed] [Google Scholar]
- 46.Thompson, M. J. & Eisenberg, D. (1999) J. Mol. Biol. 290, 595–604. [DOI] [PubMed] [Google Scholar]
- 47.Taverna, D. M. & Goldstein, R. A. (2000) Biopolymers 53, 1–8. [DOI] [PubMed] [Google Scholar]