Abstract
The tissue-specific transcriptional coactivator OCA-B is required for antigen-dependent B cell differentiation events, including germinal center formation. However, the identity of OCA-B target genes involved in this process is unknown. This study has used large-scale cDNA arrays to monitor changes in gene expression patterns that accompany mature B cell differentiation. B cell receptor ligation alone induces many genes involved in B cell expansion, whereas B cell receptor and helper T cell costimulation induce genes associated with B cell effector function. OCA-B expression is induced by both B cell receptor ligation alone and helper T cell costimulation, suggesting that OCA-B is involved in B cell expansion as well as B cell function. Accordingly, several genes involved in cell proliferation and signaling, such as Lck, Kcnn4, Cdc37, cyclin D3, B4galt1, and Ms4a11, have been identified as OCA-B-dependent genes. Further studies on the roles played by these genes in B cells will contribute to an understanding of B cell differentiation.
OCA-B (OBF-1/Bob1) is a B cell-specific coactivator of the octamer-binding transcription factors OCT-1 and OCT-2. Early in vitro transcription and transfection assays showed that OCA-B is required for optimal transcription of octamer (ATTTGCAT)-containing immunoglobulin (Ig) gene promoters (1–5). Subsequent analyses of Oca-b–/– mice generated by gene targeting showed that OCA-B plays additional roles in B cell differentiation and function (6–9). Although exhibiting largely normal early B cell differentiation in bone marrow, Oca-b–/– mice exhibit severe defects in antigen-dependent B cell differentiation and function, including diminished secondary Ig isotypes in serum, lack of germinal centers in lymphoid organs, and impaired Ab responses to both T-independent and T-dependent antigens. Oca-b–/– primary B cells can carry out isotype switching but are impaired in their ability to express switched Ig genes, leading to the proposal that OCA-B may be involved in the function of the 3′-Ig heavy chain (IgH) enhancer that is important for transcription of switched heavy chain genes (6). Subsequent transfection and transgenic mouse studies indicated that the 3′-IgH enhancer is either a direct or an indirect target gene of OCA-B (10–12).
In addition to the striking inability to form germinal centers, Oca-b–/– B cells show diminished proliferation in response to B cell antigen receptor (BCR) ligation (6). These results indicate that OCA-B regulates other target genes that function in B cell signal pathways leading to proliferation and germinal center formation. However OCA-B target genes that contribute to these defects are not fully understood. Consistent with a role for OCA-B in mature B cell function, the level of OCA-B is tightly regulated during B cell activation and germinal center formation both transcriptionally and posttranscriptionally (13–16). The recent demonstration of a myristoylated OCA-B isoform that shows B cell-specific cytoplasmic to nuclear translocation indicates yet another level of regulation (17). Therefore, identification of additional OCA-B target genes should reveal genes that play critical roles in B cell signal pathways.
This study used cDNA microarrays to identify genes that are up-regulated upon stimulation of normal resting splenic B cells through the BCR alone or through BCR and helper T cell (Th) costimulation. Additional studies then identified genes that are under-stimulated in Oca-b–/– B cells in response to these signals. These OCA-B-dependent genes are likely to function in B cell signaling pathways that are defective in Oca-b–/– B cells and may provide molecular explanations for the Oca-b–/– phenotype.
Methods
Primary B Cell Culture. Resting (high-density) splenic B cells were purified by complement-mediated lysis of Thy-1+ cells followed by Percoll (Pharmacia) gradient centrifugation (6, 18) with typical preparations containing at least 90% B220+ cells by fluorescence-activated cell sorter (not shown). Splenocytes from 20 female mice (5–8 wk old, in B6 × 129Sv background) per genotype were pooled. The cells were stimulated with 30 μg/ml anti-mouse IgM F(ab′)2 fragment (Pierce) for BCR stimulation and 5 μg/ml anti-mouse IgM F(ab′)2, 10 μg/ml anti-CD40 Ab (PharMingen), and 10 ng/ml recombinant mouse IL-4 (Sigma) for costimulation.
Real-Time PCR. DNase-treated total RNA preparations (2 μg) were reverse transcribed by using SuperScript II reverse transcription kit (Invitrogen) followed by real-time PCR using a Quantitec Sybr Green Kit (Qiagen, Valencia, CA). The primer sequences are as follows: Pol2E sense, TCAAGGTATACTGCCAGCGCA, and antisense, GTCCACCAGGAACTGCTTGG; Kcnn4 sense, ATCGGACTCATGGTTCTGCAC, and antisense, GCAGTGGACAGGGTGATCAA; Cdc37 sense, CCACCTGGTGTGTGAGGAAA, and antisense, TCTGGTGAGCTACCTGCTCC; and Lck sense, CCATGATGGAGACTTGGGCT, and antisense, CTTCTTGGCCAGTCGTCAGG.
Primer quality (lack of primer-dimer amplification) was confirmed by melting curve analysis using the ABI Prism 7900HT Sequence Detection system (Applied Biosystems). Relative quantification based on standard curves was calculated by using the efficiency calibrated equation described (19). The gene (AW413738) encoding the RBP5 subunit of RNA polymerase II (RBP5) was found to be unregulated in all of the array experiments and was used as a reference gene.
cDNA Microarray. Microarray assays used an indirect labeling method using 5-(3-aminoallyl)-dUTP and amino-reactive fluorescent dyes Alexa 555 and Alexa 647 (Molecular Probes). Glass cDNA array slides containing 9,800 PCR-amplified mouse cDNA clones (Research Genetics, Huntsville, AL) were from the Rockefeller University Gene Array Core Facility. Hybridization and washing were done in a Hybstation (GeneTAC, Ann Arbor, MI) and slides were scanned in a 428 Glass Array Scanner (Affymetrix, Santa Clara, CA).
For data analyses and clustering, data acquired by genepix pro 3.0 (Amersham Pharmacia) software were directly uploaded into the tango (Transcriptome ANalysis of GenOmes) program (http://arrays.rockefeller.edu; ref. 20). Quality control experiments were carried out to determine optimal RNA concentrations, and yellow test experiments in which duplicate RNA samples from a single source were labeled with Alexa 555 or Alexa 647 dye were performed to determine the inherent noise levels. For expression profiling of the WT B cells in response to BCR stimulation, four replicate probe labelings and hybridizations were carried out. Three replicate experiments were done with Oca-b–/– B cells. The tango query program was used to select genes whose intensity values in each channel were above two standard deviations of background and whose stimulated/resting values were at least 2. The output was further filtered by selecting for genes whose expression changed in at least three replicate experiments. For costimulation experiments, we carried out dye-flip replicates (in which reverse combinations of dyes were used to label the resting and stimulated samples) for each time point. Genes whose expression changed in both of the two replicates were selected. The filtered genes were clustered by using Profile- and K-means clustering (P = 0.05) (21). Verification of representative genes by quantitative real-time PCR and Northern blot indicated that the frequency of false positives was ≈5%.
Chromatin Immunoprecipitation Assay. Chromatin immunoprecipitation assays were performed as described (22) with minor modifications. Abs used included OCA-B C-20, OCT-1 C-21, and OCT-2 C-20, all from Santa Cruz. The primers used were as follows: Kcnn4-1, CACAGGACACAGAGTGGGAAGGAGTTGTAA; Kcnn4-2, GAACGTGACTCTGGGAATAGGATGTTGTGT; Lck-1, GGCTCTCTTTGGATCTCTTACCCAGGAGTAT; and Lck-2, GTTCTGGAGGTGAAGACAGGAATGGCTA.
Results
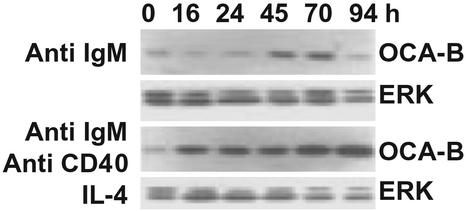
OCA-B Expression Profile During B Cell Activation. Previous reports have shown that OCA-B expression is up-regulated in activated B cells (13). Here we have extended the previous observations by analyzing OCA-B induction over a 94-h period and by determining whether it is up-regulated both by BCR ligation alone and by costimulation. OCA-B expression levels were analyzed in splenic resting B cells stimulated with anti-IgM Ab alone or with a combination of anti-IgM and anti-CD40 antisera and IL-4 for 16, 24, 45, 70, and 94 h by Western blotting. Experiments that monitored global tyrosine phosphorylation for 5–120 min after activation showed that the immediate early responses to B cell activation signals are largely intact in Oca-b–/– B cells (data not shown). On the other hand, an earlier analysis of Oca-b–/– B cells showed significant defects in both BCR-induced proliferation and BCR- and Th cell-induced Ig gene expression at the 48- to 96-h period under similar culture conditions (6). Therefore the analysis was focused on the 16- to 94-h period. As shown in Fig. 1, OCA-B levels were highly up-regulated after 45 h of stimulation with anti-IgM Ab alone. With costimulation, the OCA-B level was up-regulated much earlier and to a significantly higher degree than with anti-IgM stimulation alone. These results indicate that OCA-B expression is regulated by signals mediated by BCR ligation alone as well as by BCR and Th costimulation, and that OCA-B is likely to play roles in early as well as late phases of antigen-dependent B cell differentiation.
Fig. 1.
Western blot analysis of OCA-B expression. Resting (high-density) B cells were stimulated with either anti-IgM F(ab′)2 Ab alone or a combination of anti-IgM F(ab′)2, anti-CD40 Ab, and IL-4. Whole cell extracts were made at indicated time points. The blot was first probed with a polyclonal anti-OCA-B Ab and then with a polyclonal Ab to extracellular signal-regulated kinase (ERK) that detects ERK-1 and -2 to normalize the blot. Note that OCA-B bands (33 and 35 kDa) ran as a single band on this gel.
Gene Expression Profiles in Response to BCR Signaling. After determining conditions for optimal up-regulation of OCA-B, this information was used to analyze gene expression profiles through cDNA microarrays. Because the OCA-B level is very low in resting B cells and highly up-regulated after stimulation, OCA-B target genes should also be up-regulated after activation (i.e., induction of OCA-B expression). However, because there are other transcription factors that are activated by BCR and Th signals (e.g., NF-κB, ref. 23), only a fraction of the genes up-regulated by the activation signal would be targets of OCA-B. We reasoned that when Oca-b–/– B cells are stimulated with the same signal, only those pathways that require OCA-B will be under-stimulated, whereas OCA-B-independent pathways will be preserved. Thus a comparison of up-regulated genes in WT (WT activated/WT resting) and Oca-b–/– (Oca-b–/– activated/Oca-b–/– resting) B cells will result in identification of the genes that require OCA-B for their expression. This approach has an advantage over a direct comparison of gene expression profiles of activated WT and activated Oca-b–/– (activated WT/activated Oca-b–/–) B cells, because any populational and/or developmental variations in gene expression patterns between the two groups of mice will be normalized. Thus, any differences in gene expression profiles between the WT and Oca-b–/– B cells identified with this method would represent differences due solely to the presence or absence of OCA-B.
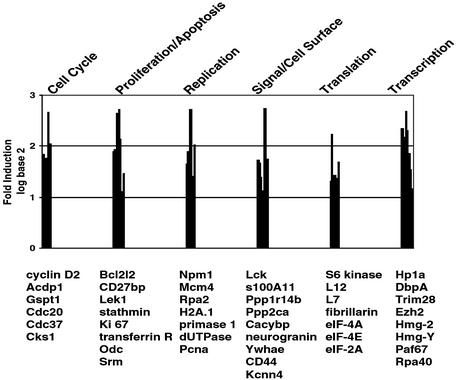
We first analyzed gene expression profiles of WT B cells at 45 h of anti-IgM stimulation, when the OCA-B level is maximal (Fig. 1). Approximately 180 genes were up-regulated and 80 genes were down-regulated by 2-fold or more. The up-regulated genes included cyclin D2 and CD44, which had been identified as B cell activation markers in published microarray analyses (Figs. 2 and 3) (24–26). Key down-regulated genes included BCL6 and many Krüppel-like factors such as KLF2 and KLF4 (data not shown), consistent with the activation phenotype (25). Furthermore, many of the identified genes have been found to be induced in stimulated B cells by microarray or other techniques. These genes include small inducible cytokine subfamily A member 22 (Abcd-1) (27), neurogranin (25), Lck (25, 28), pre-B cell colony-enhancing factor (Pebf) (29), transferrin receptor (30), stearoyl-CoA desaturase (Scd2) (29), ornithine decarboxylase (Odc) (31), Ki67 antigen (29), and enhancer of zeste homolog (Ezh2) (32). These observations suggest that the B cell activation system used in this study is physiologically meaningful and that our cDNA microarray analyses are valid.
Fig. 2.
Genes up-regulated by BCR ligation. Genes whose expression levels increased by at least 2-fold after 45 h of anti-IgM stimulation were identified by using the tango program (see Methods). UniGene, Locus Link, and PubMed database searches (www.ncbi.nlm.nih.gov) were done to group the genes according to their functions. Note that the scale is log base 2.
Fig. 3.
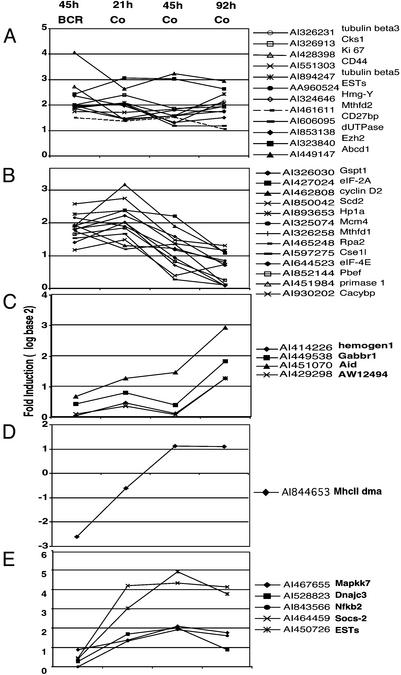
Clustering of genes according to their expression profiles in response to BCR ligation and the costimulation time course. Genes whose expression levels were up-regulated by at least 2-fold with the costimulation were clustered by using K-means clustering. (A) Genes whose expression was up-regulated throughout the costimulation time course. (B) Genes whose expression decreased at later time points during costimulation. Note that all genes in this group are also up-regulated by BCR stimulation alone. (C–E) Genes whose expression was induced only during the late time period. None of these genes were up-regulated by BCR ligation for 45 h. MhcII dma was down-regulated by BCR and up-regulated by costimulation. Note that the scale is log base 2. BCR, anti-IgM F(ab′)2, 45 h. Co, anti-IgM F(ab′)2 + anti-CD40 ab + IL-4.
In addition, several groups of genes performing similar functions were coordinately regulated. These included genes that function in cell cycle progression [cyclin D2, G1 to S phase transition (Gspt1), Cks1, and Cdc20], cell proliferation and apoptosis (Bcl2-like 2, CD27-binding protein, Lek1, and Ki67 antigen), replication and DNA repair (nucleophosmin, mini chromosome maintenance-deficient 4, DNA primase, dUTPase, and proliferating cell nuclear antigen), transcription (Hp1a, DNA-binding protein A, enhancer of zeste homolog, polymerase-associated factor 67, and RNA polymerase I), and translation/ribosome synthesis (S6 kinase, fibrillarin, eIF-4A, and eIF-2A). These expression profiles indicate that the B cells are proliferating and actively transcribing and translating genes and thus have not reached the anergic state (33) at this time point. Therefore, these gene expression changes represent BCR-mediated B cell activation and expansion events. Up-regulated genes also included genes involved in signal transduction, such as calcyclin-binding protein, calpectin, and neurogranin (Fig. 2), indicating creation and/or modification of signal networks.
Gene Expression Profiles in Response to BCR and Th Costimulation. Because the OCA-B expression level was induced as early as 16 h after costimulation and persisted through 94 h (Fig. 1), gene expression profiles were analyzed at 21 h, 45 h, and 92 h (Fig. 3). Most of the genes that were induced after 45 h of BCR stimulation were induced after only 21 h of BCR plus Th costimulation (Fig. 3). These included the key activation markers cyclin D2 and CD44, as well as genes involved in cell cycle progression, replication/DNA repair, transcription, and translation/ribosome synthesis. This observation may indicate that at 21 h, B cells are undergoing an expansion that precedes the terminal differentiation. Some of these genes maintained their expression levels throughout the 92-h time period, whereas some showed a reduction at late time periods (Fig. 3 A and B, respectively). Interestingly, there also were genes whose expression levels were induced only after 45- to 92-h costimulation (Fig. 3 C and D). Notably, the genes induced at this late time period included Aid, involved in Ig isotype switching and somatic mutation (34), as well as MhcII and IgG1 (Fig. 3 C and D and Fig. 4). This observation indicates that B cells are expressing genes associated with B cell function at this time point.
Fig. 4.
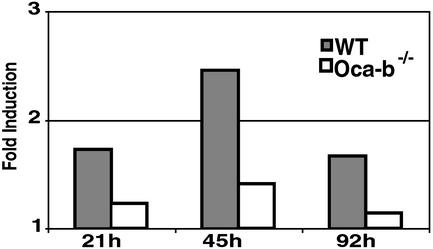
Induction of IgG1 (AI843944) expression with costimulation determined by cDNA array. The average fold induction levels from replicate experiments are shown.
Importantly, there were genes whose expression was induced preferentially by the costimulation (Fig. 3 C–E). These included genes that are induced late and function in B cell immunity, such as Aid, MhcII dma (whose expression was down-regulated by BCR stimulation), and Ig heavy chain (IgG1) (Fig. 3 C and D and Fig. 4). In addition, several genes induced throughout the 21- to 92-h period were preferentially induced by costimulation (Fig. 3E). These included mitogen-activated protein kinase kinase 7 (Mapkk7), a signaling molecule that activates c-Jun N-terminal kinase (JNK) in response to stress (35), and cytokine-inducible SH2-containing protein 2 (Socs-2), a negative modulator of the Janus kinase–signal transducer and activator of transcription (JAK-STAT) pathway (36). These genes represent some of the qualitative differences between signal pathways activated by BCR ligation alone and by costimulation.
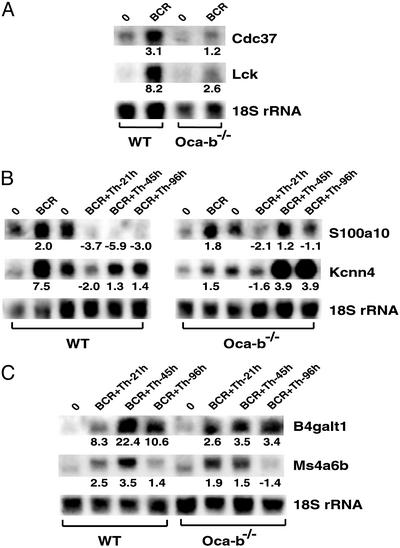
Genes That Are Underexpressed in Oca-b–/– B Cells. To identify genes that require OCA-B for activation-induced up-regulation, expression profiles in Oca-b–/– B cells were analyzed before and after activation. A majority of the genes that were up-regulated in WT B cells were also up-regulated in Oca-b–/– B cells, indicating that the overall transcription status of Oca-b–/– B cells is intact. Thus, OCA-B appears to act on a restricted set of genes that play critical roles in B cell activation and differentiation (Table 1). This conclusion is consistent with the results of biochemical analyses showing OCA-B promoter and activator specificity (1). Expression levels of genes found to be under-stimulated in Oca-b–/– B cells were verified by quantitative real-time PCR and Northern blot analyses (Table 1 and Fig. 5). In general, the levels of induction observed with Northern and quantitative real-time PCR measurements were greater than those observed in cDNA array analyses (Table 1). This tendency has been reported before and may reflect differences in kinetics of hybridization between solid-state- and solution-based reaction conditions (37, 38).
Table 1. Summary of fold induction of the OCA-B dependent genes by either BCR or BCR+Th costimulation for 45 h.
|
WT
|
Oca-b-/-
|
|||||||
|---|---|---|---|---|---|---|---|---|
| Stimulation | Accession no. | Name | Array | Northern | QPCR | Array | Northern | QPCR |
| BCR | A1528742 | Cdc37 | 2.49 | 3.14 | 15.3 | 1.09 | 1.22 | 0 |
| A1413778 | Kcnn4 | 3.30 | 7.57 | 34.2 | 1.27 | 1.51 | 1.2 | |
| A1573454 | Lck | 2.58 | 8.17 | 13.9 | 1.34 | 2.62 | 1.1 | |
| A1323871 | cyclin D3 | 2.23 | ND | 5.30 | 1.14 | ND | 0.8 | |
| A1506208 | s100a10 | 2.68 | 2.02 | 5.36 | 1.29 | 1.43 | 0 | |
| BCR + Th | A1481551 | B4galt1 | 3.38 | 22.4 | ND | 1.07 | 3.49 | ND |
| A1835093 | Ms4a11 | 2.55 | 3.45 | ND | 1.32 | 1.53 | ND | |
QPCR, quantitative real-time PCR; ND, not determined.
Fig. 5.
Northern blot analyses of OCA-B-dependent genes. For all samples, 5 μg of total RNA was fractionated on a formaldehyde gel and blotted onto a nylon membrane (GeneScreenPlus, NEN). The RNA level was detected by using a 32P-labeled probe followed by PhosphorImager (Molecular Dynamics) quantification. Target gene level was normalized against 18S rRNA. The values shown below the blots represent normalized fold changes relative to the resting state (0). A negative fold change denotes down-regulation. See text for discussion of A, B, and C.
Among the genes induced by BCR ligation, those encoding protein tyrosine kinase LCK, potassium intermediate conductance calcium-activated channel (Kcnn4), Cdc37, and cyclin D3 failed to be up-regulated in Oca-b–/– B cells (Table 1 and Fig. 5 A and B). LCK is a key T cell signaling molecule whose expression is up-regulated in activated and transformed B cells and that may be required for maintaining B cell proliferation (28). Interestingly, the Lck gene contains two promoters that are used in a developmental- and cell-type-specific manner: a proximal promoter that is active in thymocytes and a distal promoter that is active in mature T and B cells (39). Recent studies have shown that the potassium channel Kcnn4 is up-regulated in activated T cells and required for sustained T cell proliferation by promoting Ca2+ influx (40, 41). The mammalian homolog of yeast Cdc37 is a molecular chaperone that is involved in cell cycle regulation by targeting Hsp90 to cyclin-dependent kinase 4 and thereby stabilizing the kinase (42). Cyclin D3 has been shown to be up-regulated in activated B cells (43) and functions as a positive regulator of cyclin-dependent kinase 4 or 6, whose activity is required for the G1/S transition. The genes encoding these proteins are likely to be responsible for the BCR-mediated proliferation defects observed in Oca-b–/– B cells (6).
Interestingly, Kcnn4 was highly up-regulated by BCR ligation but not by Th costimulation in WT B cells (Fig. 5B), whereas Oca-b–/– B cells failed to up-regulate Kcnn4 in response to BCR stimulation but showed an up-regulation in response to Th costimulation (Fig. 5B). Similarly, the EF-hand family member encoded by S100a10 (calpectin) was up-regulated by BCR-ligation but highly down-regulated by Th costimulation at 45- to 96-h time points in WT B cells (Fig. 5B), whereas Oca-b–/– B cells showed a slight reduction in BCR-induced up-regulation of S100a10 but maintained the resting levels with costimulation (Fig. 5B). Therefore, OCA-B seems to play dual roles, contingent on the signal pathway activated, in the regulation of these two genes. Namely, OCA-B is required both for their up-regulation by BCR and for their down-regulation by Th costimulation (see Discussion).
Consistent with earlier reports, the Ig heavy chain gene (IgG1, GenBank accession no. AI843944) showed a reduced level of activation in Oca-b–/– B cells (Fig. 4). In addition to Ig genes, this study has identified other OCA-B-dependent genes induced by costimulation signals (Table 1 and Fig. 5C). These include β1,4-galactosyltransferase (B4galt1), which is involved in glycosylation of many immunologically important molecules such as IgG (44), and a recently identified CD20-related transmembrane protein termed membrane-spanning 4-domains subfamily A member 11 (Ms4a11 or Ms4a6b) (45, 46). These genes showed significantly reduced levels of induction by costimulation in Oca-b–/– cells and are likely to be involved in critical T-dependent B cell functions that are defective in Oca-b–/– mice.
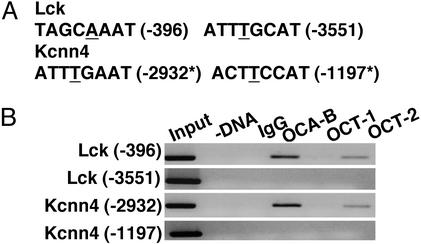
Direct Regulation of Kcnn4 and Lck Expression by OCA-B. Some of the OCA-B-dependent genes identified in this study could contain binding sites for an OCT/OCA-B complex on their promoters and/or enhancers and, thus, directly require OCA-B for full transcriptional activity. Others might lie downstream of the primary OCA-B target genes. Interestingly, searches using tess (transcription element search software, www.cbil.upenn.edu/tess) indicated that the distal promoter of Lck (43) and the predicted promoter region of Kcnn4 contain several octamer sites (Fig. 6A). We analyzed the occupancy of these sites by OCT and OCA-B in the murine lymphoblastic B cell line A20 by chromatin immunoprecipitation assay. As shown in Fig. 6B, OCA-B and OCT-2 were found to bind specific octamer sites on Lck- (–396) and Kcnn4 (–2932)-promoter regions in vivo. This finding suggests that Lck- and Kcnn4-promoter activities may be directly regulated by OCT/OCA-B.
Fig. 6.
Chromatin immunoprecipitation assays of Lck- and Kcnn4-promoter regions. (A) The octamer sites identified on the Lck- and Kcnn4-promoter regions by tess and their positions relative to the transcription start sites are shown. The A/T residue critical for binding by OCA-B is underlined. The asterisk indicates that the relative position on the Kcnn4 promoter is estimated from the EST clone and mouse genomic sequence alignment (National Center for Biotechnology Information). (B) Chromatin immunoprecipitation assays were done by using nuclei isolated from mouse lymphoblastic cell line A20 as described in Methods.
Discussion
Gene Expression Profiles in Normal B Cells. One aim of this study was to characterize gene expression changes that accompany B cell activation and maturation processes. To this end, we used a B cell culture system that allows stimulation by the BCR. Previous studies showed that resting splenic B cells cultured in the presence of an anti-IgM-derived F(ab′)2 fragment at 25–30 μg/ml induces a burst of cell proliferation that peaks around 48–72 h (6, 18). Therefore, this culture system likely mimics the activation process that accompanies a BCR–antigen interaction. Accordingly, the gene expression profiles showed that B cells stimulated with anti-IgM for 45 h up-regulated transcripts of many genes involved in cell cycle progression, DNA replication and repair, cell proliferation, translation, and transcription (Fig. 2). This finding clearly demonstrates that B cells are actively proliferating and making new transcripts and proteins. Interestingly, this is the time period when the BCR-induced OCA-B level is maximal (Fig. 1), indicating that OCA-B is involved in the B cell expansion phase.
In the early time point (21 h) during BCR and Th costimulation, there was a considerable overlap with the up-regulated genes found in the B cells stimulated by BCR for 45 h (Fig. 3). Thus, most of the genes involved in cell cycle regulation, DNA replication and repair, cell proliferation, transcription, and translation induced by BCR ligation were also induced by costimulation but at an earlier time point (21 h vs. 45 h). On the other hand, there was a clear difference between BCR- and costimulation-induced genes at 45 h (Fig. 3). At this time point, a significant number of genes induced by BCR ligation alone (those related to cell cycle progression, translation, and replication) were beginning to show down-regulation with the costimulation (Fig. 3B). Importantly, these B cells began to show induction of genes (including Ig, Mhc II, and Aid) involved in mature B cell function (Table 1, Fig. 3 C and D). These expression profiles indicate that the Th signal accelerates the clonal expansion phase of B cell differentiation and induces genes that are involved in B cell immunity. These findings are consistent with the well-established fact that B cells require two signals (BCR and Th) for full activation and differentiation. Genes whose up-regulation required Th costimulation included Socs-2, which is involved in down-modulation of the JAK-STAT pathway, indicating a feedback mechanism on IL-4 signal, and the JUN kinase activator Mapkk7, consistent with a report that signaling by CD40 activates stress-induced kinases (Fig. 3, ref. 47). The fact that OCA-B is expressed at early (21 h) as well as late (45–96 h) time points during costimulation (Fig. 1) again indicates OCA-B involvement in the expansion, as well as the functional, phase of antigen-dependent B cell differentiation.
Identification of OCA-B-Dependent Genes. The second aim of this study was to identify genes that require OCA-B for up-regulation during B cell activation and differentiation. We now have identified additional OCA-B target genes, such as cyclin D3, Cdc37, Kcnn4, and Lck, that are up-regulated in response to BCR ligation and likely to be involved in B cell proliferation and signaling (Fig. 5 and Table 1). Additionally, B4galt4 and Ms4a6b (Ms4a11) responses to Th costimulation are down-regulated in Oca-b–/– B cells. Because glycosylation is involved in a wide range of important processes (44), defective glycosylation would have a significant impact on B cell function. Notably, the B4galt4 activity is regulated primarily at the level of transcription (48). Although the function of Ms4a6b (Ms4a11) is currently unknown, the fact that it contains transmembrane domains that are conserved in CD20, the high-affinity IgE receptor β chain, and Htm4 suggests an involvement in signal transduction (45, 46).
Interestingly, OCA-B appears to be involved both in down-regulation and in up-regulation of Kcnn4 and S100a10 (Fig. 4B). S100a10 (or calpectin) is a subunit of anexin 2, which is involved in Ca2+-mediated lipid raft organization and vesicle movement (49). The fact that S100a10 and Kcnn4 are up-regulated by BCR ligation and down-regulated by Th costimulation suggests that while they function in BCR-induced expansion, they are not required for the functional phase of B cell differentiation. It also is possible that the failure to down-modulate these genes in Oca-b–/– B cells during the functional phase (i.e., BCR + Th, 45–96 h) may have inhibitory effects on B cell differentiation. Because OCA-B seems to be involved in both positive and negative regulation of the same genes, depending on the signal pathways, it is an intriguing possibility that OCA-B may activate negative regulators of these genes during the functional phase as a feedback mechanism.
In conclusion, this study has identified genes involved in B cell proliferation and signaling as targets of OCA-B. Considering that the ability to proliferate and accurately process BCR- and Th-derived signals is critical for antigen-driven B cell differentiation, including the germinal center reaction (50), failure to appropriately regulate these genes provides molecular explanations for the severe defects observed in Oca-b–/– mice.
Acknowledgments
We thank Greg Khitrov and Mary Steed of The Rockefeller University Gene Array Core Facility for their excellent technical assistance. We also thank Mitzi Morris and Kass Schmitt for help with tango and members of the Roeder laboratory for their support. This work was supported by a National Institutes of Health grant (to R.G.R.), a Lymphoma and Leukemia Society Special Fellowship (to U.K.), and a Cancer Research Institute Postdoctoral Fellowship (to X.R.).
Abbreviations: OCT, octamer-binding transcription factor; OCA-B, OCT transcription coactivator from B cells; BCR, B cell antigen receptor; Th cell, helper T cell.
References
- 1.Luo, Y., Fujii, H., Gerster, T. & Roeder, R. (1992) Cell 71, 231–241. [DOI] [PubMed] [Google Scholar]
- 2.Luo, Y. & Roeder, R. (1995) Mol. Cell. Biol. 15, 4115–4124. [DOI] [PMC free article] [PubMed] [Google Scholar]
- 3.Strubin, M., Newell, J. W. & Matthias, P. (1995) Cell 80, 497–506. [DOI] [PubMed] [Google Scholar]
- 4.Gstaiger, M., Knoepfel, L., Georgiev, O., Schaffner, W. & Hovens, C. (1995) Nature 373, 360–362. [DOI] [PubMed] [Google Scholar]
- 5.Luo, Y., Ge, H., Stevens, S., Xiao, H. & Roeder, R. (1998) Mol. Cell. Biol. 18, 3803–3810. [DOI] [PMC free article] [PubMed] [Google Scholar]
- 6.Kim, U., Qin, X., Gong, S., Stevens, S., Luo, Y., Nussenzweig, M. & Roeder, R. (1996) Nature 383, 542–547. [DOI] [PubMed] [Google Scholar]
- 7.Schubart, D. B., Rolink, A., Kosco-Vilbois, M. H., Botteri, F. & Matthias, P. (1996) Nature 383, 538–542. [DOI] [PubMed] [Google Scholar]
- 8.Nielsen, P. J., Georgiev, O., Lorenz, B. & Schaffner, W. (1996) Eur. J. Immunol. 26, 3214–3218. [DOI] [PubMed] [Google Scholar]
- 9.Kim, U., Gunther, C. S. & Roeder, R. G. (2000) J. Immunol. 165, 6825–6832. [DOI] [PubMed] [Google Scholar]
- 10.Tang, H. & Sharp, P. A. (1999) Immunity 11, 517–526. [DOI] [PubMed] [Google Scholar]
- 11.Stevens, S., Ong, J., Kim, U., Eckhardt, L. A. & Roeder, R. G. (2000) J. Immunol. 164, 5306–5312. [DOI] [PubMed] [Google Scholar]
- 12.Andersson, T., Samuelsson, A., Matthias, P. & Pettersson, S. (2000) Mol. Immunol. 37, 889–899. [DOI] [PubMed] [Google Scholar]
- 13.Qin, X., Reichlin, A., Luo, Y., Roeder, R. & Nussenzweig, M. (1998) EMBO J. 17, 5066–5075. [DOI] [PMC free article] [PubMed] [Google Scholar]
- 14.Stevens, S., Wang, L. & Roeder, R. G. (2000) J. Immunol. 164, 6372–6379. [DOI] [PubMed] [Google Scholar]
- 15.Tiedt, R., Bartholdy, B. A., Matthias, G., Newell, J. W. & Matthias, P. (2001) EMBO J. 20, 4143–4152. [DOI] [PMC free article] [PubMed] [Google Scholar]
- 16.Boehm, J., He, Y., Greiner, A., Staudt, L. & Wirth, T. (2001) EMBO J. 20, 4153–4162. [DOI] [PMC free article] [PubMed] [Google Scholar]
- 17.Yu, X., Wang, L., Luo, Y. & Roeder, R. (2001) Immunity 14, 157–167. [PubMed] [Google Scholar]
- 18.Defranco, A. L., Raveche, E. S., Asofsky, R. & Paul, W. E. (1982) J. Exp. Med. 155, 1523–1536. [DOI] [PMC free article] [PubMed] [Google Scholar]
- 19.Pfaffl, M. W. (2001) Nucleic Acids Res. 29, e45. [DOI] [PMC free article] [PubMed] [Google Scholar]
- 20.Altmann, C. R., Bell, E., Sczyrba, A., Pun, J., Bekiranov, S., Gaasterland, T. & Brivanlou, A. H. (2001) Dev. Biol. 236, 64–75. [DOI] [PubMed] [Google Scholar]
- 21.Tavazoie, S., Hughes, J. D., Campbell, M. J., Cho, R. J. & Church, G. M. (1999) Nat. Genet. 22, 281–285. [DOI] [PubMed] [Google Scholar]
- 22.Shang, Y., Hu, X., DiRenzo, J., Lazar, M. A. & Brown, M. (2000) Cell 103, 843–852. [DOI] [PubMed] [Google Scholar]
- 23.Healy, J. I., Dolmetsch, R. E., Timmerman, L. A., Cyster, J. G., Thomas, M. L., Crabtree, G. R., Lewis, R. S. & Goodnow, C. C. (1997) Immunity 6, 419–428. [DOI] [PubMed] [Google Scholar]
- 24.Alizadeh, A. A., Eisen, M. B., Davis, R. E., Ma, C., Lossos, I. S., Rosenwald, A., Boldrick, J. C., Sabet, H., Tran, T., Yu, X., et al. (2000) Nature 403, 503–511. [DOI] [PubMed] [Google Scholar]
- 25.Glynne, R., Akkaraju, S., Healy, J. I., Rayner, J., Goodnow, C. C. & Mack, D. H. (2000) Nature 403, 672–676. [DOI] [PubMed] [Google Scholar]
- 26.Shaffer, A. L., Rosenwald, A., Hurt, E. M., Giltnane, J. M., Lam, L. T., Pickeral, O. K. & Staudt, L. M. (2001) Immunity 15, 375–385. [DOI] [PubMed] [Google Scholar]
- 27.Schaniel, C., Pardali, E., Sallusto, F., Speletas, M., Ruedl, C., Shimizu, T., Seidl, T., Andersson, J., Melchers, F., Rolink, A. G. & Sideras, P. (1998) J. Exp. Med. 188, 451–463. [DOI] [PMC free article] [PubMed] [Google Scholar]
- 28.Taieb, J., Vitte-Mony, I., Auffredou, M. T., Dorseuil, O., Gacon, G., Bertoglio, J. & Vazquez, A. (1993) J. Biol. Chem. 268, 9169–9171. [PubMed] [Google Scholar]
- 29.Dadgostar, H., Zarnegar, B., Hoffmann, A., Qin, X. F., Truong, U., Rao, G., Baltimore, D. & Cheng, G. (2002) Proc. Natl. Acad. Sci. USA 99, 1497–1502. [DOI] [PMC free article] [PubMed] [Google Scholar]
- 30.Kvaloy, S., Langholm, R., Kaalhus, O., Michaelsen, T., Funderud, S., Foss Abrahamsen, A. & Godal, T. (1984) Int. J. Cancer 33, 173–177. [DOI] [PubMed] [Google Scholar]
- 31.Molitor, J., Pace, W., Stunz, L., Vigna, J., Louie, S. & Ashman, R. (1994) Int. Immunol. 6, 1777–1784. [DOI] [PubMed] [Google Scholar]
- 32.Raaphorst, F. M., van Kemenade, F. J., Fieret, E., Hamer, K. M., Satijn, D. P., Otte, A. P. & Meijer, C. J. (2000) J. Immunol. 164, 1–4. [DOI] [PubMed] [Google Scholar]
- 33.Goodnow, C. C. (1992) Annu. Rev. Immunol. 10, 489–518. [DOI] [PubMed] [Google Scholar]
- 34.Muramatsu, M., Kinoshita, K., Fagarasan, S., Yamada, S., Shinkai, Y. & Honjo, T. (2000) Cell 102, 553–563. [DOI] [PubMed] [Google Scholar]
- 35.Tournier, C., Whitmarsh, A. J., Cavanagh, J., Barrett, T. & Davis, R. J. (1997) Proc. Natl. Acad. Sci. USA 94, 7337–7342. [DOI] [PMC free article] [PubMed] [Google Scholar]
- 36.Krebs, D. L. & Hilton, D. J. (2001) Stem Cells (Dayton) 19, 378–387. [DOI] [PubMed] [Google Scholar]
- 37.Taniguchi, M., Miura, K., Iwao, H. & Yamanaka, S. (2001) Genomics 71, 34–39. [DOI] [PubMed] [Google Scholar]
- 38.Wurmbach, E., Yuen, T., Ebersole, B. J. & Sealfon, S. C. (2001) J. Biol. Chem. 276, 47195–47201. [DOI] [PubMed] [Google Scholar]
- 39.Wildin, R. S., Wang, H. U., Forbush, K. A. & Perlmutter, R. M. (1995) J. Immunol. 155, 1286–1295. [PubMed] [Google Scholar]
- 40.Khanna, R., Chang, M. C., Joiner, W. J., Kaczmarek, L. K. & Schlichter, L. C. (1999) J. Biol. Chem. 274, 14838–14849. [DOI] [PubMed] [Google Scholar]
- 41.Ghanshani, S., Wulff, H., Miller, M. J., Rohm, H., Neben, A., Gutman, G. A., Cahalan, M. D. & Chandy, K. G. (2000) J. Biol. Chem. 275, 37137–37149. [DOI] [PubMed] [Google Scholar]
- 42.Stepanova, L., Leng, X., Parker, S. & Harper, J. (1996) Genes Dev. 10, 1491–1502. [DOI] [PubMed] [Google Scholar]
- 43.Solvason, N., Wu, W., Kabra, N., Wu, X., Lees, E. & Howard, M. (1996) J. Exp. Med. 184, 407–417. [DOI] [PMC free article] [PubMed] [Google Scholar]
- 44.Rudd, P. M., Elliott, T., Cresswell, P., Wilson, I. A. & Dwek, R. A. (2001) Science 291, 2370–2376. [DOI] [PubMed] [Google Scholar]
- 45.Liang, Y. & Tedder, T. F. (2001) Genomics 72, 119–127. [DOI] [PubMed] [Google Scholar]
- 46.Ishibashi, K., Suzuki, M., Sasaki, S. & Imai, M. (2001) Genes Dev. 264, 87–93. [DOI] [PubMed] [Google Scholar]
- 47.Berberich, I., Shu, G., Siebelt, F., Woodgett, J. R., Kyriakis, J. M. & Clark, E. A. (1996) EMBO J. 15, 92–101. [PMC free article] [PubMed] [Google Scholar]
- 48.Lemaire, S., Derappe, C., Pasqualetto, V., Mrkoci, K., Berger, E. G., Aubery, M. & Neel, D. (1998) Glycoconj. J. 15, 161–168. [DOI] [PubMed] [Google Scholar]
- 49.Gerke, V. & Moss, S. E. (2002) Physiol. Rev. 82, 331–371. [DOI] [PubMed] [Google Scholar]
- 50.MacLennan, I. C., Liu, Y. J. & Johnson, G. D. (1992) Immunol. Rev. 126, 143–161. [DOI] [PubMed] [Google Scholar]


