

Abstract
In man assuming the upright position, end-tidal PCO2 (PETCO2) decreases. With the rising interest in cerebral autoregulation during posture change, which is known to be affected by PETCO2, we sought to determine the factors leading to hypocapnia during standing up from the supine position. To study the contribution of an increase in tidal volume (VT) and breathing frequency, a decrease in stroke volume (SV), a ventilation–perfusion (V/Q) gradient and an increase in functional residual capacity (FRC) to hypocapnia in the standing position, we developed a mathematical model of the lung to follow breath-to-breath variations in PETCO2. A gravity-induced apical-to-basal V/Q gradient in the lung was modelled using nine lung segments. We tested the model using an eight-subject data set with measurements of VT, pulmonary O2 uptake and breath-to-breath lumped SV. On average, the PETCO2 decreased from 40 mmHg to 36 mmHg after 150 s standing. Results show that the model is able to track breath-to-breath PETCO2 variations (r2= 0.74, P < 0.05). Model parameter sensitivity analysis demonstrates that the decrease in PETCO2 during standing is due primarily to increased VT, and transiently to decreased SV and increased FRC; a slight gravity-induced V/Q mismatch also contributes to the hypocapnia. The influence of cardiac output on hypocapnia in the standing position was verified in experiments on human subjects, where first breathing alone, and then breathing, FRC and V/Q were controlled.
In man the carbon dioxide (CO2) content of the alveolar air is lower in the upright position than in the supine position (Lilijestrand & Wollin, 1914). Main et al. (1937) confirmed this observation and explained it as being due to over-ventilation with resulting alkaemia. However, Hitchcock & Ferguson (1938) showed the drop in alveolar CO2 partial pressure (PCO2) upon assuming the erect posture to be independent of alterations in pulmonary ventilation. They attributed the lowered PCO2 to an increase in functional residual capacity (FRC) in the upright position and an impairment of CO2 transport from the dependent parts of the body.
In man assuming the upright position, cardiac output (Q) decreases (Stead et al. 1944). Variation in end-tidal partial PCO2 (PETCO2) reflects variation in Q in the same direction, for example during acute haemodynamic perturbations in anaesthetized patients during constant ventilation (Shibutani et al. 1994). Airway CO2 levels have been proposed as a monitor of Q during cardiovascular resuscitation (Blumenthal & Voorhees, 1997). We considered that the postural decrease in Q could well contribute to hypocapnia.
Previous studies have focused on the effect of gravity and body position on the distribution of ventilation (Zardini & West, 1966; Bryan et al. 1966; Milic-Emili et al. 1966), perfusion (West & Dollery, 1959; Anthonisen & Milic-Emili, 1966) and the ventilation–perfusion (V/Q) ratio (West, 1962; West et al. 1963; Musch et al. 2002) in the lung. Gravity induces a perfusion gradient in the upright lung, with a decrease in lung perfusion in apical regions and an increase in perfusion in basal regions. In the standing subject, air expired from alveoli active in gas exchange is diluted by air from apical lung segments which are relatively underperfused, resulting in a decrease in PETCO2. In the upright position, FRC and tidal volume (VT) increase, due to lowering of the diaphragm and alveolar expansion due to the lungs' own weight. However, the relative contribution of each of these physiological phenomena to the postural decrease in PETCO2 is unknown.
With the rising interest in cerebral autoregulation during posture change (Birch et al. 1995; Cencetti et al. 1997; Novak et al. 1998; Harms et al. 2000; Hughson et al. 2001; Edwards et al. 2002), which is affected by PCO2, we sought to determine the factors leading to transient PETCO2 variation during standing up from the supine position. We hypothesized that the reduction in Q, and the V/Q mismatch determine the decrease in PETCO2 upon standing up. To test this hypothesis, we developed a nine-compartment computer model of the lung to simulate breath-to-breath PETCO2 variations during active standing up. The model includes an FRC, VT and anatomic dead space (VD). Lung perfusion is modelled using stroke volume (SV) and heart rate (HR). Regional V/Q ratios are modelled for each lung compartment, accounting for effects of gravity. Input data to the model are Fick-calibrated breath-to-breath SV of the heart, pulmonary O2 uptake (V̇O2), respiratory interval (Tresp) and VT.
Methods
Model
To assess the underlying physiology determining PETCO2 transients during posture change, we developed a breath-to-breath model, programmed in MATLAB (Release 5.2, The MathWorks, Natick, MA, USA). A detailed description of the mathematical model is given in the Appendix. The features of each breath (e.g. arterial and venous CO2 concentrations) depend on the features of the previous breaths. Input data to the model are (Fick-calibrated) SV determined breath-to-breath, V̇O2 and VT. The model is ‘paced’ by the respiratory interval.
Ventilation
The model includes nine lung compartments (Fig. 1, right panel). Each compartment's share of the FRC and VT is determined by its position with the apical compartments smaller than the basal compartments. The distributions of VT and SV in the upright position, are approximations based on observations by West (1962) (Table 1). The model includes VD. Using an established relation between anatomical VD and height (Hart et al. 1963), we set the model VD for men at a greater volume compared to the VD for women (1.4 times), with the VD at 200 ml for men and 140 ml for women in the supine position. In the upright position, these values were increased by 70 ml (see below). The respiratory quotient (RQ), defined as the ratio of carbon dioxide production (V̇CO2) to V̇O2, normally between 0.7 and 1.0, was set at 0.9.
Figure 1. Diagram of the PETCO2 model.

The left panel represents circulation with an arterial volume Va, a venous volume Vv, a lung capillary volume Vcap, and circulating stroke volume per breath SV. The right panel represents ventilation with a functional residual capacity FRC, a respiratory dead space VD, and a tidal volume VT. The distribution of SV and VT as shown here are for the upright position; in the supine position SV and VT are equally distributed over apical and basal lung segments (1–9).
Table 1.
Parameters of nine-compartment lung model
| Lung compartment (apical to basal, respectively) | |||||||||||
|---|---|---|---|---|---|---|---|---|---|---|---|
| 1 | 2 | 3 | 4 | 5 | 6 | 7 | 8 | 9 | Total | ||
| Supine | Perfusion (% SVk) | 11.1 | 11.1 | 11.1 | 11.1 | 11.1 | 11.1 | 11.1 | 11.1 | 11.1 | 100 |
| Ventilation (%VTk) | 11.1 | 11.1 | 11.1 | 11.1 | 11.1 | 11.1 | 11.1 | 11.1 | 11.1 | 100 | |
| Alveolar vol. (% FRCk) | 6.58 | 8.64 | 10.11 | 11.16 | 11.90 | 12.43 | 12.81 | 13.08 | 13.27 | 100 | |
| Lung capil. (%Vcapk) | 6.58 | 8.64 | 10.11 | 11.16 | 11.90 | 12.43 | 12.81 | 13.08 | 13.27 | 100 | |
| Standing | Perfusion (% SVk) | 0.58 | 3.21 | 5.84 | 8.47 | 11.10 | 13.73 | 16.36 | 18.99 | 21.62 | 100 |
| Ventilation (%VTk) | 4.58 | 6.63 | 8.48 | 10.13 | 11.62 | 12.96 | 14.17 | 15.25 | 16.22 | 100 | |
| Alveolar vol. (% FRCk) | 6.58 | 8.64 | 10.11 | 11.16 | 11.90 | 12.43 | 12.81 | 13.08 | 13.27 | 100 | |
| Lung capil. (%Vcapk) | 6.58 | 8.64 | 10.11 | 11.16 | 11.90 | 12.43 | 12.81 | 13.08 | 13.27 | 100 | |
Distribution of stroke volume (SV), tidal volume (VT), functional residual capacity (FRC) and lung capillary blood volume (Vcap) per lung segment k, in the supine and standing position. Upright distributions are based on measurements by West (1962).
Circulation
The model includes a simplified blood circulation with an arterial compartment (Va), a venous compartment (Vv) and lung capillary gas-exchange compartments (Vcap) (see Fig. 1, left panel). The lung capillary volume and the small venule volume are lumped together, as gas exchange occurs in both. The major arteries of the lung are included in the venous compartment; the major veins of the lung are included in the arterial compartment. The total blood volume of 5.5 l is distributed over Vv (4.0 l), Va (1.3 l) and Vcap (0.2 l) (Burton, 1972).
Effects of gravity
The effects of gravity are modelled as a gravity-induced perfusion gradient in the lung. The distribution of perfusion and ventilation in each lung compartment are based on measurements by West (1962). Distributions of VT, SV, FRC and Vcap are summarized in Table 1. In the supine position, SV and VT are distributed equally over all compartments. With nine compartments, in the supine position each lung compartment receives one-ninth of the breath-to-breath SV and VT. In the upright position there is an apical-to-basal perfusion and ventilation gradient, with increased perfusion and ventilation at the lung base. The perfusion gradient is steeper than the ventilation gradient, resulting in a 7.9–0.8 apical-to-basal V/Q gradient. Furthermore, on going from supine to upright respiratory VD increases (Bjurstedt et al. 1962; Rea et al. 1977). Bjurstedt et al. (1962) established an increase in VD in the upright position of +53 ml (anatomical) and +81 ml (physiological). In the model, VD increases by 70 ml in the upright position.
Data set
The physiological data we used to test our model are from eight healthy young subjects (2 women; median age 24 years (21–38 years); median height 183 cm (162–191 cm); median weight 78 kg (50–85 kg)), who participated in the study of van Lieshout et al. (2001) for which informed consent had been obtained from all participants, and which was approved by the ethics committee of Copenhagen (KF 01-120/96) and was performed in accordance with the guidelines laid down in the Declaration of Helsinki. Instrumentation occurred as previously described; after 5 min of supine rest, each subject actively assumed the upright position and remained standing for 5 min while continuous finger arterial blood pressure (ABP) and breath-to-breath online gas concentrations were recorded. The data we analysed were from a recording of each subject standing up just once. For the purpose of tracking short-term PETCO2 variations with posture change, we selected data starting 150 s prior to standing up and ending 150 s after standing up.
Mean arterial blood pressure was measured with a Finapres (Model 5; Netherlands Organization for Applied Scientific Research, Biomedical Instrumentation, TNO-BMI). The cuff was applied to the midphalanx of the middle finger of the dominant arm, which was placed at heart level. Beat-to-beat changes in SV were estimated by modelling flow from arterial pressure (Modelflow, TNO-BMI). This method computes an aortic waveform from a peripheral arterial pressure signal using a non-linear 3-element model of the aortic impedance (Jellema et al. 1999; Harms et al. 1999). Cardiac output was the product of SV and HR. To obtain absolute values of Q to calibrate Modelflow Q, a Fick-determined Q was obtained from arterial and central venous O2 content and the V̇O2 in the supine and in the standing position. Absolute values of Q were used to calibrate Modelflow Q, averaged during 150 s in the supine position, and during 150 s of standing.
Breath-to-breath online gas analysis was performed using a Medical-Graphics CPX/D metabolic cart. Respiratory gas was sampled continuously from a mouthpiece and partial gas pressures were obtained from a Zirkonia oxygen analyser (accuracy ± 0.03% O2) and a non-dispersive infrared sensor for CO2 (accuracy ± 0.05% CO2) that thus delivered V̇O2, V̇CO2 and PETCO2.
Data processing and analysis
The ventilatory gas analysis was recorded as one value for every breath. All data were stored on a hard disk for off-line analysis. Mean ABP, HR and the ventilatory data were expressed in absolute values. Mean ABP was the integral of one beat. Heart rate was the inverse of the interbeat interval. Then, ventilatory data and Fick-calibrated Modelflow SV data were time aligned. For the duration of each breath, the sum of stroke volumes was taken to obtain breath-to-breath SV data.
Experiments
To verify the contribution of the postural reduction in Q to hypocapnia in the standing position, the following protocol was carried out in seven healthy non-smoking subjects (aged 29 ± 5 years, height 176 ± 8 cm, weight 71 ± 11 kg). Informed consent was obtained from all participants. The study was approved by the ethics committee of the Academic Medical Center (MEC 01-147) and performed in accordance with the guidelines laid down in the Declaration of Helsinki. First, the effect of increased ventilation was eliminated by using a protocol that involved standing up during controlled breathing. Second, we eliminated the effect of V/Q mismatch, FRC increase and increased ventilation. To achieve this we used a protocol involving standing with inflated leg splints (Pneumasplint, International deposit Nr. 844181), which augment venous return, followed by rapid leg splint deflation, with breathing frequency and VT controlled. The subjects breathed through a mouthpiece connected to a two-way respiratory valve, and were instructed to breathe at a metronome-paced frequency (0.15 Hz). For each subject the airflow was adjusted to a comfortable level (8.2 ± 1 l min−1). During expiration the inflow of air filled a bag, and during inspiration the subject was instructed to empty the bag, thus maintaining a constant VT. Keeping the breathing fixed, 5 min of supine recording were followed by 5 min of recording in the standing position. Next, while in the standing position inflatable hip-to-toe leg splints were inflated to 60 mmHg. After 5 min recording during standing with inflated splints, the splints were deflated to atmospheric pressure within 4 s, followed by 5 min recording in standing position with deflated splints. The respiratory frequency and VT were fixed throughout the procedures. We measured finger ABP (Finometer Model 1, TPD-BMI) and PCO2 (Hewlett Packard Airway Adapter 1436 A). SV was derived from the peripheral arterial pressure signal using Modelflow as described above. Measurements of Q were carried out at the beginning and end of each procedure using the inert gas rebreathing technique (Innocor Model: SpO2 & O2 options; Gabrielsen et al. 2002). Rebreathing episodes were marked and Modelflow Q was level-corrected. The sum of FRC and VD was measured in the supine and standing positions, also using the Innocor rebreathing technique. The calculation is based on the dilution of insoluble gas (SF6). Measurement of FRC and VD combined, in both the supine and standing positions, allowed us to analyse the effect of FRC increase, as measured, on the PETCO2.
Parameter sensitivity analysis
To assess the relative contribution of the various physiological phenomena contributing to PETCO2 variations, the parameter sensitivity of the model was analysed. First, the effect of variations in VT, VD, SV, V̇O2, RQ, FRC, Vv, Va, TRESP and V/Q on model output (M-PETCO2) were evaluated by carrying out a series of simulations in which a steady-state period of 200 s was followed by a 900 s period with one input parameter set at a value ranging from –10 to +10% of baseline value. An exception is the V/Q parameter sensitivity, which was determined starting with 200 s steady-state ‘supine’ settings, followed by 900 s with ‘upright’ settings. Steady-state values were: VT = 484 ml; VD = 200 ml; SV = 550 ml;V̇O2 = 250 ml min−1; RQ = 0.9; FRC = 2.5 l; Vv= 4.0 l; Va= 1.3 l; TRESP= 4 s and V/Q =‘supine’. The output value used in the analysis was M-PETCO2 at maximum value or at end-point. Second, the analysis was also performed with the input starting at baseline and varying each input variable as occurs during posture change, with an increase in VT, VD and FRC, a reduction in SV, and a shift in V/Q.
Statistical analysis
Haemodynamic and respiratory variables were tested for normality (Shapiro-Wilk test) and, where distribution was not normal, the median was computed for each body position. Results were expressed as means and standard deviation (s.D.) or as median and range, as appropriate. Supine and upright values were compared by paired t test. Agreement between PETCO2 and M-PETCO2 was judged by plotting the difference between M-PETCO2 and PETCO2 against their means, and computing Pearson's correlation coefficient. The mean difference (bias) and s.D. (precision) between M-PETCO2 and PETCO2 was tested by paired t test. A P value < 0.05 was considered to indicate a statistically significant difference.
Results
Input to the model
The group average haemodynamic and ventilatory responses to standing up from the test database are given in Table 2. Upon standing, Q decreased from 6.5 ± 1.1 l min−1 to 4.0 ± 0.9 l min−1 in the standing position. The Q response ranged from −0.6 l min−1 to −4.5 l min−1. VT increased on standing up, while the respiratory rate decreased. VE increased on standing up in all subjects, with a range of 0.3–5.9 l min−1. The PETCO2 decreased from 40 ± 1 to 36 ± 2 mmHg.
Table 2.
Haemodynamic and ventilatory responses to standing up in eight normal subjects
| Q (l min−1) | V̇CO2 (ml min-1) | V̇O2 (ml min−1) | PETCO2 (mmHg) | R-R (min−1) | VT (ml) | VE (l min−1) | |
|---|---|---|---|---|---|---|---|
| Supine | 6.5 ± 1.1 | 217 ± 36 | 263 ± 60 | 40 ± 1 | 16 ± 4 | 490 ± 105 | 7.9 ± 1.4 |
| Standing | 4.0 ± 0.9 | 248 ± 53 | 263 ± 65 | 36 ± 2 | 13 ± 3 | 734 ± 199 | 9.8 ± 2.7 |
| P value* | 0.002 | n.s. | n.s. | < 0.001 | 0.03 | 0.005 | 0.03 |
Group average values (mean ± s.D.) for cardiac output (Q), CO2 output (V̇CO2), oxygen uptake (V̇O2), end-tidal CO2 pressure (PETCO2), respiratory rate (R-R), tidal volume (VT) and expired ventilation (VE) as determined from 150 s in the supine position followed by 150 s of standing. Data from the study of van Lieshout et al. (2001).
Standing versus supine, paired t test.
Model simulation
Inputs to the model were (measured) breath-to-breath values of VT, SV (summed per breath) and V̇O2. Starting values for PCO2 in the venous and the arterial blood and in the various lung compartments were set for each test subject, corresponding to their starting measured PETCO2. Venous CO2 concentrations were set at a starting value ranging from 52 to 55%. The PCO2 starting values in arterial blood and the lung compartments ranged from 40 to 42 mmHg. The first breaths of each model run were excluded from analysis. The PETCO2 and the M-PETCO2 during 150 s in the supine position followed by 150 s of standing of all individual subjects are given in Fig. 2. The model tracks PETCO2 during standing up, and it also follows non-posture-related variations in PETCO2(r2= 0.43–0.86), with those registrations with the greatest variance in measured PETCO2 resulting in the best correlations of M-PETCO2 with PETCO2(P < 0.01).
Figure 2. Individual PETCO2 recordings and model simulations during lying down and standing.

Plots of breath-to-breath PETCO2 of each individual subject. Subjects 1–8 are represented in panels A–H, respectively. Each panel contains a plot of breath-to-breath PETCO2 measurements (•) during 150 s supine and 150 s of standing, and a model simulation (^) of the same period. Arrows indicate posture change from supine to standing at time zero.
Figure 3A shows the pooled results of breath-to-breath M-PETCO2, plotted against the pooled PETCO2 measurements. There was a significant correlation between M-PETCO2 and PETCO2(r2= 0.74, P < 0.05). The difference between PETCO2 and M-PETCO2, versus the average PETCO2 is shown in Fig. 3B. Accuracy (group-averaged M-PETCO2–PETCO2 difference) and precision (s.D. of the M-PETCO2–PETCO2 difference) of the model during the simulation were –0.16 and 1.93 mmHg, respectively (95% limits of agreement were −3.95 and + 3.63 mmHg).
Figure 3. Pooled data of 300 s of PETCO2 registration in 8 subjects, 150 s supine and 150 s standing, plotted against the output of a model run of the same time period.

The number of data points is 583, representing the total of 583 breaths. A, pooled data of computed PETCO2 (M-PETCO2) plotted against measured PETCO2. B, pooled data scatter diagram of differences between measured PETCO2 and computed PETCO2 (M-PETCO2) against their mean. Horizontal lines indicate mean ± 1.96 s.d.
Experiments
To verify the contribution of the postural reduction in Q to hypocapnia in the standing position, a protocol of standing up during controlled breathing, and the deflation of leg splints was applied on seven subjects. Throughout standing up and deflation of leg splints, the minute ventilation was fixed (the level ranged from 7 to 9.5 l min−1) and breathing frequency was maintained at 0.15 Hz.
Supine versus standing
On average the sum of FRC and VD increased from 2.8 ± 0.8 l in the supine position to 3.3 ± 0.3 l in the upright position (P = 0.22). The group average mean ABP was 84 ± 8 mmHg supine versus 87 ± 13 mmHg standing (n.s.), whereas HR increased from 74 ± 5 to 89 ± 7 beats min−1 (P < 0.001). With VT and TRESP fixed, both Q (–0.6 to –3.1 l min−1) and PETCO2 (–2.3 to –3.5 mmHg) decreased on going from supine to standing (Fig. 4). In other words, PETCO2 decreased in the upright position even though the depth and rate of breathing were kept constant. However, the decrease in PETCO2 and the decrease in Q showed a correlation coefficient (r2) of only 0.06.
Figure 4. PETCO2 and Q during controlled breathing in 7 healthy subjects.

Results of supine and standing (A) and inflated and deflated leg cuffs (B) protocols. Symbols represent average end-tidal PCO2 (top) and cardiac output (Q, bottom) during 5 min. The lines link the results of a particular subject. Asterisk indicates P < 0.01.
Inflated versus deflated leg splints
The group average mean ABP was 88 ± 11 mmHg with inflated splints versus 86 ± 10 mmHg with deflated splints (n.s.), whereas HR increased from 80 ± 8 to 93 ± 10 beats min−1 (P = 0.02). Following deflation of splints, Q decreased (−0.1 to −1.1 l min−1) and PETCO2 decreased (ranging from –1.4 to −3.6 mmHg) in all subjects, while VT and Tresp were fixed (Fig. 4). The correlation between the decrease in Q and PETCO2 yielded a correlation coefficient of r2= 0.80.
Parameter sensitivity analysis
The sensitivity of the model output to variations in parameters and model input was analysed. This resulted in a transient change in model output, a progressive variation or no variation in the output.
Transient M-PETCO2 change.
A decrease in SV resulted in a transient reduction in PETCO2 with a peak after six breaths (Fig. 5A). The model response to SV change was asymmetrical: a decrease in SV had a greater effect on PETCO2 than an increase in SV of similar magnitude. The model response to an increase in FRC was transient, the peak response occurred at the first breath and rapidly decayed (Fig. 5B). The model response to FRC variation also showed asymmetry; a decrease in FRC yielded a greater M-PETCO2 variation than an increase in FRC of the same magnitude.
Figure 5. Parameter sensitivity analysis of SV and FRC.

Each line represents a model run where after 200 breaths under baseline conditions the input is changed from its baseline value by –10 to +10%, in steps of 2%. In A the input is SV of the heart, in B the input is FRC. Note difference in ordinate scale.
Progressive M-PETCO2 change.
A strong influence on model output was exerted by changes in VT, Tresp, V̇O2, RQ and VD (Fig. 6). The effects of Tresp, V̇O2 and RQ on M-PETCO2 were equal, as can be expected from eqn (4) (see Appendix), where the V̇CO2 per breath is determined by V̇O2,n, the RQ and the breath duration. The V/Q gradient was analysed by comparing a model run with homogeneous perfusion distribution (as in the supine position) to a model run with a gravity-induced lung-perfusion gradient (as in the standing position). The steady-state model run with ‘supine’V/Q distribution resulted in a baseline PETCO2 of 40 mmHg. After the model run with ‘upright’V/Q distribution, the PETCO2 was 38.4 mmHg after 900 s.
Figure 6. Analysis of effect of each input variable on PETCO2.

Parameter sensitivity analysis of model input (Tresp, VT, V̇O2) and model parameters (VD and RQ). Model input is changed from baseline by –10 to +10% (see Methods) and model output (PETCO2) determined after 900 s.
Appendix
| Symbols | Definition | Units |
|---|---|---|
| [CO2]a | Arterial CO2 content | % |
| [CO2]v | Venous partial CO2 content | % |
| ABP | Arterial blood pressure | mmHg |
| FRC | Functional residual capacity | ml |
| HR | Heart rate | beats min−1 |
| PETCO2 | End-tidal partial CO2 pressure | mmHg |
| M-PETCO2 | Model output end-tidal partial CO2 pressure | mmHg |
| PkCO2 | Lung compartment k partial CO2 pressure | mmHg |
| PtcCO2 | PCO2 of blood draining the lungs | mmHg |
| Q | Cardiac output | l min−1 |
| RQ | Respiratory quotient | unitless |
| R-R | Respiratory rate | min−1 |
| SV | Stroke volume per breath | ml |
| TRESP | Respiratory interval | s |
| Va | Arterial blood volume | ml |
| Vcap | Lung capillary blood volume | ml |
| VD | Anatomical dead space | ml |
| VE | Ventilation | l min−1 |
| V̇o2 | Pulmonary O2 uptake | ml min−1 |
| V/Q | Ventilation/perfusion ratio | unitless |
| VT | Tidal volume | ml |
| Vv | Venous blood volume | ml |
No M-PETCO2 change.
A 10% increase or decrease in Vv or Va did not influence model outcome of PETCO2. However, an increase in Va or Vv results in increased damping of breathing pattern-related variation in PETCO2.
Posture-induced variations
The contribution of each parameter on PETCO2 as is likely to occur during posture change is given in Fig 7. For example, a 20% increase in VT resulted in a progressive decrease in PETCO2 which dropped from 40 to 34 mmHg after a 300 s model run. An increase in FRC resulted in acute hypocapnia which lasted for several breaths. After 300 s, however, the PETCO2 was only 1 mmHg below supine levels. The posture-dependent change in the V/Q mismatch per se had a limited effect on the decrease in PETCO2.
Figure 7. Effect of active-standing induced variations in model input variables on PETCO2.

Each thin line indicates the output of a model run starting with supine settings and with parameter settings varied at 200 s as is likely to occur on standing up: Q, output when Q was reduced by 40%, VT, output when VT was increased by 20%, FRC, output when FRC was increased by 20%, VD, output when VD was increased by 70 ml, V/Q, output when V/Q shifted from equal distribution to model settings for a gravitationally induced V/Q mismatch. The thick line labelled ALL indicates model PETCO2 levels when all of these changes occurred simultaneously.
Computed effect of FRC and VD increase upon standing
We conducted an additional analysis of the increase in FRC and VD, which occur simultaneously during tilt. On average the sum of FRC and VD increased from 2.8 ± 0.8 l in the supine position to 3.3 ± 0.3 l in the upright position (P = 0.22). We used model (male) supine steady state settings (see above) to analyse the effect on PETCO2, where an FRC of 2.5 l and VD at 0.2 l results in a PETCO2 of 40 mmHg. By increasing FRC to 2.93 l and VD increased to 0.27 (VD is known to increase by ∼70 ml in the upright position; together VD and FRC now amount to 3.2 l), computed PETCO2 transiently decreased by 12% in the first breath. However, after 9 breaths the hypocapnia had completely disappeared, and after 13 breaths PETCO2 had increased to above steady state levels. Therefore, an increase in FRC and VD combined induce hypocapnia only in the first 40 s.
Discussion
The present study determined the relative contributions of increased ventilation and FRC, slight V/Q mismatch, and decreased cardiac output to the postural decrease in PETCO2. For this we developed a mathematical model based on respiratory and circulatory physiology, which predicted PETCO2 variations during the transition from supine to standing and for 2.5 min in the upright position. The model is sensitive to changes in VT, FRC and VD, SV, Tresp, V̇O2, RQ, and V/Q, all of which affect model output, i.e. PETCO2 (Figs 5, 6 and 7). Stroke volume transiently affects model PETCO2 with a maximal effect after several breaths (Fig. 5A). This response is asymmetrical, with a greater effect from a decrease in SV compared to an increase in SV. An increase in FRC causes a transient decrease in model PETCO2 (Fig. 5B). However, with the concomitant increase in VD, the FRC-induced hypocapnia is of limited duration (∼40 s). A gravitation-induced slight V/Q mismatch as occurs during standing up (Fig. 1, Table 1) contributes to the decrease in PETCO2. RQ affects model PETCO2 levels, but does not vary on a breath-to-breath basis. Thus, the VT increase and SV reduction when standing up are the physiological events primarily responsible for the decrease in PETCO2, whereas a gravity-induced V/Q mismatch and, transiently, an increase in FRC contribute to hypocapnia.
The predominant influence of Q on hypocapnia in the standing position was verified in experiments on human subjects, using a protocol in which first breathing alone and then breathing, FRC and V/Q were controlled. The correlation between the decrease in Q and in PETCO2 (r2= 0.80), in the absence of alternations in breathing, FRC and V/Q indicates that the postural decrease in Q contributes to hypocapnia.
Limitations
The lung model presented is, by design, a simplified representation of lung ventilation and perfusion, and has limitations. First, the model circulation is simplified into a venous, an arterial and a lung capillary compartment. There is no bronchial arterial shunt included, because its effect on the PETCO2 is thought to be small and not likely to vary with posture change. Autoregulation of the lung is not included in our model, and the model circulation does not include a venous pooling reservoir, although venous pooling has profound effects on PETCO2 (Hitchcock & Ferguson, 1938). We considered a pooled venous reservoir with high PCO2 levels in blood and interstitium likely to affect the PETCO2 when assuming the supine position after prolonged standing rather than on going from a supine position to standing up. When pooled blood with elevated PCO2 returns to the heart and subsequently reaches the lungs, this will result in a PETCO2‘overshoot’. Interstitial space and CO2 transfer to and from extracellular space are not modelled, nor are changes in haemoglobin concentration due to haemoconcentration during standing. The model was designed for short-term PETCO2 variability and we assumed that changes in haemoglobin concentration are minor.
The apex-to-base V/Q distribution inequality in the standing position results in a decrease in PETCO2 because the air expired from alveoli active in gas exchange is diluted by air from apical lung segments which are relatively underperfused, suggesting that the reduction in PETCO2 will be more pronounced than the reduction in arterial PCO2 when standing up. In 1962 Bjurstedt et al. observed that changing from the supine to the standing position was associated with a significant rise in the arterial-to-end-tidal PCO2 difference. However, our current model and experimental data do not allow us to analyse the arterial-to-end-tidal PCO2 difference due to the afore-mentioned model limitations, including the absence of a bronchial arterial shunt, a venous pooling reservoir and lung-autoregulation.
To convert [CO2] to PCO2 and vice versa, we fitted blood CO2 equilibrium curves (see Appendix), without accounting for O2 dependency. We did not implement Kelman's digital computer procedure for conversion of PCO2 into blood CO2 content, which in our model would yield a linear relationship because haemoglobin concentration and temperature are assumed to remain constant (Kelman, 1967).
Step changes in Vv and in Va did not influence PETCO2 in the sensitivity analysis, where all other model settings were kept constant. This does not imply that settings for Vv and Va are of no consequence. These compartments act as buffers for PETCO2 changes brought about by variations in VT, SV, etc. Therefore, a larger Vv or Va will result in damping of PETCO2 variations.
Several model parameters are estimated based on previous studies. The distribution of ventilation and perfusion in the upright position are based on measurements of West (1962). The distribution of ventilation and perfusion over the lung are influenced by a gravity-invoked hydrostatic pressure gradient (perfusion) and a pleural pressure gradient influencing the alveolar pressure–volume relationship (ventilation). Although in the supine position there is still some effect of gravity, this will be less because the vertical height of the lung is less than in the upright position. Therefore, we chose to model the distribution of ventilation and perfusion in the supine position as equally distributed from apex to base.
Conclusions
In human subjects assuming the upright position, end-tidal CO2 levels drop. The present study shows that the CO2 levels during posture change can be tracked using a mathematical model, with breath-to-breath values for tidal volume, stroke volume, pulmonary O2 uptake and respiratory interval as input variables. We found that the decrease in end-tidal CO2 level in the standing position is due to increased tidal volume and transiently decreased cardiac output, and increased FRC. The gravity-induced slight ventilation–perfusion mismatch contributes to hypocapnia.
Model equations
Conversion and weight functions
The CO2 equilibrium curve relating blood CO2 content ([CO2]) to blood partial CO2 pressure (PCO2) is described as [CO2]=f(PCO2), with
To compute PCO2 from [CO2] in blood, we use the inverse function
To convert PCO2 in air (mmHg) to [CO2] (%), we use the conversion factor c, which amounts to 0.1316% mmHg−1. The distribution of SV and VT over each lung compartment k (k = 1…9) is described by functions g and h, respectively. These functions, which are different for the supine and upright positions and yield the fractions for SV and VT listed in Table 2, are given by
and
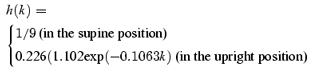 |
Each lung compartment's share of FRC, Vcap and VD is given by the weight function
which yields the fractions for FRC and Vcap listed in Table 2.
Venous CO2
For each breath n, the venous CO2 content ([CO2]v,n) is calculated from its previous value [CO2]v,n-1 according to eqns (1)–(4). The amount of CO2 in the venous compartment increases by the amount that arrives from the arterial compartment (A) and the amount created by the basal metabolism (B), and decreases by the amount that leaves the compartment (C). Thus, we have
| (1) |
where
| (2) |
| (3) |
with [CO2]a denoting the arterial CO2 content, and
| (4) |
where V̇O2,n is the oxygen extraction for breath n (in ml min−1) and RQ is the respiratory quotient, which is set at 0.9 (the average as approximated from subject data, by dividing Vco2by V̇O2). The term is multiplied by the breath duration (in min) (Tresp,n/60) to estimate the CO2 produced per breath.
Arterial CO2
The arterial blood CO2 content for breath n ([CO2]a,n) is calculated from its previous value [CO2]a,n-1 according to eqns (5)–(7). The amount of CO2 in the arterial compartment increases by the amount of CO2 arriving from the lungs (D) and decreases by the amount of CO2 leaving the arterial compartment (E)
| (5) |
The amount D can be estimated from the end-tidal partial CO2 pressure in each lung compartment k (PkCO2k = 1…9) through
| (6) |
Where f is the above function that relates blood CO2 content to the blood partial CO2 pressure and g is the above function that defines the distribution of SV over the nine lung compartments. The amount E is given by
| (7) |
Lung CO2
The PCO2 of blood draining the lungs (PtcCO2) is dependent on the gravity-induced perfusion and ventilation gradients, as described by the above functions g and h. For each breath, the PCO2 in each lung segment k (PkCO2,n) is calculated according to eqns (8)–(13). At FRC, the amount of CO2 in lung segment k (F) is determined by the CO2 content in the lung capillaries, in the FRC and in the VD
| (8) |
with the weight function w and conversion factor c as described above. The contribution of CO2 in dead space (the right-most term) is computed noting that end-tidal air from the previous breath is returned to the lungs from dead space. The amount of CO2 carried to the lungs from the venous compartment (G) is given by
| (9) |
The ratio a of [CO2] in blood and [CO2] in air is approximated from the previous breath, n– 1, according to
| (10) |
The ratio b of the end-tidal amount of CO2 in air and the total amount of CO2 is given by
| (11) |
The end-tidal [CO2] in each lung compartment k is determined by the total amount of CO2 (F+G), which is distributed over air and blood with ratio b, and the end-tidal volume of air in compartment k
| (12) |
A simple conversion using the above constant c then yields PkCO2,n. The PETCO2 depends on the distribution of tidal volume, which is given by the fraction h(k),k = 1..9, and differs between the supine and the standing position, and is computed as
| (13) |
Acknowledgments
This study was partly supported by Space Research Organization Netherlands (SRON) project MG-052. We thank Professor G. Kim Prisk for his critical evaluation of the model.
References
- Anthonisen NR, Milic-Emili J. Distribution of pulmonary perfusion in erect man. J Appl Physiol. 1966;21:760–766. doi: 10.1152/jappl.1966.21.3.760. [DOI] [PubMed] [Google Scholar]
- Birch AA, Dirnhuber MJ, Hartley-Davies R, Iannotti F, Neil-Dwyer G. Assessment of autoregulation by means of periodic changes in blood pressure. Stroke. 1995;26:834–837. doi: 10.1161/01.str.26.5.834. [DOI] [PubMed] [Google Scholar]
- Bjurstedt H, Hesser CM, Liljestrand G, Matell G. Effects of posture on alveolar-arterial CO2 and O2 differences and on alveolar dead space in man. Acta Physiol Scand. 1962;54:65–82. doi: 10.1111/j.1748-1716.1962.tb02329.x. [DOI] [PubMed] [Google Scholar]
- Blumenthal SR, Voorhees WD. The relationship between airway carbon dioxide excretion and cardiac output during cardiopulmonary resuscitation. Resuscitation. 1997;34:263–270. doi: 10.1016/s0300-9572(96)01076-3. [DOI] [PubMed] [Google Scholar]
- Bryan AC, Milic-Emili J, Pengelly D. Effect of gravity on the distribution of pulmonary ventilation. J Appl Physiol. 1966;21:778–784. doi: 10.1152/jappl.1966.21.3.778. [DOI] [PubMed] [Google Scholar]
- Burton AC. Physiology and Biophysics of the Circulation. Year Book. Chicago: Medical Publishers; 1972. [Google Scholar]
- Cencetti S, Bandinelli G, Lagi A. Effect of PCO2 changes induced by head-upright tilt on transcranial Doppler recordings. Stroke. 1997;28:1195–1197. doi: 10.1161/01.str.28.6.1195. [DOI] [PubMed] [Google Scholar]
- Edwards MR, Shoemaker JK, Hughson RL. Dynamic modulation of cerebrovascular resistance as an index of autoregulation under tilt and controlled PETCO2. Am J Physiol Regul Integr Comp Physiol. 2002;283:R653–R662. doi: 10.1152/ajpregu.00452.2001. [DOI] [PubMed] [Google Scholar]
- Gabrielsen A, Videbaek R, Schou M, Damgaard M, Kastrup J, Norsk P. Non-invasive measurement of cardiac output in heart failure patients using a new foreign gas rebreathing technique. Clin Sci (Lond) 2002;102:247–252. [PubMed] [Google Scholar]
- Harms MP, Colier WN, Wieling W, Lenders JW, Secher NH, van Lieshout JJ. Orthostatic tolerance, cerebral oxygenation, and blood velocity in humans with sympathetic failure. Stroke. 2000;31:1608–1614. doi: 10.1161/01.str.31.7.1608. [DOI] [PubMed] [Google Scholar]
- Harms MP, Wesseling KH, Pott F, Jenstrup M, Goudoever J, Secher NH, van Lieshout JJ. Continuous stroke volume monitoring by modelling flow from non-invasive measurement of arterial pressure in humans under orthostatic stress. Clin Sci (Lond) 1999;9:291–301. [PubMed] [Google Scholar]
- Hart MC, Orzalesi MM, Cook CD. Relation between anatomic respiratory dead space and body size and lung volume. J Appl Physiol. 1963;18:519–522. doi: 10.1152/jappl.1963.18.3.519. [DOI] [PubMed] [Google Scholar]
- Hitchcock FA, Ferguson JKW. Respiratory and circulatory adjustments to the erect posture. Am J Physiol. 1938;12:457–465. [Google Scholar]
- Hughson RL, Edwards MR, O'Leary DD, Shoemaker JK. Critical analysis of cerebrovascular autoregulation during repeated head-up tilt. Stroke. 2001;32:2403–2408. doi: 10.1161/hs1001.097225. [DOI] [PubMed] [Google Scholar]
- Jellema WT, Wesseling KH, Groeneveld AB, Stoutenbeek CP, Thijs LG, van Lieshout JJ. Continuous cardiac output in septic shock by simulating a model of the aortic input impedance: a comparison with bolus injection thermodilution. Anesthesiology. 1999;90:1317–1328. doi: 10.1097/00000542-199905000-00016. [DOI] [PubMed] [Google Scholar]
- Kelman GR. Digital computer procedure for the conversion of PCO2 into blood CO2 content. Respir Physiol. 1967;3:111–115. doi: 10.1016/0034-5687(67)90028-x. [DOI] [PubMed] [Google Scholar]
- van Lieshout JJ, Pott F, Madsen PL, van Goudoever J, Secher NH. Muscle tensing during standing: effects on cerebral tissue oxygenation and cerebral artery blood velocity. Stroke. 2001;32:1546–1551. doi: 10.1161/01.str.32.7.1546. [DOI] [PubMed] [Google Scholar]
- Lilijestrand G, Wollin G. Einfluss der Körperstellung auf die Zusammensetzung der Alveolarluft des Menschen. Zentralbl F Physiol. 1914;27:1268–1270. [Google Scholar]
- Main RJ. Alterations of alveolar CO2 in man accompanying postural change. Am J Physiol. 1937;118:435–440. [Google Scholar]
- Milic-Emili J, Henderson JA, Dolovich MB, Trop D, Kaneko K. Regional distribution of inspired gas in the lung. J Appl Physiol. 1966;21:749–759. doi: 10.1152/jappl.1966.21.3.749. [DOI] [PubMed] [Google Scholar]
- Musch G, Layfield JD, Harris RS, Melo MF, Winkler T, Callahan RJ, Fischman AJ, Venegas JG. Topographical distribution of pulmonary perfusion and ventilation, assessed by PET in supine and prone humans. J Appl Physiol. 2002;93:1841–1851. doi: 10.1152/japplphysiol.00223.2002. [DOI] [PubMed] [Google Scholar]
- Novak V, Spies JM, Novak P, McPhee BR, Rummans TA, Low PA. Hypocapnia and cerebral hypoperfusion in orthostatic intolerance. Stroke. 1998;29:1876–1881. doi: 10.1161/01.str.29.9.1876. [DOI] [PubMed] [Google Scholar]
- Rea HH, Withy SJ, Seelye ER, Harris EA. The effects of posture on venous admixture and respiratory dead space in health. Am Rev Respir Dis. 1977;115:571–580. doi: 10.1164/arrd.1977.115.4.571. [DOI] [PubMed] [Google Scholar]
- Shibutani K, Muraoka M, Shirasaki S, Kubal K, Sanchala VT, Gupte P. Do changes in end-tidal PCO2 quantitatively reflect changes in cardiac output. Anesth Analg. 1994;79:829–833. doi: 10.1213/00000539-199411000-00002. [DOI] [PubMed] [Google Scholar]
- Stead EA, Jr, Warren JV, Merrill AJ, Brannon ES. The cardiac output in male subjects as measured by the technique of right atrial catherization. Normal values with observations on the effect of anxiety and tilting. J Clin Invest. 1944;24:326–331. doi: 10.1172/JCI101609. [DOI] [PMC free article] [PubMed] [Google Scholar]
- West JB. Regional differences in gas exchange in the lung of erect man. J Appl Physiol. 1962;17:893–898. doi: 10.1152/jappl.1962.17.6.893. [DOI] [PubMed] [Google Scholar]
- West JB, Dollery CT. Distribution of blood flow and ventilation-perfusion ratio in the lung, measured with radioactive CO2. J Appl Physiol. 1959;15:405–410. doi: 10.1152/jappl.1960.15.3.405. [DOI] [PubMed] [Google Scholar]
- West JB, Dollery CT, Naimark A. Distribution of blood flow in isolated lung; relation to vascular and alveolar pressures. J Appl Physiol. 1963;19:713–724. doi: 10.1152/jappl.1964.19.4.713. [DOI] [PubMed] [Google Scholar]
- Zardini P, West JB. Topographical distribution of ventilation in isolated lung. J Appl Physiol. 1966;21:794–802. doi: 10.1152/jappl.1966.21.3.794. [DOI] [PubMed] [Google Scholar]