Abstract
Paramyotonia congenita (PC) is a dominantly inherited skeletal muscle disorder caused by missense mutations in the SCN4A gene encoding the pore-forming α subunit (hSkM1) of the skeletal muscle Na+ channel. Muscle stiffness is the predominant clinical symptom. It is usually induced by exposure to cold and is aggravated by exercise. The most prevalent PC mutations occur at T1313 on DIII–DIV linker, and at R1448 on DIV–S4 of the α subunit. Only one substitution has been described at T1313 (T1313M), whereas four distinct amino-acid substitutions were found at R1448 (R1448C/H/P/S). We report herein a novel mutation at position 1313 (T1313A) associated with a typical phenotype of PC. We stably expressed T1313A or wild-type (hSkM1) channels in HEK293 cells, and performed a detailed study on mutant channel gating defects using the whole-cell configuration of the patch-clamp technique. T1313A mutation impaired Na+ channel fast inactivation: it slowed and reduced the voltage sensitivity of the kinetics, accelerated the recovery, and decreased the voltage-dependence of the steady state. Slow inactivation was slightly enhanced by the T1313A mutation: the voltage dependence was shifted toward hyperpolarization and its steepness was reduced compared to wild-type. Deactivation from the open state assessed by the tail current decay was only slowed at positive potentials. This may be an indirect consequence of disrupted fast inactivation. Deactivation from the inactivation state was hastened. The T1313A mutation did not modify the temperature sensitivity of the Na+ channel per se. However, gating kinetics of the mutant channels were further slowed with cooling, and reached levels that may represent the threshold for myotonia. In conclusion, our results confirm the role of T1313 residue in Na+ channel fast inactivation, and unveil subtle changes in other gating processes that may influence the clinical phenotype.
Paramyotonia congenita (PC) is an inherited disorder of muscle excitability caused by allelic missense mutations in the α subunit of the skeletal muscle voltage-gated Na+ channel (hSkM1) (McClatchey et al. 1992; Ptacek et al. 1992; Plassart & Fontaine, 1994). It is clinically characterized by attacks of muscle stiffness mainly triggered by exposure to cold and aggravated by exercise. Although myotonic stiffness is the major clinical symptom of PC, episodes of muscle weakness may also occur sporadically (Plassart et al. 1996; Ptacek, 1998). Repetitive firing generated by myotonic muscles in response to a single synaptic signal has been ascribed to a prolonged Na+ influx through defective mutant channels (Lehmann-Horn et al. 1981; Lehmann-Horn & Rudel, 1996). Functional studies using heterologous expression systems have clearly established that PC-associated mutations mostly disrupt Na+ channel fast inactivation (Chahine et al. 1994; Yang et al. 1994; Hayward et al. 1996). Nonetheless, more recent investigations have disclosed other gating defects in PC mutant channels, such as slowed deactivation (Featherstone et al. 1998; Groome et al. 1999).
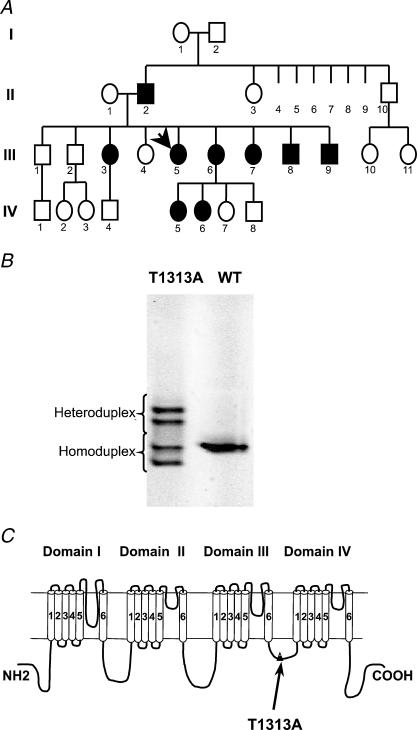
The voltage-dependent Na+ channel in skeletal muscle is a heterodimer consisting of a pore-forming α subunit and a regulatory β1 subunit (Barchi, 1983; Catterall, 2000). The α subunit consists of four homologous domains DI–DIV, each containing six transmembrane segments (Fig. 1C) (Noda et al. 1984). The most prevalent mutations associated with PC are located in DIII–DIV linker (T1313M) and in DIV–S4 segment (R1448C/H/P/S) (Ptacek, 1998; Cannon, 2000).
Figure 1. Genetic evidence of T1313A mutation.
A, pedigree structure of the T1313A proband (arrow). PC Affected members are indicated by filled symbols. B, gel obtained by denaturing gradient gel electrophoreses (DDGE) analysis of PCR amplified SCN4A exon 22 showing a variant profile. Subsequent sequencing of exon 22 identified a G to A transition at nucleotide 3937 predicting T1313A mutation in the α subunit. C, topology of the α subunit of the skeletal muscle Na+ channel showing the location of T1313A mutation in the DIII–DIV linker.
In the present study, we report a novel mutation at threonine 1313 (T1313A) on DIII–DIV linker causing paramyotonia congenita. T1313 residue is located next to the COOH-terminal end of the IFM motif, which is thought to serve as an inactivation particle that blocks the pore during fast inactivation (Eaholtz et al. 1994). Substitution of this threonine by methionine was shown to disrupt fast inactivation in both skeletal muscle (T1313M) and brain Na+ channels (T1491M) (Yang et al. 1994; Hayward et al. 1996; Kellenberger et al. 1997). Other gating properties of T1313M mutant channels such as slow inactivation and deactivation do not seem to be significantly altered (Hayward et al. 1997; Richmond et al. 1997). To define the functional consequences of threonine to alanine substitution, we expressed T1313A mutant channels or their wild-type (WT) counterpart in HEK293 cells, and recorded whole cell Na+ currents with the patch-clamp technique. We performed an extensive study on T1313A mutant channel gating behaviour, and examined the changes induced by a 10°C decrease in the temperature. The results show a clear impairment of fast inactivation and unveil subtle changes in both slow inactivation and deactivation, extending thereby our understanding of the role of T1313 residue. They also provide some hints about the mechanisms underlying cold-induced attacks of myotonia
Methods
Evaluation of patients
The index-case patient is a 42-year-old French woman who belongs to a large family with several affected members as depicted in the pedigree structure shown in Fig. 1A. This patient suffered since early childhood from episodic attacks of muscle stiffness mainly triggered by exposure to cold. She also reported a few episodes of paresis triggered by exposure to cold or strenuous exercise. Clinical examination of this patient disclosed spontaneous myotonia of the hand and the eyelids but no permanent weakness. Clinical studies and sampling of family members were subject to informed consent in accordance with the Declaration of Helsinki and French law.
Mutation screening
DNA was extracted from blood samples by a classical phenol–chloroform protocol or a rapid procedure using Quiagen DNA Minikit. Primers used to amplify the SCN4A exon 22 and intron–exon boundaries were as follows: 5′-TGG AGG CAG GAA GGG GAA CT-3′ (forward primer) and 5′-GGC AGC ACA CAC AGG ACA GG-3′ (reverse primer). The melting behaviour of the PCR product was analysed by means of the MELT87 program (Lerman, 1987). This showed that this fragment was suitable for denaturing gradient gel electrophoreses (DGGE) analysis. Optimal experimental conditions (i.e. denaturing gradient, voltage, time length) to discriminate heteroduplexes from homoduplexes were determined for each selected fragment by means of the SQHTX program (Lerman, 1987). Denaturing gradient gel electrophoreses were run in a Tris–EDTA–acetate buffer (TEA: Tris 40 mm; sodium acetate 20 mm; EDTA 1 mm), at 60°C, using a 6% polyacrylamide gel containing a 10–60% gradient of denaturing agents (100% denaturant is 7 m urea, and 40% formamide). The gels were stained in ethidium bromide, and examined under UV light. When a variant profile was detected, a direct sequencing of the exon 22 region was performed to identify the underlying sequence variation. A G to A transition was found at position 3937 in the patient's DNA fragment predicting an amino acid substitution of threonine 1313 by alanine in the sodium channel α subunit.
Construction of the T1313A recombinant
Site directed mutagenesis of the WT SCN4A cDNA (George et al. 1992) was performed using the Quickchange site-directed mutagenesis kit (Stratagene, La Jolla, CA, USA). The SCN4A gene was inserted into the pRc/CMV plasmid between the NotI and the XbaI restriction sites of the polylinker. The two synthetic oligonucleotide primers containing the T1313A mutation were as follows, with the mutation indicated by underlined characters.
5′-GACATCTTTATGGCGGAGGAACAGAAG-3′
5′-CTTCTGTTCCTCCGCCATAAAGATGTC-3′
Each oligonucleotide primer, complementary to opposite strands of the vector, was extended during temperature cycling by means of Pfu DNA polymerase. A mutated plasmid containing staggered nicks was generated, and treated by Dpnl. The nicked vector incorporating the T1313A mutation was then transformed into E. coli (XL10-gold ultra-competent cells). The absence of any alteration was assessed on 20 selected clones by digestion with SacI, BamHI and EcoRI restriction enzymes, before confirmation of the presence of the mutation by DNA sequencing of a surrounding 500 bp fragment of SCN4A. One of the positive clones was chosen, and the DNA sequence of the whole construct showed that it only differed from the WT by an oligonucleotide variant predicting T1313A mutation of the channel protein. Plasmid DNA for mammalian transfection was then prepared by adsorption to macroporous silica gel anion exchange column (Quiagen).
Stable expression of SCN4A in HEK293 cells
HEK293 (human embryonic kidney) cells were transfected with the plasmid construct containing either the WT human skeletal muscle sodium channel α-subunit or the T1313A mutant, using the calcium-phosphate precipitation method. Transfected cells were grown in culture medium containing 800 μg ml−1 of geneticin (Gibco/BRL, USA) to allow selection of expressing cells. Two weeks later, cell colonies were harvested and the expression of the Na+ channel was checked both by RT-PCR and electrophysiology. Only colonies uniformly expressing peak sodium currents between 1 and 2 nA were retained for later exploration. Stably expressing cells were then routinely grown at 37°C (5% CO2, 95% humidity) in Dulbecco's modified Eagle's medium supplemented with 10% fetal bovine serum and 250 μg ml−1 geneticin (Gibco/BRL, USA), to maintain the selection pressure. Electrophysiological recordings were performed on at least two different stably expressing T1313A HEK clones.
Whole-cell recording of Na+ currents and data analysis
Whole-cell currents (Hamill et al. 1981) were recorded using an EPC-7 patch-clamp amplifier (List-Medical, Germany). Standard whole-cell currents were filtered at 5 kHz through 8-pole low-pass Bessel filter (M900, Frequency Devices, MA, USA), and digitized at 20 or 50 μs intervals using the DigiData acquisition card (1200 A) and the pCLAMP (v8) software (Axon Instruments, CA, USA). Because of their fast kinetics, tail currents were acquired using the shortest sampling interval available (5 μs), and were processed with and without filtering to assess the most adequate filter corner frequency. In most cases, low pass filtering tail currents at 7 kHz improved the signal/noise ratio and preserved the kinetics. Satisfactory space clamp was facilitated by the choice of small isolated round cells (10–20 μm diameter). Electrophysiological recordings were considered for analysis only if the leakage current remained insignificant throughout the experiment (holding current < 0.1 nA at −100 mV). Capacitance and series resistance were compensated using the analogue circuitry of the amplifier. Series resistance was examined in the course of the experiment, and compensated at >80%. Consequently, the access resistance and voltage error computed from the present data did not exceed in average 3 MΩ and 3.5 mV, respectively. Residual leakage and capacity currents were automatically subtracted using a P/N protocol from a holding potential of –120 mV. The onset and the number (4–8) of hyperpolarizing subpulses, as well as the time between protocols were adjusted to ensure that the leak protocol did not alter the data. Standard recordings were carried out at room temperature between 20 and 22°C. In experiments involving the effect of cold, the bath was maintained either at 21°C or 11 ± 1°C using a water-based heater-cooler (Thermomix 1441 and Frigomix 1495, B. Braun Melsungen, Germany), together with a water circulation system and a home-made thermally conductive recording chamber. Temperature in the experimental bath was monitored throughout the experiment using a digital thermometer and two thermistors placed close to the recorded cell and at the edge of the dish (Eirelec Ltd, Ireland). Patch pipettes were pulled from borosilicate capillary glass (Drummond Scientific Co., Broomall, PA, USA) using a Sutter P-97 micropipette puller, and had a resistance between 2 and 2.5 MΩ when filled with the standard solution containing 130 mm CsCl, 2 mm MgCl2, 10 mm glucose and 10 mm½Na-Hepes (5 mm Na+ for 10 mm Hepes) (pH 7.4). Internal pipette solution was switched to fluoride-based solution (80 mm CsF, 35 mm NaCl, 10 mm EGTA, 24 mm CsOH and 10 mm Hepes (pH 7.4)) to prolong seal stability when long slow inactivation protocols were applied. The standard extracellular solution for recording Na+ currents contained 110 mm NaCl, 27 mm choline-Cl, 3 mm KCl, 2 mm MgCl2, 1 mm CaCl2, 10 mm glucose and 10 mm Hepes (pH 7.4). The osmolarity of all solutions was kept between 300 and 320 mosmol l−1. Unless otherwise mentioned all chemicals were purchased from Sigma. Whole-cell current analysis and data process were completed using a combination of pCLAMP 8.2, Excel (Microsoft) and Fig-P (Biosoft, Cambridge, UK) software. Data are expressed as means ±s.e.m. and statistical significance was obtained with Student's unpaired t test. Conductance was calculated from raw data using the equation G=I/(V−Erev), where I is the peak current at a given voltage V, and Erev the graphically extrapolated equilibrium potential. Conductance–voltage curves were fit to a Boltzmann distribution:
where G(V) is the sodium conductance at a given voltage V, Gmax the maximum conductance, V0.5 the voltage for half-activation, and k the slope factor. Steady-state fast and slow inactivation were fitted to the equation:
where I(V)/Imax is the current ratio, V is the test pulse voltage, and k the slope factor. The time constant for channel fast inactivation or deactivation was determined by fitting the traces with a single exponential function:
where I represents Na+ current intensity, Iresid the asymptotic residue, A the current amplitude at time zero, and τ the time constant. Data are expressed as means ±s.e.m. and statistical significance was determined by Student's unpaired t test with P values indicated in the text. The difference between two mean values was considered significant when P < 0.05.
Results
Voltage dependence of activation
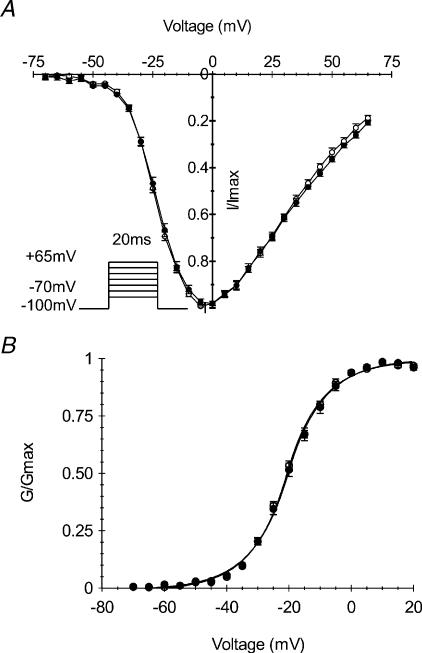
Voltage dependence of channel activation was characterized in HEK cells stably expressing T1313A α subunit of the human Na+ channel or the WT. Whole cell currents were elicited with a series of depolarizing steps of 20 ms duration ranging from −70 mV to +65 mV from a holding potential of −100 mV. Currents obtained at different voltages were normalized to the maximal amplitude for each experiment, and averaged for T1313A (n= 11) and WT (n= 10). The scaled current–voltage (Fig. 2A) and conductance–voltage curves (Fig. 2B) obtained for mutant and WT are clearly superimposable indicating that T1313A mutation did not induce any change in the voltage dependence of channel activation. G–V curves were fit to a standard Boltzmann distribution (see material and methods) with no significant difference between the V0.5 values (−20.9 ± 0.8 mV and −21.8 ± 0.5 mV) or the slope factors (8.9 ± 0.2 and 8.5 ± 0.2) obtained for the mutant and WT, respectively. Mean values of the reversal potential obtained for the T1313A mutant and WT were not statistically different (81.02 ± 1.06 mV and 81.30 ± 0.93 mV, respectively) and were both close to the Nernst value of −77.8 mV.
Figure 2. Voltage dependence of Na+ channel activation.
Normalized current to voltage (A) and conductance to voltage (B) relationships obtained from HEK cells expressing either T1313A (•n= 11) or WT (○n= 10) Na+ channels. Whole-cell currents were elicited by a series of 20 ms pulses to various voltages ranging from −70 to +65 mV from a holding potential of −100 mV. The continuous lines in B represent Boltzmann fits of the data (V0.5: −20.9 ± 0.8 mV and −21.8 ± 0.5 mV, k: 8.9 ± 0.2 and 8.5 ± 0.2 for T1313A and WT channels, respectively).
Kinetics and voltage dependence of fast inactivation
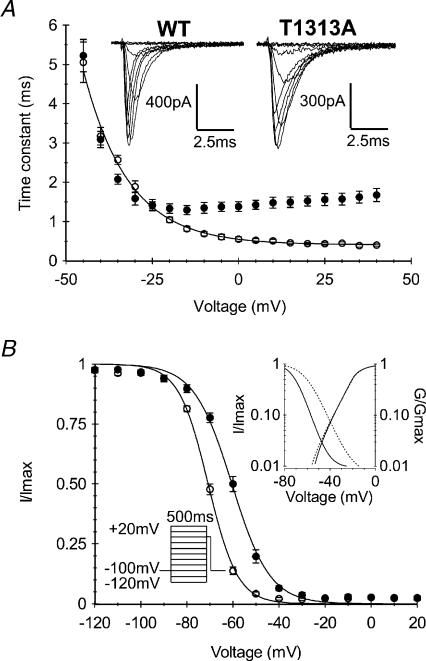
The T1313A mutation is located in DIII–DIV linker, a region of the sodium channel highly implicated in fast inactivation (West et al. 1992). It is also clearly established that a majority of PC-associated mutations slow down the rate and alter the voltage dependence of Na+ channel fast inactivation. As shown in Fig. 3A, current decay during the 20 ms depolarizing step was slower for T1313A mutant channels compared with WT. The fast inactivation time constant (τh) obtained by fitting the current decay with a single exponential was increased 2- to 4-fold at potentials positive to −10 mV (Fig. 3A). For example, the mean value ±s.e.m. of the time constant obtained at 0 mV for T1313A was 2.4-fold larger (1.35 ± 0.07 ms, n= 11) than the WT (0.56 ± 0.03 ms n= 10, P < 0.001). Besides slowing down channel fast inactivation rate, the T1313A mutation altered the voltage dependence of τh between −20 and +40 mV. Over this range, WT channels show ∼2.5-fold decrease in τh as the voltage increased whereas T1313A mutant channel show a slight increase (∼10%) in this parameter. Hence, τh had a minimum value at −20 mV for the mutant, and at +40 mV for the WT. Nevertheless, inactivation was complete at the end of the 20 ms pulse for both mutant and WT, and no larger sustained current could be observed in T1313A mutant.
Figure 3. Voltage dependence and kinetics of fast inactivation.
A, representative traces of whole cell Na+ currents, and voltage dependence of the fast inactivation time constant obtained from monoexponential fitting of the current decay during a 20 ms depolarizing pulse. Note the slower inactivation kinetics of T1313A channels (•n= 11) compared with WT (○n= 10), and the reduced voltage sensitivity at potentials positive to −20 mV. B, voltage dependence of steady-state fast-inactivation for T1313A (•n= 7) and WT (○n= 12) channels measured with a double pulse protocol as illustrated in the left inset. The right inset shows both activation and inactivation curves on a logarithmic scale to highlight the window current. Note the enlargement of the window current at positive potentials induced by T1313A mutation.
Na+ channel steady-state fast inactivation was induced by 500 ms prepulses ranging from −120 to +20 mV, followed by a 20 ms test pulse to −10 mV. The T1313A mutation shifted the voltage dependence of steady-state fast inactivation by about 10 mV toward depolarization. The mean values of V0.5 obtained from fitting the steady state inactivation curves with a Boltzmann function were −60.5 ± 0.78 mV (n= 7) and −71.0 ± 0.6 mV (n= 12) for mutant and WT, respectively (P < 0.001). In addition, the T1313A mutation reduced slightly the steepness of the voltage dependence of fast inactivation, yielding a slope factor of 8.2 ± 0.5 as opposed to 6.4 ± 0.3 for the WT (Fig. 3B). These changes in steady state inactivation resulted in an enlargement of the window current as shown in the inset of Fig. 3B.
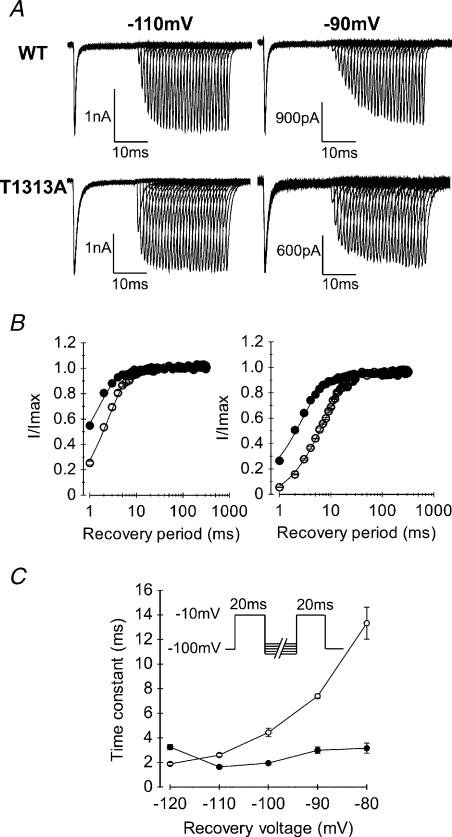
Recovery of Na+ channels from fast inactivation was measured in T1313A or WT expressing HEK cells using a two-pulse protocol. A first pulse at −10 mV was applied for 20 ms to fully inactivate the channels, followed by increasing periods (1−320 ms) of repolarization to various potentials (from −110 to −80 mV), before a second pulse at −10 mV was applied to measure the fraction of current recovered. Shorter interpulse intervals ranging 0.05–1 ms were also applied to better resolve the initial phase of current recovery at the most negative potentials (−110, −120 mV). Recovery (fraction of current recovered versus repolarizing times) was best fitted with a single exponential. As illustrated in Fig. 4, T1313A mutation accelerated the recovery from fast inactivation as indicated from the significant decrease in the recovery time constant for T1313A channels compared with the WT (Fig. 4C). In addition, T1313A reduced drastically the voltage dependence of this parameter leading to more pronounced differences in the recovery rates between WT and mutant at more positive voltages.
Figure 4. Recovery from fast inactivation.
A, representative traces of WT and T1313A currents obtained for recovery interpulse potentials of −110 or −90 mV using the two-pulse protocol shown in C (inset). Note the faster recovery of T1313A channels compared to WT at both voltages. B, kinetics of recovery from fast inactivation obtained at recovery potentials of −110 mV (left, • T1313A n= 9, and ○ WT n= 7), and −90 mV (right, • T1313A n= 7, and ○ WT n= 5). C, voltage dependence of the recovery time constants obtained by fitting successive peaks of the recovered currents with single exponential functions. In contrast to the WT (○n= 5–8), T1313A mutant channels (•n= 6–9) recovery from fast inactivation does not change significantly with the repolarizing voltage.
Voltage dependence and kinetics of slow inactivation
Skeletal muscle sodium channels can be shut by two distinct inactivation processes, i.e. fast and slow inactivation (Rudy, 1978; Vedantham & Cannon, 1998). Fast inactivation operates on a millisecond time scale, and contributes therefore to the repolarizing phase of the action potential. Slow inactivation requires tens of seconds of membrane depolarization and is thought to regulate sodium channel availability as a function of the resting membrane potential (Chandler & Meves, 1970; Almers et al. 1984; Ruff et al. 1988). Previous studies have provided evidence for significant changes of slow inactivation in a number of sodium channelopathies, especially those associated with prominant muscle weakness (Cummins & Sigworth, 1996; Hayward et al. 1997; Hayward et al. 1999; Jurkat-Rott et al. 2000; Struyk et al. 2000; Bendahhou et al. 2002). Yet, enhancement of slow inactivation has been reported in a Na+ channel mutation causing myotonia without weakness (Takahashi & Cannon, 1999).
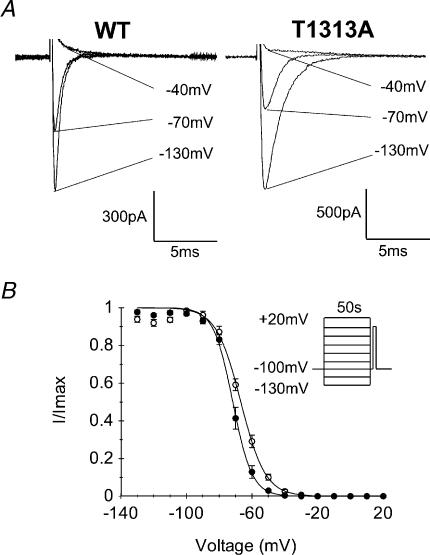
Steady-state slow inactivation was induced by 50 s prepulse potentials ranging from −130 to +20 mV, followed successively by a brief (20 ms) repolarization at −100 mV to allow selective recovery from fast inactivation, and a test pulse of −10 mV for 20 ms to evaluate the fraction of slow inactivated channels. To prevent accumulation of slow inactivation, the membrane was held at −100 mV for 50 s between successive prepulses. Steady-state slow inactivation curves (s∞) obtained from the T1313A mutant and WT channels are shown in Fig. 5. Both s∞ curves were fitted to a Boltzmann equation (see Methods). Comparison of the mean values of V0.5 between T1313A (−70.7 ± 1.3 mV, n= 7) and WT (−66.9 ± 1.1 mV, n= 6), showed a statistically significant (P < 0.05) shift of ∼4 mV toward hyperpolarization in the voltage dependence of slow inactivation in mutant channels. There was also a decrease in the slope factor for T1313A mutant (5.5 ± 0.5) compared to the WT (7.4 ± 0.3) (P < 0.01), indicating an enhanced voltage sensitivity of slow inactivation for the mutant.
Figure 5. Voltage dependence of slow inactivation.
A, representative traces showing the gradual decrease in peak Na+ current following long lasting (50 s) conditioning pulses at −130 mV, −70 mV and −40 mV in WT and T1313A mutant (capacitive currents were blanked). B, steady-state slow inactivation curves obtained using the two-pulse protocol shown as inset. Cells were maintained at the holding potential (−100 mV) for 50 s between each conditioning pulse to prevent accumulation of slow inactivation, and repolarized at −100 mV for 20 ms between the conditioning and the test pulse to allow Na+ channel recovery from fast inactivation. Data obtained from both WT and T1313A channels could be fitted to the Boltzmann equation as symbolized by the continuous lines. Notice the slight shift toward hyperpolarization in the voltage dependence of slow inactivation for T1313A (•n= 7) channels compared with WT (○n= 6).
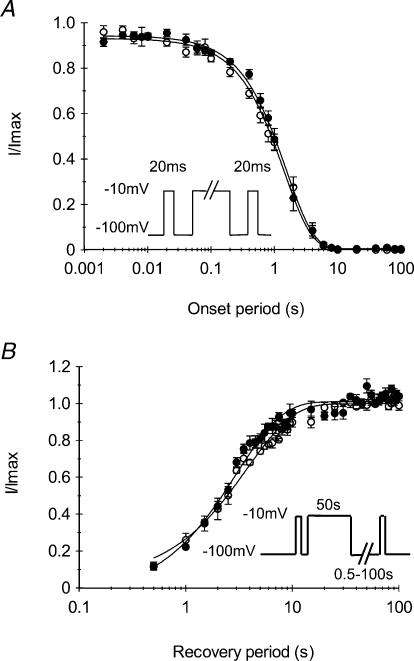
The kinetics of entry to slow inactivation were measured using the three-pulse protocol shown in Fig. 6A. A reference pulse of −10 mV was applied for 20 ms, followed successively by a conditioning pulse of increasing durations (from 0.002 to 100 s) to induce slow inactivation, and a test pulse to evaluate the fraction of slow inactivated channel. Between the conditioning and the test pulse the membrane was repolarized to −100 mV for 20 ms to allow selective recovery from fast inactivation. Figure 6A shows the changes in the fraction of available channels, i.e. the ratio of the peak current evoked by the test pulse to that evoked by the reference pulse, as a function of the conditioning pulse duration. The curves obtained from both T1313A mutant or WT channels were readily fitted with a single exponential function. The mean values of the time constant of entry to slow inactivation obtained for the mutant (1.60 ± 0.01 s, n= 5) was not significantly different from that obtained from the WT (1.44 ± 0.06 s, n= 5). Thus, T1313A mutation did not modify the rate of entry of the Na+ channel into slow inactivation.
Figure 6. Kinetics of slow inactivation.
A, to measure the entry to slow inactivation, a reference pulse of −10 mV was applied for 20 ms followed by a conditioning pulse to −10 mV of increasing durations (0.02–100 s) and a test pulse to evaluate the fraction of slow inactivated channels. Between the conditioning and the test pulse the membrane was repolarized to −100 mV for 20 ms to allow selective recovery from fast inactivation. Current amplitudes elicited by the test pulse were normalized to the peak current evoked by the reference pulse, and plotted against the conditioning pulse duration to yield the time constant of entry to slow inactivation. As indicated by the superimposed data from mutant (•n= 5) and WT (○n= 5) channels, T1313A mutation did not modify the entry of Na+ channels to slow inactivation. B, recovery from slow inactivation was measured using the protocol shown next to the curves. Slow inactivation was induced by 50 s pulses, and recovery periods at −100 mV ranged from 0.5 to 100 s. The curves depicting the fraction of recovered currents against the recovery periods do not show any difference between WT (○n= 5) and T1313A (•n= 5) channels.
Recovery from slow inactivation of T1313A mutant channels was also compared to that of the WT. Channels were slow inactivated by 50 s membrane depolarization to −10 mV and then allowed to recover at −100 mV for varying periods ranging from 0.5 to 100 ms. This sequence was preceded and followed by a pulse to −10 mV for 20 ms, in order to evaluate the fraction of Na+ channels that had recovered from slow inactivation. Figure 6B summarizes the results obtained from T1313A mutant channels (n= 5) and from the WT (n= 5). The kinetics of recovery from slow inactivation were calculated from the exponential fitting of the curves representing the fraction of recovered current versus the repolarization period. The mean values of the recovery time constant obtained for T1313A mutant channels (3.05 ± 0.22 s) and WT (3.85 ± 0.31 s) were not significantly different, indicating that this mutation does not alter Na+ channel recovery from slow inactivation.
Open and inactivated states deactivation
Different studies have shown that PC-associated mutations can decrease the rate of channel deactivation leading to larger Na+ tail current that can oppose membrane repolarization during the action potential, and contribute therefore to membrane hyperexcitability (Featherstone et al. 1998; Bendahhou et al. 1999). In addition, the extent of this deactivation defect seems to correlate with the severity of the disease (Featherstone et al. 1998).
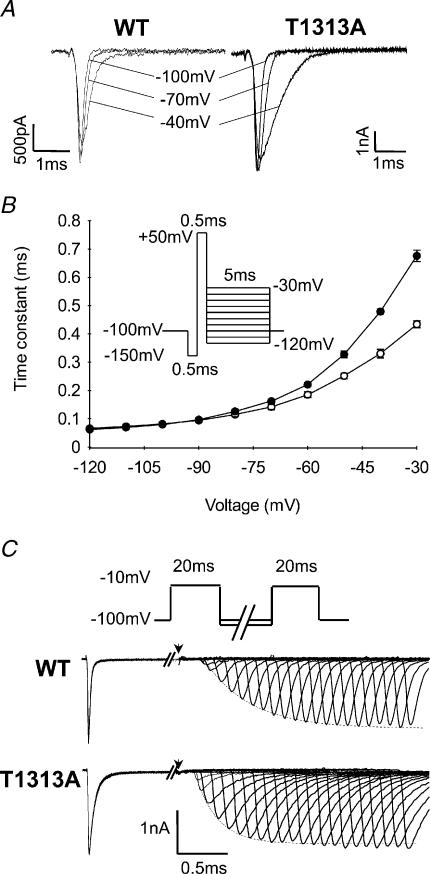
Deactivation kinetics were measured from both the open and the inactivated state. To measure open state deactivation, cells were first held at −150 mV to allow full Na+ channel recovery from inactivation, then depolarized to +50 mV for 0.5 ms to trigger channel opening, and finally repolarized to various potentials (from −30 mV to −120 mV) to elicit tail currents from which deactivation kinetics can be analysed (Fig. 7A).
Figure 7. Deactivation from open and inactivated states.
A, representative traces of tail currents reflecting deactivation of Na+ channels from the open state. Tail currents were elicited by 5 ms repolarizing steps following a brief depolarization (0.5 ms) to +50 mV, as illustrated by the protocol in B. B, kinetics of the tail current at various voltages represented by the time constant of the monoexponential tail decay for T1313A (•n= 12) and WT (○n= 6) channels. Note that the slight slowing of the tail current decay of T1313A channels, as compared to the WT, is only observed at potentials positive to −60 mV. C, deactivation from the inactivated state was assessed by the delay in onset to recovery from fast inactivation. Recovery periods ranged from 0.05 to 11 ms. Below the standard two-pulse protocol are shown traces of recovered Na+ currents following membrane repolarization at −100 mV. The arrows indicate the end of the first depolarizing pulse. Note the shorter delay in onset to recovery for the mutant compared with WT.
For both T1313A and WT mutant channels, tail current decays could be fitted with single exponentials, yielding the time constants of channel deactivation (τD) plotted in Fig. 7B. The results showed a slight but significant slowing of the tail current decay for T1313A channels compared with WT. However, this change was only observed for potentials positive to −60 mV, and may therefore reflect alterations of fast inactivation rather than deactivation. Indeed, studies on IFM1303QQQ fast inactivation-removed Na+ channels have shown that the voltage range over which tail current decay reflects deactivation, as opposed to fast inactivation, is negative to −60 mV (Featherstone et al. 1998). Since at negative potentials between −70 and −120 mV, there was no significant difference in the tail current decay time constants between WT and mutant, one can assume that the T1313A mutation did not alter Na+ channel deactivation from the open state.
Analogous to the coupling between Na+ channel activation and inactivation, recovery from inactivation is coupled to channel deactivation (Patlak, 1991; Kuo & Bean, 1994; Groome et al. 2000). With the exception of a few specific cases (Raman & Bean, 1997), Na+ channels must deactivate before they recover from inactivation, ensuring thereby very little leak current during recovery. At the macroscopic level, channel recovery from fast inactivation is preceded by a delay that is steeply voltage dependent, becoming shorter with increasing hyperpolarization. This delay in the onset to recovery from fast inactivation reflects channel deactivation kinetics from the inactivated state. We studied this characteristic in cells expressing either T1313A or WT channels using two successive pulses to −10 mV separated by recovery periods with varying durations (from 0.05 to 11 ms) at −100 and −120 mV. The delay in onset to recovery was determined by measuring the zero current intercept from a single exponential function fitted to the recovered peak current intensity. As illustrated in Fig. 7C, the delay in onset to recovery was shorter for T1313A mutant channels compared with WT. This decrease in the delay was observed for both recovery potentials tested, yielding mean values ±s.e.m. for T1313A mutant and WT channels of 0.28 ± 0.02 ms (n= 5) and 0.42 ± 0.06 ms (n= 7) at −100 mV (P < 0.01), and 0.20 ± 0.02 ms (n= 6) and 0.31 ± 0.02 ms (n= 8) (P < 0.001) at −120 mV, respectively.
Effect of decreasing temperature on fast inactivation and deactivation kinetics
Like other PC-associated Na+ channel mutations, the T1313A is characterized by cold-induced muscle stiffness. The molecular mechanisms underlying the temperature sensitivity of this muscle disorder are not well understood, most likely because too few studies have addressed this question. Nevertheless, a decrease in temperature is known to slow down Na+ channel kinetics and reduce the number of excitable Na+ channels through hyperpolarizing shifts in slow inactivation (Ruff, 1999). It is worth noting that, up to now, a direct effect of the PC mutations on the temperature sensitivity of the Na+ channels per se has not been found (Yang et al. 1994; Mohammadi et al. 2003).
In the present study, we focused on the effect of cold on the kinetics of channel fast inactivation and deactivation from the open state. Appropriate recordings were performed at 11°C from HEK cells expressing either WT or T1313A channels, and were compared with those obtained at 21°C.
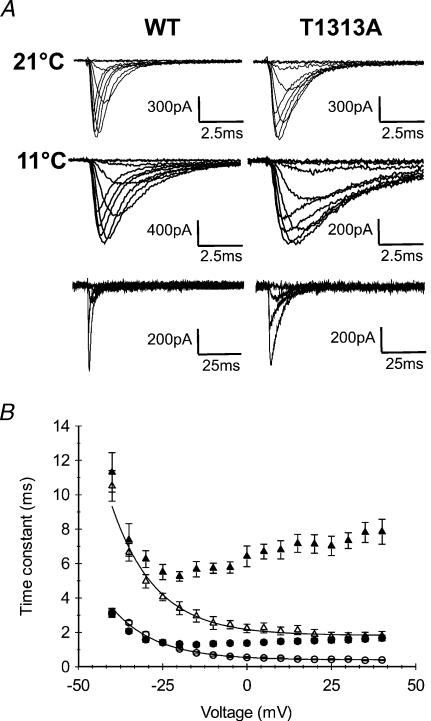
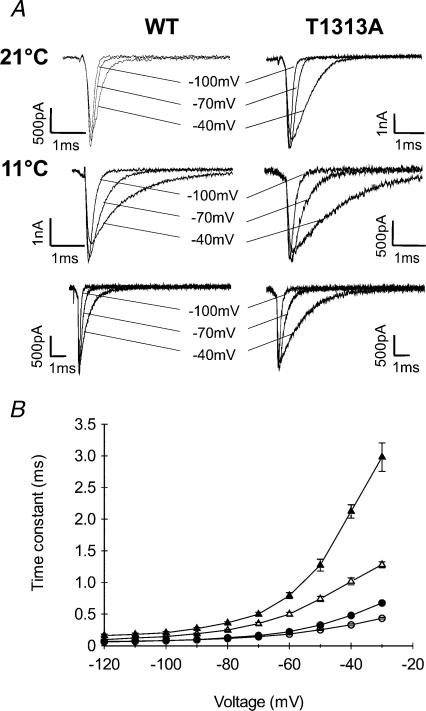
Because of the slower decay of Na+ currents with cooling, we applied a series of depolarizing pulses (from −70 to +40 mV) with longer durations (100 ms and 500 ms) to ensure accurate measurements of the fast inactivation time constant. Our results show a significant increase in τh at 11°C compared with 21°C for both T1313A mutant and WT (Fig. 8). The fast inactivation time constant increased about ∼3- to 5-fold with decreasing temperature from 21°C to 11°C in T1313A, and about ∼3- to 6-fold in WT channels, depending on membrane depolarization. This result does not support a direct effect of the mutation on the temperature sensitivity of the Na+ channel. An interesting observation was that mutant τh values obtained for potentials positive to −10 mV at 11°C were clearly out of the range delimited by those of the three other groups (WT at both temperatures and T1313A at 21°C).
Figure 8. Effect of 10°C cooling on fast inactivation kinetics.
A, superimposed Na+ currents recorded at 21°C (upper traces) or 11°C (middle and lower traces). Upper and middle traces were obtained using 20 ms depolarizing pulses; the lower traces were obtained with longer pulses (100 ms) to show full current inactivation. B, voltage dependence of the fast inactivation time constant measured at 21°C (• T1313A (n= 11), ○ WT (n= 10)) and at 11°C (▴ T1313A (n= 6), ▵ WT (n= 5)). Fast inactivation kinetics were slowed by a comparable factor with decreased temperature. Note however, that at potentials positive to −20 mV, the data obtained for T1313A channels at 10°C, are clearly out of the range delimited by the three other groups (WT at 11°C and 21°C, and mutant at 21°C).
We also evaluated the ratio of the sustained current to the peak current at 11°C for both channels. Measurements of the sustained current were taken within the last 5 ms of a 100 ms pulse. The mean values of Isustained/Ipeak (Is/Ip) obtained at different voltages were usually slightly higher for the mutant than for the WT, but with no obvious statistical significance. For example, the mean values (±s.e.m.) of Is/Ip were 0.056 ± 0.013 and 0.025 ± 0.016 (P > 0.05) at −20 mV for T1313A (n= 6) and WT channels (n= 5), respectively; at +20 mV these values were 0.038 ± 0.016 and 0.024 ± 0.010 (P > 0.05). Overall, the sustained current in the T1313A mutant did not exceed 10% of the peak. Featherstone et al. (1998) suggested that cold-induced myotonic attacks in PC might be due to combined slowing of fast inactivation and deactivation kinetics. Based on this idea, we carried out experiments at 11°C to study the effect of cooling on the deactivation kinetics from both open and inactivated states. To study deactivation from the open state, tail currents were recorded at 11°C in T1313A and WT and compared to those obtained at 21°C. As shown in Fig. 9, decreasing temperature increased the time constant of tail current decay in both channels, and enlarged the differences between mutant and WT. These changes are reminiscent of those obtained for fast inactivation.
Figure 9. Effect of 10°C cooling on open state deactivation.
A, representative traces of Na+ tail currents recorded at 21°C or 11°C using the protocol described in Fig. 7 (upper and middle traces). The lower traces were obtained using longer repolarizing pulses (25 ms) to show full decay of the tail current. B, voltage dependence of the kinetics of the tail current decay (see Fig. 7) measured at 21°C (• T1313A (n= 12), ○ WT (n= 6)), and at 11°C (▴ T1313A (n= 6), ▵ WT (n= 5)). The slowing of the decay time constant with cooling was more striking for T1313A channels at positive potentials.
Deactivation kinetics from the inactivated state were also studied at 11°C and compared to those obtained at 21°C. Lowering the bath temperature by 10°C increased the delay in the onset to recovery from fast inactivation. At −100 mV recovery potential, this delay increased ∼2.5-fold (from 0.28 ± 0.02 ms at 21°C (n= 5) to 0.72 ± 0.001 ms at 11°C (n= 5)) for T1313A, and ∼2-fold (from 0.42 ± 0.06 ms at 21°C (n= 7) to 0.85 ± 0.09 ms at 11°C (n= 4)) for WT channels.
Finally, it is worth noting that the voltage dependence of channel activation did not change with cooling for both channel types (data not shown).
Discussion
This paper explores the biophysical consequences of a newly identified amino acid substitution at locus 1313 (T1313A) on the DIII–DIV linker of the Na+ channel α subunit causing paramyotonia congenita. Our aim was to perform an inclusive analysis of the functional defects of T1313A channels expressed in HEK293 cells using the human isoform of SkM1. We also examined the cold-sensitivity of the disrupted T1313A channel gating kinetics to evaluate the impact of the major triggering factor of myotonia.
As expected from previous studies on missense mutations in DIII–DIV linker (Hayward et al. 1996), the main functional defect of T1313A mutant channels is an impairment of fast inactivation. The T1313A mutation slowed the kinetics and reduced the voltage sensitivity of macroscopic fast inactivation, hastened the recovery from inactivation, and shifted steady-state inactivation by about 10 mV toward depolarization. The nearly 4-fold slowing of macroscopic inactivation at positive potentials is reminiscent of that reported for the human isoform of T1313M mutant channels expressed in HEK cells (Yang et al. 1994) or in Xenopus oocyte macropatches (Richmond et al. 1997). This is well below the 20-fold increase in the fast inactivation time constant observed by Hayward et al. (1996) who expressed the T1313M in HEK cells using the rat isoform of SkM1 together with the brain-derived β1 subunit. Under these conditions, T1313M also induced a large non-inactivating current that was not reported by Yang et al. (1994), nor found in the T1313A mutant. The use of different isoforms and/or the coexpression of the human brain-derived β1 subunit may account for the discrepancies in T1313M channel inactivation. The voltage sensitivity of τh was altered in the same way for both T1313A and T1313M mutations, with a minimum value of τh around −20 mV and no further decrease with strong depolarization (Yang et al. 1994; Hayward et al. 1996). The voltage dependence of τh is usually explained by the coupling between activation and fast inactivation (Armstrong & Bezanilla, 1977; Aldrich & Stevens, 1983; Vandenberg & Horn, 1984). Since activation of T1313A channels exhibited normal voltage dependence, these data suggest some degree of uncoupling between activation and fast inactivation, Single channel studies should help exploring further this hypothesis. On the other hand, the slight increase in τh noticed between −20 and +40 mV for T1313A channels may result from the voltage dependence of deactivation (O'Leary et al. 1995). Recovery from fast inactivation was accelerated in both mutants, whereas the voltage dependence of recovery was unaffected in T1313M (Yang et al. 1994; Hayward et al. 1996), and significantly reduced in T1313A mutants.
Overall, the defects of fast inactivation observed in T1313A mutant channels are comparable with those reported for T1313M (Yang et al. 1994; Hayward et al. 1996). T1313 is located next to the COOH-terminal side of the IFM motif, which is thought to interact with the inactivation gate receptor to occlude the pore during fast inactivation (West et al. 1992; Catterall, 2000). Mutagenesis experiments on brain type II Na+ channels suggest that both the structure and the polarity of this threonine residue are important factors for the stability of fast inactivation (Kellenberger et al. 1997). Both alanine and methionine are non-polar hydrophobic amino acids as opposed to the polar hydrophilic threonine, but alanine and threonine have shorter side chains than methionine. This suggests that the loss of amino acid polarity caused by T1313A and T1313M mutations is an important determinant for the disruption of fast inactivation.
Analysis of open state deactivation from the measurement of the tail current decay revealed a slowing of the kinetics for T1313A channels at potentials more positive than −60 mV. Between −120 and −70 mV tail currents recorded in T1313A and WT declined with similar kinetics. Since this change in kinetics was restricted to potentials at which channel inactivation may contribute to tail current decay, it is likely that this effect is an indirect consequence of disrupted channel inactivation (Cota & Armstrong, 1989; Featherstone et al. 1998; Groome et al. 2002). Deactivation from the inactivation state was hastened by the T1313A mutation, as indicated by the reduction of the delay preceding the recovery from fast inactivation. A recent mutagenesis study suggests that charged residues flanking the IFM motif (D1309, EE1314,15) play a role in deactivation gating (Groome et al. 2003). Interestingly, mutations that accelerate recovery from fast inactivation abbreviate the delay in onset to recovery, whereas those slowing the recovery prolong this delay. This reinforces the notion of a coupling between fast inactivation and deactivation (Kuo & Bean, 1994).
The T1313A mutation moderately enhanced slow inactivation by both shifting the steady-state voltage dependence toward hyperpolarized potentials, and increasing the voltage sensitivity. Up to now, none of the mutations in DIII–DIV linker, including T1313M, has been shown to impair slow inactivation (Featherstone et al. 1996; Hayward et al. 1997; Richmond et al. 1997). Interestingly, the rat SkM1 homologue (T1306M) of the human T1313M mutation was shown to increase the rate of entry to slow inactivation (Hayward et al. 1997). It is tempting to interpret these effects of T1313A and T1313M on slow inactivation as hints for some subtle competition between fast and slow inactivation. Indeed, previous studies have shown that significant disruption of fast inactivation produces subtle changes in slow inactivation (Rudy, 1978; Featherstone et al. 1996; Vedantham & Cannon, 1998).
To explain the link between Na+ channel fast inactivation defects and the clinical phenotype Hayward et al. (1996) proposed a model in which large persistent Na+ currents should lead to paralysis, whereas a depolarizing shift in h(V) and a slowed τh without a large sustained current should cause myotonia. Consistent with this model, the T1313A mutation, which is mainly associated with myotonia, did not induce a large sustained current but slowed the rate of fast inactivation and caused a larger window current at positive potentials. Such changes in fast inactivation can oppose complete membrane repolarization during the action potential, causing thereby repetitive firing, and the ensuing myotonia. When combined with these changes in fast inactivation, the moderate enhancement of slow inactivation observed in T1313A mutant, by slightly reducing Na+ channel availability, may serve as a protective factor against the occurrence of steady depolarization and muscle paralysis. Indeed, the 42-year-old patient carrying this mutation experienced only a few episodes of muscle paresis triggered by exposure to cold or arduous exercise.
Cooling the bath from 21°C to 11°C slowed both τh and τD, and increased the delay in the onset to recovery by a comparable factor in T1313A mutant and WT. Thus, decreasing the temperature exacerbated the functional defects induced by the T1313A mutation. The data, however, do not indicate any change in the temperature sensitivity of the mutant channel per se. As shown in Fig. 8B, τh values obtained for the mutant at 11°C were out of the range delimited by both channel types at 21°C, and by WT at 11°C. This suggests that cooling induces a sufficient slowing of the gating kinetics of the mutant channel to trigger myotonia. Our results support Hayward et al.'s idea of a threshold mechanism for the clinical expression of mutant channel dysfunction in paramyotonia congenita (Hayward et al. 1996). In other words, the cold sensitivity of paramyotonia is not caused by changes in the temperature sensitivity of the mutant channel, but would be related to the great worsening of channel gating kinetics by cold. In conclusion, our results confirm the role of T1313 residue in fast inactivation, and unveil subtle changes in other gating processes that may influence the clinical phenotype.
Acknowledgments
The authors wish to thank the group ‘Résocanaux’ for fruitful discussions. We also thank F. Moueza, J.P. Bardon and M. Chastanet for their valuable technical help. This work was supported by the Institut National de la Recherche Scientifique (INSERM), by the Association Française contre les Myopathies (AFM), and BIOMED grant to J.C.W.
References
- Aldrich RW, Stevens CF. Inactivation of open and closed sodium channels determined separately. Cold Spring Harb Symp Quant Biol. 1983;48:147–153. doi: 10.1101/sqb.1983.048.01.017. [DOI] [PubMed] [Google Scholar]
- Almers W, Roberts WM, Ruff RL. Voltage clamp of rat and human skeletal muscle: measurements with an improved loose-patch technique. J Physiol. 1984;347:751–768. doi: 10.1113/jphysiol.1984.sp015094. [DOI] [PMC free article] [PubMed] [Google Scholar]
- Armstrong CM, Bezanilla F. Inactivation of the sodium channel. II. Gating current experiments. J General Physiol. 1977;70:567–590. doi: 10.1085/jgp.70.5.567. [DOI] [PMC free article] [PubMed] [Google Scholar]
- Barchi RL. Protein components of the purified sodium channel from rat skeletal muscle sarcolemma. J Neurochem. 1983;40:1377–1385. doi: 10.1111/j.1471-4159.1983.tb13580.x. [DOI] [PubMed] [Google Scholar]
- Bendahhou S, Cummins TR, Kula RW, Fu YH, Ptacek LJ. Impairment of slow inactivation as a common mechanism for periodic paralysis in DIIS4-S5. Neurology. 2002;58:1266–1272. doi: 10.1212/wnl.58.8.1266. [DOI] [PubMed] [Google Scholar]
- Bendahhou S, Cummins TR, Kwiecinski H, Waxman SG, Ptacek LJ. Characterization of a new sodium channel mutation at arginine 1448 associated with moderate paramyotonia congenita in humans. J Physiol. 1999;518:337–344. doi: 10.1111/j.1469-7793.1999.0337p.x. [DOI] [PMC free article] [PubMed] [Google Scholar]
- Cannon SC. Spectrum of sodium channel disturbances in the nondystrophic myotonias and periodic paralyses. Kidney Int. 2000;57:772–779. doi: 10.1046/j.1523-1755.2000.00914.x. [DOI] [PubMed] [Google Scholar]
- Catterall WA. From ionic currents to molecular mechanisms: the structure and function of voltage-gated sodium channels. Neuron. 2000;26:13–25. doi: 10.1016/s0896-6273(00)81133-2. [DOI] [PubMed] [Google Scholar]
- Chahine M, George AL, Jr, Zhou M, Ji S, Sun W, Barchi RL, Horn R. Sodium channel mutations in paramyotonia congenita uncouple inactivation from activation. Neuron. 1994;12:281–294. doi: 10.1016/0896-6273(94)90271-2. [DOI] [PubMed] [Google Scholar]
- Chandler WK, Meves H. Slow changes in membrane permeability and long-lasting action potentials in axons perfused with fluoride solutions. J Physiol. 1970;211:707–728. doi: 10.1113/jphysiol.1970.sp009300. [DOI] [PMC free article] [PubMed] [Google Scholar]
- Cota G, Armstrong CM. Sodium channel gating in clonal pituitary cells. The inactivation step is not voltage dependent. J General Physiol. 1989;94:213–232. doi: 10.1085/jgp.94.2.213. [DOI] [PMC free article] [PubMed] [Google Scholar]
- Cummins TR, Sigworth FJ. Impaired slow inactivation in mutant sodium channels. Biophys J. 1996;71:227–236. doi: 10.1016/S0006-3495(96)79219-6. [DOI] [PMC free article] [PubMed] [Google Scholar]
- Eaholtz G, Scheuer T, Catterall WA. Restoration of inactivation and block of open sodium channels by an inactivation gate peptide. Neuron. 1994;12:1041–1048. doi: 10.1016/0896-6273(94)90312-3. [DOI] [PubMed] [Google Scholar]
- Featherstone DE, Fujimoto E, Ruben PC. A defect in skeletal muscle sodium channel deactivation exacerbates hyperexcitability in human paramyotonia congenita. J Physiol. 1998;506:627–638. doi: 10.1111/j.1469-7793.1998.627bv.x. [DOI] [PMC free article] [PubMed] [Google Scholar]
- Featherstone DE, Richmond JE, Ruben PC. Interaction between fast and slow inactivation in Skm1 sodium channels. Biophys J. 1996;71:3098–3109. doi: 10.1016/S0006-3495(96)79504-8. [DOI] [PMC free article] [PubMed] [Google Scholar]
- George AL, Jr, Komisarof J, Kallen RG, Barchi RL. Primary structure of the adult human skeletal muscle voltage-dependent sodium channel. Ann Neurol. 1992;31:131–137. doi: 10.1002/ana.410310203. [DOI] [PubMed] [Google Scholar]
- Groome JR, Fujimoto E, George AL, Ruben PC. Differential effects of homologous S4 mutations in human skeletal muscle sodium channels on deactivation gating from open and inactivated states. J Physiol. 1999;516:687–698. doi: 10.1111/j.1469-7793.1999.0687u.x. [DOI] [PMC free article] [PubMed] [Google Scholar]
- Groome JR, Fujimoto E, Ruben PC. The delay in recovery from fast inactivation in skeletal muscle sodium channels is deactivation. Cell Mol Neurobiol. 2000;20:521–527. doi: 10.1023/A:1007040731407. [DOI] [PMC free article] [PubMed] [Google Scholar]
- Groome JR, Fujimoto E, Ruben PC. Negative charges in the DIII-DIV linker of human skeletal muscle Na+ channels regulate deactivation gating. J Physiol. 2003;548:85–96. doi: 10.1113/jphysiol.2002.033084. [DOI] [PMC free article] [PubMed] [Google Scholar]
- Groome J, Fujimoto E, Walter L, Ruben P. Outer and central charged residues in DIVS4 of skeletal muscle sodium channels have differing roles in deactivation. Biophys J. 2002;82:1293–1307. doi: 10.1016/S0006-3495(02)75485-4. [DOI] [PMC free article] [PubMed] [Google Scholar]
- Hamill OP, Marty A, Neher E, Sakmann B, Sigworth FJ. Improved patch-clamp techniques for high-resolution current recording from cells and cell-free membrane patches. Pflugers Arch. 1981;391:85–100. doi: 10.1007/BF00656997. [DOI] [PubMed] [Google Scholar]
- Hayward LJ, Brown RH, Jr, Cannon SC. Inactivation defects caused by myotonia-associated mutations in the sodium channel III–IV linker. J General Physiol. 1996;107:559–576. doi: 10.1085/jgp.107.5.559. [DOI] [PMC free article] [PubMed] [Google Scholar]
- Hayward LJ, Brown RH, Jr, Cannon SC. Slow inactivation differs among mutant Na channels associated with myotonia and periodic paralysis. Biophys J. 1997;72:1204–1219. doi: 10.1016/S0006-3495(97)78768-X. [DOI] [PMC free article] [PubMed] [Google Scholar]
- Hayward LJ, Sandoval GM, Cannon SC. Defective slow inactivation of sodium channels contributes to familial periodic paralysis. Neurology. 1999;52:1447–1453. doi: 10.1212/wnl.52.7.1447. [DOI] [PubMed] [Google Scholar]
- Jurkat-Rott K, Mitrovic N, Hang C, Kouzmekine A, Iaizzo P, Herzog J, Lerche H, Nicole S, Vale-Santos J, Chauveau D, Fontaine B, Lehmann-Horn F. Voltage-sensor sodium channel mutations cause hypokalemic periodic paralysis type 2 by enhanced inactivation and reduced current. Proc Natl Acad Sci U S A. 2000;97:9549–9554. doi: 10.1073/pnas.97.17.9549. [DOI] [PMC free article] [PubMed] [Google Scholar]
- Kellenberger S, West JW, Scheuer T, Catterall WA. Molecular analysis of the putative inactivation particle in the inactivation gate of brain type IIA Na+ channels. J General Physiol. 1997;109:589–605. doi: 10.1085/jgp.109.5.589. [DOI] [PMC free article] [PubMed] [Google Scholar]
- Kuo CC, Bean BP. Na+ channels must deactivate to recover from inactivation. Neuron. 1994;12:819–829. doi: 10.1016/0896-6273(94)90335-2. [DOI] [PubMed] [Google Scholar]
- Lehmann-Horn F, Rudel R. Molecular pathophysiology of voltage-gated ion channels. Rev Physiol Biochem Pharmacol. 1996;128:195–268. doi: 10.1007/3-540-61343-9_9. [DOI] [PubMed] [Google Scholar]
- Lehmann-Horn F, Rudel R, Dengler R, Lorkovic H, Haass A, Ricker K. Membrane defects in paramyotonia congenita with and without myotonia in a warm environment. Muscle Nerve. 1981;4:396–406. doi: 10.1002/mus.880040508. [DOI] [PubMed] [Google Scholar]
- Lerman LS. Detecting sequence changes in a gene. Somat Cell Mol Genet. 1987;13:419–422. doi: 10.1007/BF01534942. [DOI] [PubMed] [Google Scholar]
- McClatchey AI, Van den Bergh P, Pericak-Vance MA, Raskind W, Verellen C, McKenna-Yasek D, Rao K, Haines JL, Bird T, Brown RH, Jr, et al. Temperature-sensitive mutations in the III–IV cytoplasmic loop region of the skeletal muscle sodium channel gene in paramyotonia congenita. Cell. 1992;68:769–774. doi: 10.1016/0092-8674(92)90151-2. [DOI] [PubMed] [Google Scholar]
- Mohammadi B, Mitrovic N, Lehmann-Horn F, Dengler R, Bufler J. Mechanisms of cold sensitivity of paramyotonia congenita mutation R1448H and overlap syndrome mutation M1360V. J Physiol. 2003;547:691–698. doi: 10.1113/jphysiol.2002.033928. [DOI] [PMC free article] [PubMed] [Google Scholar]
- Noda M, Shimizu S, Tanabe T, Takai T, Kayano T, Ikeda T, Takahashi H, Nakayama H, Kanaoka Y, Minamino N, et al. Primary structure of Electrophorus electricus sodium channel deduced from cDNA sequence. Nature. 1984;312:121–127. doi: 10.1038/312121a0. [DOI] [PubMed] [Google Scholar]
- O'Leary ME, Chen LQ, Kallen RG, Horn R. A molecular link between activation and inactivation of sodium channels. J General Physiol. 1995;106:641–658. doi: 10.1085/jgp.106.4.641. [DOI] [PMC free article] [PubMed] [Google Scholar]
- Patlak J. Molecular kinetics of voltage-dependent Na+ channels. Physiol Rev. 1991;71:1047–1080. doi: 10.1152/physrev.1991.71.4.1047. [DOI] [PubMed] [Google Scholar]
- Plassart E, Eymard B, Maurs L, Hauw JJ, Lyon-Caen O, Fardeau M, Fontaine B. Paramyotonia congenita: genotype to phenotype correlations in two families and report of a new mutation in the sodium channel gene. J Neurol Sci. 1996;142:126–133. doi: 10.1016/0022-510x(96)00173-6. [DOI] [PubMed] [Google Scholar]
- Plassart E, Fontaine B. Genes with triplet repeats: a new class of mutations causing neurological diseases. Biomed Pharmacother. 1994;48:191–197. doi: 10.1016/0753-3322(94)90133-3. [DOI] [PubMed] [Google Scholar]
- Ptacek L. The familial periodic paralyses and nondystrophic myotonias. Am J Med. 1998;105:58–70. doi: 10.1016/s0002-9343(98)00123-5. [DOI] [PubMed] [Google Scholar]
- Ptacek LJ, George AL, Jr, Barchi RL, Griggs RC, Riggs JE, Robertson M, Leppert MF. Mutations in an S4 segment of the adult skeletal muscle sodium channel cause paramyotonia congenita. Neuron. 1992;8:891–897. doi: 10.1016/0896-6273(92)90203-p. [DOI] [PubMed] [Google Scholar]
- Raman IM, Bean BP. Resurgent sodium current and action potential formation in dissociated cerebellar Purkinje neurons. J Neurosci. 1997;17:4517–4526. doi: 10.1523/JNEUROSCI.17-12-04517.1997. [DOI] [PMC free article] [PubMed] [Google Scholar]
- Richmond JE, Featherstone DE, Ruben PC. Human Na+ channel fast and slow inactivation in paramyotonia congenita mutants expressed in Xenopus laevis oocytes. J Physiol. 1997;499:589–600. doi: 10.1113/jphysiol.1997.sp021952. [DOI] [PMC free article] [PubMed] [Google Scholar]
- Rudy B. Slow inactivation of the sodium conductance in squid giant axons. Pronase resistance. J Physiol. 1978;283:1–21. doi: 10.1113/jphysiol.1978.sp012485. [DOI] [PMC free article] [PubMed] [Google Scholar]
- Ruff RL. Effects of temperature on slow and fast inactivation of rat skeletal muscle Na(+) channels. Am J Physiol. 1999;277:C937–C947. doi: 10.1152/ajpcell.1999.277.5.C937. [DOI] [PubMed] [Google Scholar]
- Ruff RL, Simoncini L, Stuhmer W. Slow sodium channel inactivation in mammalian muscle: a possible role in regulating excitability. Muscle Nerve. 1988;11:502–510. doi: 10.1002/mus.880110514. [DOI] [PubMed] [Google Scholar]
- Struyk AF, Scoggan KA, Bulman DE, Cannon SC. The human skeletal muscle Na channel mutation R669H associated with hypokalemic periodic paralysis enhances slow inactivation. J Neurosci. 2000;20:8610–8617. doi: 10.1523/JNEUROSCI.20-23-08610.2000. [DOI] [PMC free article] [PubMed] [Google Scholar]
- Takahashi MP, Cannon SC. Enhanced slow inactivation by V445M: a sodium channel mutation associated with myotonia. Biophys J. 1999;76:861–868. doi: 10.1016/S0006-3495(99)77249-8. [DOI] [PMC free article] [PubMed] [Google Scholar]
- Vandenberg CA, Horn R. Inactivation viewed through single sodium channels. J General Physiol. 1984;84:535–564. doi: 10.1085/jgp.84.4.535. [DOI] [PMC free article] [PubMed] [Google Scholar]
- Vedantham V, Cannon SC. Slow inactivation does not affect movement of the fast inactivation gate in voltage-gated Na+ channels. J General Physiol. 1998;111:83–93. doi: 10.1085/jgp.111.1.83. [DOI] [PMC free article] [PubMed] [Google Scholar]
- West JW, Patton DE, Scheuer T, Wang Y, Goldin AL, Catterall WA. A cluster of hydrophobic amino acid residues required for fast Na (+) -channel inactivation. Proc Natl Acad Sci U S A. 1992;89:10910–10914. doi: 10.1073/pnas.89.22.10910. [DOI] [PMC free article] [PubMed] [Google Scholar]
- Yang N, Ji S, Zhou M, Ptacek LJ, Barchi RL, Horn R, George AL., Jr Sodium channel mutations in paramyotonia congenita exhibit similar biophysical phenotypes in vitro. Proc Natl Acad Sci U S A. 1994;91:12785–12789. doi: 10.1073/pnas.91.26.12785. [DOI] [PMC free article] [PubMed] [Google Scholar]


