Abstract
The role of basolateral Na+–H+ exchanger isoform-1 (NHE-1) was investigated in neural adaptation of rat taste responses to acidic stimuli, by direct measurement of intracellular pH (pHi) in polarized taste receptor cells (TRCs) and by chorda tympani (CT) taste nerve recordings. In TRCs perfused with CO2/HCO3−-free solution (pH 7.4), removal of basolateral Na+ decreased pHi reversibly and zoniporide, a specific NHE-1 blocker, inhibited the Na+-induced changes in pHi. The spontaneous rate of TRC pHi recovery from NH4Cl pulses was inhibited by basolateral zoniporide with a Ki of 0.33μm. Exposure to basolateral ionomycin, reversibly increased TRC Ca2+, resting pHi, and the spontaneous rate of pHi recovery from an NH4Cl pulse. These effects of Ca2+ on pHi were blocked by zoniporide. In in vivo experiments, topical lingual application of zoniporide increased the magnitude of the CT responses to acetic acid and CO2, but not to HCl. Topical lingual application of ionomycin did not affect the phasic part of the CT responses to acidic stimuli, but decreased the tonic part by 50% of control over a period of about 1 min. This increased adaptation in the CT response was inhibited by zoniporide. Topical lingual application of 8-CPT-cAMP increased the CT responses to HCl, but not to CO2, and acetic acid. In the presence of cAMP, ionomycin increased sensory adaptation to HCl, CO2, and acetic acid. Thus, cAMP and Ca2+ independently modulate CT responses to acidic stimuli. While cAMP enhances TRC apical H+ entry and CT responses to strong acid, an increase in Ca2+ activates NHE-1, and increases neural adaptation to all acidic stimuli.
The neural responses to taste stimuli comprise two distinct processes that differ in temporal scale and amplitude (Pfaffmann, 1955; Smith & Bealer, 1975; Smith et al. 1978; Lyall et al. 2001; Lyall et al. 2002a; Simon, 2002). Following the application of a salt or acid stimulus, the chorda tympani (CT) taste nerve usually demonstrates a rapid phasic increase in neural activity followed by a slower decrease in response that asymptotically approaches a steady-state, the so-called tonic response level. This slow decrease in neural response during the continuous presence of the stimulus operationally defines taste neural adaptation. While the phenomenon of adaptation in taste is well documented, little is known in taste receptor cells (TRCs) that give rise to it for any of the taste modalities. Recent studies suggest that in the case of sour taste, acid stimuli induce a decrease in intracellular pH (pHi) in a subset of TRCs (Lyall et al. 2001, 2002a, b) with a parallel increase in intracellular Ca2+ concentration ([Ca2+]i) (Liu & Simon, 2001; Richter et al. 2003; Lyall et al. 2003). The elevated [Ca2+]i levels in turn activate a specific Ca2+-activated Na+–H+ exchanger (NHE) in TRC membranes that appears to be a functional adaptation mechanism for CT responses to HCl (Lyall et al. 2002a). The NHEs constitute a gene family consisting of six isoforms each of which possesses distinct characteristics and serves a specialized function (Josette & Pouysségur, 1995; Orlowski & Grinstein, 1997; Wakabayashi et al. 1997; Ritter et al. 2001). At present, the identity of the specific NHE isoform involved in neural adaptation has not been determined. Secondly, it remains to be established, if this adaptation mechanism occurs during normal sour taste transduction, and applies to both strong and weak acid stimulation.
We have recently demonstrated the presence of the mRNA for the Na+–H+ exchanger isoform 1 (NHE-1) in TRCs by RT-PCR, and have localized NHE-1 to the basolateral membranes of TRCs by means of specific NHE-1 antibodies (Vinnikova et al. 2004). The studies further demonstrated that in the nominal absence of CO2/HCO3−, the basolateral NHE-1 is functional and is a major pathway for pHi regulation in TRCs. In this paper, we examined the role of basolateral NHE-1 in the neural adaptation to acid stimulation using a recently discovered potent and selective blocker of NHE-1, with high aqueous solubility, zoniporide (Guzman-Perez et al. 2001). The effect of zoniporide was investigated on the pHi regulation in polarized rat fungiform TRCs using pH imaging in vitro, and on the neural adaptation, by monitoring rat CT taste nerve responses to acid stimulation in vivo. The results demonstrate that in polarized TRCs, NHE-1 is selectively blocked by basolateral application of zoniporide with a mean Ki of 0.33μm. In parallel in vivo experiments, topical lingual application of zoniporide, increased the CT taste nerve responses to acetic acid and CO2 stimulation relative to control. In in vitro experiments, the basolateral NHE-1 was activated by an increase in TRC Ca2+ and this increase in activity was blocked by zoniporide. In anaesthetized rats, topical lingual application of a Ca2+ ionophore, ionomycin, increased TRC Ca2+, and increased CT taste nerve adaptation to acid stimulation. In contrast, topical lingual application of zoniporide inhibited NHE-1 activity, and completely eliminated the ionomycin-induced increase in neural adaptation to the acidic stimuli. The data demonstrate conclusively that the TRC basolateral NHE-1 is involved in neural adaptation of the CT responses to acid stimulation, and thus plays an important role in modulating sour taste transduction.
Methods
pH imaging
For the in vitro experiments, rats were anaesthetized with isoflurane and killed by cervical dislocation. All procedures were approved by the Institutional Animal Care and Use Committee (IACUC) of Virginia Commonwealth University. The tongues were rapidly removed and stored in ice-cold Ringer solution (R; Table 1). The lingual epithelium was isolated by collagenase treatment (Béhé et al. 1990). A small piece of the anterior lingual epithelium containing a single fungiform papilla was mounted in a special microscopy chamber (Chu et al. 1995) as described before (Lyall et al. 2001, 2002a, b; DeSimone et al. 2001a). The TRCs within the taste bud were loaded with the pH-sensitive dye BCECF and perfused on both sides with control Ringer solution (RC; Table 1). The detailed method for the measurement of pHi using BCECF has been described before (Lyall et al. 2001, 2002a, b; DeSimone et al. 2001a; Vinnikova et al. 2004). In brief, TRCs in the taste bud were visualized from the basolateral side through a 40 × objective (Zeiss; 0.9 NA) with a Zeiss Axioskop 2 plus upright fluorescence microscope and imaged with a set-up consisting of a cooled CCD camera (Imago, TILL Photonics, Applied Scientific Instrumentation, Eugene, OR, USA) attached to an image intensifier (VS4-1845 Videoscope, Washington, DC, USA), an epifluorescent light source (TILL Photonics Polychrome IV), a 515nm dichroic beam splitter, and a 535nm emission filter (20nm band pass; Omega Optical). The cells were alternately excited at 490 and 440nm and imaged at 15s intervals. In the chamber, the taste bud is orientated along its z-axis with its apical membrane facing down and the basolateral membrane up facing the objective. The fluorescence measurements are made in an x–y plane perpendicular to the z-axis. Since under these conditions the complete spindle-shaped profile of an individual taste cell is not known, it is difficult to separate cells just by imaging the soma of TRCs. Therefore, small regions of interest (ROIs) in the taste bud (diameter 2–3 μm2) were chosen in which the changes in the FIR (fluorescence intensity ratio; F490/F440) were analysed using TILLvisION v3.1 imaging software. Each ROI contained two to three receptor cells. Thus the fluorescence intensity recorded for a ROI represents the mean value from two to three receptor cells within the ROI. In a typical experiment, the FIR measurements were made in an optical plane in the taste bud containing six ROIs (approximately 12–18 cells). The background and autofluorescence at 490 and 440nm were corrected from images of a taste bud without the dye. The changes in TRC pHi were calibrated by perfusing the epithelium on both sides with high K+ calibrating solutions containing 10μm nigericin adjusted to pHs between 6.5 and 8.0.
Table 1.
Solution used in in vitro experiments (mm)
| R | RC | R0Na | RNH4Cl | RNaA | RCO2 | RCO2NH4Cl | |
|---|---|---|---|---|---|---|---|
| NaCl | 140 | 150 | — | 120 | 120 | 114 | 84 |
| KCl | 5 | 5 | 5 | 5 | 5 | 5 | 5 |
| CaCl2 | 1 | 1 | 1 | 1 | 1 | 1 | 1 |
| MgCl2 | 1 | 1 | 1 | 1 | 1 | 1 | 1 |
| NaPy | 10 | — | — | — | — | — | — |
| Hepes | 10 | 10 | 10 | 10 | 10 | — | — |
| Glucose | 10 | 10 | 10 | 10 | 10 | 10 | 10 |
| NMDGCl | — | — | 150 | — | — | — | — |
| NH4Cl | — | — | — | 30 | — | — | 30 |
| NaA | — | — | — | — | 30 | — | — |
| NaHCO3 | — | — | — | — | — | 36 | 36 |
| *CO2 (%) | — | — | — | — | — | 5 | 5 |
| pH | 7.4 | 7.4 | 7.4 | 7.4 | 7.4 | 7.4 | 7.4 |
R, Ringer solution; RC, control Ringer solution; R0Na, 0 Na+ Ringer solution; RCO2, CO2/HCO3− Ringer solution; RNH4Cl, 30 mm NH4Cl Ringer solution; RNaA, 30mm sodium acetate Ringer solution; RCO2NH4Cl, CO2/HCO3− Ringer solution containing 30mm NH4Cl; NaPy, sodium pyruvate; NaA=sodium acetate; Hepes, N-[2-hydroxyethyl]-piperazine-N′-[2-ethanesulphonic acid].
CO2, 5/95% (CO2/O2).
Solutions
The composition of the solutions used in the in vitro experiments is given in Table 1. The control solution (RC; Table 1) was Ringer solution without sodium pyruvate (Lyall et al. 2002a, b). In some experiments, the control solutions contained cariporide (HOE-642; Aventis Pharma, Germany) or zoniporide, both specific blockers of the NHE-1 (Scholz et al. 1995; Guzman-Perez et al. 2001). Zoniporide was a generous gift from Pfizer Inc. (Groton, CT, USA). Some experiments were also performed with amiloride (Sigma), a non-specific blocker of NHEs. In some experiments, in control Ringer solution 30mm NaCl was replaced with either 30mm NH4Cl (RNH4Cl; Table 1) or 30mm sodium acetate (RNaA; Table 1). In some experiments, the basolateral membrane of polarized TRCs was perfused with a control solution containing the Ca2+ ionophore ionomycin (15μm) or the membrane-permeant form of the cAMP, 8-(4-chlorophenylthio)adenosine 3′:5′-cyclic monophosphate (8-CPT-cAMP; 250μm) (both from Sigma) (Lyall et al. 2002a).
Data analysis
Within a single taste bud, pHi values were expressed as the mean±standard error of the mean of n; where n represents the number of ROIs within the taste bud; M±s.e.m. (n). The data were also presented as the mean±standard error of the mean from different tissue preparations (N). In this case N represented the number of polarized lingual preparations studied. Under each experimental condition the data are averaged from at least three lingual preparations. We have previously shown that in TRCs perfused with a nominally HCO3−-free Ringer solution, the intrinsic buffering capacity (β1) is related to TRC pHi, and is expressed as: β1=–36.9 × pHi+ 288.6mm pH−1 (Vinnikova et al. 2004). The values of β1 were used to calculate the net H+ flux (JH+ = β1 × δpHi min−1) associated with the basolateral NHE-1 activity under different experimental conditions. Student's t test was employed to analyse the differences between sets of data.
Chorda tympani (CT) nerve recordings
Female Sprague-Dawley rats (150–200g) were anaesthetized by intraperitoneal injection of pentobarbital (60 mg kg−1) and supplemental pentobarbital (60mg kg−1) was administered as necessary to maintain surgical anaesthesia. All procedures for the in vivo experiments were approved by the Institutional Animal Care and Use Committee (IACUC) of Virginia Commonwealth University. Body temperatures were maintained at 36–37°C with a circulating water heating pad. The left CT taste nerve was exposed laterally as it exits the tympanic bulla and placed onto a 32G platinum/iridium wire electrode. An indifferent electrode was placed in nearby tissue. Neural responses were differentially amplified with a custom-built, optically coupled isolation amplifier. For display, responses were filtered using a band-pass filter with cutoff frequencies 40Hz to 3kHz and fed to an oscilloscope. Responses were then full-wave rectified and integrated with a time constant of 1s. Integrated neural responses and current and voltage records were recorded on a chart recorder and also captured on disk using Labview software and analysed off-line (Lyall et al. 2001, 2002a, b). Stimulus solutions were injected into a Lucite chamber (3ml; 1mls−1) affixed by vacuum to a 28 mm2 patch of anterior dorsal lingual surface. The chamber was fitted with separate Ag–AgCl electrodes for measurement of current and potential. These electrodes served as inputs to a voltage-current clamp amplifier that permitted the recording of neural responses with the chemically stimulated receptive field under current (zero current-clamp, 0cc) or voltage-clamp (Ye et al. 1993, 1994). The clamp voltages were referenced to the mucosal side of the tongue.
The anterior lingual surface was stimulated with rinse solutions (R) and with acidic stimuli (S): HCl, acetic acid or CO2. The composition of the rinse solutions and the corresponding stimulating solutions is given in Table 2. In some experiments ionomycin (150μm), 8-CPT-cAMP (20mm) or zoniporide (100–500μm) was dissolved directly in dimethyl sulfoxide (DMSO) and applied topically to the lingual surface for 45min. In experiments with ionomycin, the rinse solution and the stimulating solution contained, in addition, 10mm CaCl2 (Lyall et al. 2002a). DMSO alone had no effect on CT responses as previously shown (Lyall et al. 1999).
Table 2.
Rinse and stimulus solutions for CT experiments
| KCl (mm) | Hepes (mm) | HCl (mm) | KHCO3 (mm) | KA (mm) | *CO2 (%) | AA (mm) | pH | |
|---|---|---|---|---|---|---|---|---|
| RHCl | 10 | — | — | — | — | — | — | — |
| SHCl | — | 20 | — | — | — | — | — | 1.7 |
| RAA | 175 | 10 | — | — | — | — | — | 6.1 |
| SAA | — | — | — | — | 175 | — | 10 | 6.1 |
| RCO2 | 72 | 10 | — | — | — | — | — | 7.4 |
| SCO2 | — | — | — | 72 | — | 10 | — | 7.4 |
R, rinse solution; S, stimulating solution; KA, potassium acetate; AA, acetic acid; Hepes, N-[2-hydroxyethyl]-piperazine-N′-[2-ethanesulphonic acid]
CO2/O2 (10/90%). In experiments with ionomycin all rinse solutions and stimulating solutions contained, in addition, 10mm CaCl2.
In isolated lingual preparations 15μm ionomycin, 250μm 8-CPT-cAMP and zoniporide (1–50μm) were applied on the basolateral side in vitro and induced their effects within minutes. However, in the in vivo experiments, ionomycin (150μm) and zoniporide (100–500μm) were necessarily applied topically to the lingual surface at approximately 10-fold higher concentrations for 45 min. In preliminary experiments topical application of 5mm or 10mm 8-CPT-cAMP did not affect the CT responses to HCl. Cyclic AMP increased CT responses at 15mm and the maximum enhancement was observed at 20mm concentration (data not shown). The data presented in this study were obtained with 20mm 8-CPT-cAMP. The fact that higher concentrations of these drugs and longer exposure times were required to observe significant effects on CT responses is consistent with the presence of a significant diffusion barrier in the taste pore region (Lyall et al. 2001).
Data analysis
Consistent with our previous studies (Lyall et al. 2002a), in the presence of ionomycin + CaCl2, following stimulation with HCl, acetic acid and CO2 the CT responses demonstrated rapid adaptation within the first 30 s of stimulus application (see Figs 7, 9 and 11). However, the initial rate of decrease in the CT response and its magnitude varied with the acid stimuli. Therefore, the numerical value of an integrated CT response was obtained in the quasi-steady-state part of the response as the area under the integrated CT response curve for a time interval of 1 min measured from the end of a typical 2 min stimulation period (Lyall et al. 2002b). The changes in the area under the integrated CT responses to acid stimulation under different conditions were normalized to the responses observed in each animal to 300mm NH4Cl and were expressed as the mean±s.e.m. of N; where N represents the number of animals in each group; M±s.e.m. (N). Under each experimental condition the data were averaged from at least three animals. Student's t test was employed to analyse the differences between sets of data.
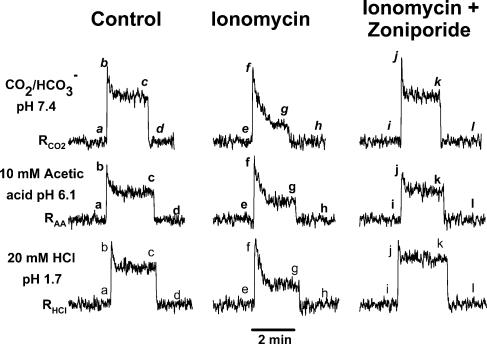
Figure 7. Effect of ionomycin and zoniporide on the CT responses to HCl, CO2 and acetic acid.
The CT responses were recorded at zero current-clamp (0cc) under control conditions (Control), after the topical lingual application of 150μm ionomycin alone (Ionomycin), and following treatment with 500μm zoniporide + 150μm ionomycin (Zoniporide). All rinse (R) and test solutions (S) contained, in addition, 10mm CaCl2. The tongue was stimulated with 20mm HCl (SHCl), 10mm acetic acid titrated to pH 6.1 with potassium acetate (SAA), and CO2/HCO3− buffer, pH 7.4 (SCO2). The corresponding rinse solutions were: RHCl, RAA, and RCO2, respectively (Table 2). See text for details.
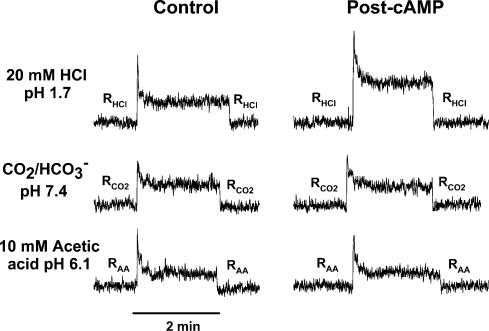
Figure 9. Effect of 8-CPT-cAMP on the CT responses to HCl, CO2 and acetic acid.
The CT responses to 20mm HCl (pH 1.7), CO2 (pH 7.4) and 10mm acetic acid (pH 6.1) were recorded under open-circuit conditions (0cc) before (Control) and after the topical lingual application of 20mm 8-CPT-cAMP for 45min (Post-cAMP).
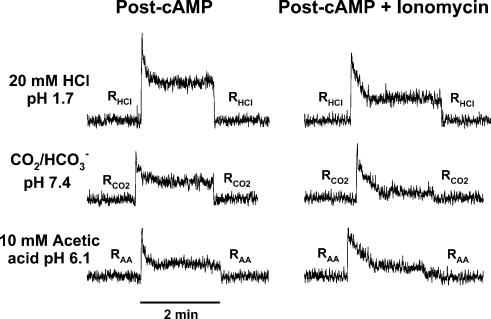
Figure 11. Effect of cAMP and ionomycin on the CT responses to HCl, CO2 and acetic acid.
The CT responses to 20mm HCl (pH 1.7), CO2 (pH 7.4) and 10mm acetic acid (pH 6.1) were recorded under open-circuit conditions (0cc) after the topical lingual application of 20mm 8-CPT-cAMP (Post-cAMP) and following treatment with 20mm 8-CPT-cAMP + 150μm ionomycin (Post-cAMP + Ionomycin). All rinse solutions (R) and the acidic stimuli (S) contained, in addition, 10mm CaCl2 (Table 2).
Results
In vitro studies
Effect of external Na+ and zoniporide on TRC pHi
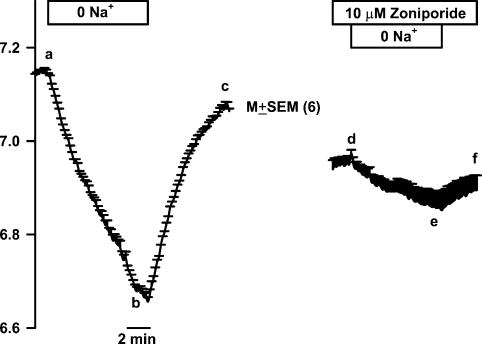
In polarized TRCs perfused on both sides with control Ringer solution (RC; Table 1), unilaterally switching to a Na+-free Ringer solution (R0Na; Table 1) in the basolateral compartment, decreased mean TRC pHi (Fig. 1; a–b) from 7.15±0.01 to 6.66±0.01 (ΔpHi=–0.49 pH unit; n=6). Re-perfusing the control solution (RC) in the basolateral compartment increased pHi to near its original level (b–c). In three polarized TRC preparations, perfusing Na+-free Ringer's solution in the basolateral compartment decreased resting TRC pHi by 0.62±0.03 pH unit (P <0.001; N=3). These results indicate that TRC pHi is dependent upon the Na+ concentration in the basolateral compartment (Vinnikova et al. 2004).
Figure 1. Effect of basolateral Na+ removal on TRC pHi.
A lingual epithelial preparation was perfused on both sides with control solution containing 150mm NaCl (RC; pH 7.4; Table 1). At the time period shown by the top horizontal bar the basolateral membrane solution was switched to a Na+-free solution (0 Na+) containing 150mm NMDG-Cl (R0Na; pH 7.4; Table 1). Under control conditions removal of Na+ decreased TRC pHi (a–b) and upon re-perfusing the control solution increased pHi to near its control value (b–c). In the second half of the experiment, the basolateral membrane was treated with 10μm zoniporide. In the presence of zoniporide, the changes in pHi upon removal (d–e) and re-addition (e–f) of Na+ were significantly attenuated. The pHi values are presented as mean±s.e.m. of n (number of ROIs within the taste bud).
Data presented in Fig. 1 also shows that decreasing basolateral Na+ concentration from 150mm (RC; Table 1) to zero in the presence of 10μm zoniporide (i.e switching to R0Na + 10μm zoniporide; Table 1) inhibited the changes in TRC pHi relative to control (d–e versus a–b). The initial rate of change in TRC pHi was measured for the first 2 min following a change in the basolateral Na+ concentration. As shown before, the intrinsic buffering capacity (β1) is related to TRC pHi as follows: β1=–36.9 × pHi+ 288.6mm pH−1 (Vinnikova et al. 2004). Taking the mean pHi value at the midpoint of the first 2min between points a and b (pH 7.07) gives the mean β1 value of 27.6mm pH−1. Thus, in the absence of zoniporide, lowering the basolateral Na+ concentration from 150mm to 0 decreased TRC pHi at the mean rate of –0.086±0.003 pH unit min−1 (a–b), and decreased JH+ by 2.37±0.08mm min−1. Re-perfusing with control Ringer solution (RC; Table 1) increased pHi at the mean rate of 0.101±0.008 pH unit min−1 (b–c; n=6). Again, taking the mean pHi value at the midpoint of the first 2min between points b and c (pH 6.75) gives the mean β1 value of 39.6mm pH−1 and the value of JH+ as 4.0±0.32mm min−1. In contrast, in the presence 10μm zoniporide, the corresponding rates of JH+ upon Na+ removal (d–e) and its addition (e–f) were –0.58±0.13mm min−1 (75.5% inhibition) and 0.51±0.10mm min−1 (87.2% inhibition), respectively (P<0.001; paired). Similar results were obtained in 2 additional experiments (data not shown). Similar effects were also observed with another specific NHE-1 blocker, cariporide, and a non-specific NHE blocker, amiloride (Vinnikova et al. 2004).
Effect of intracellular acid loading and zoniporide on TRC pHi
Studies with sodium acetate (NaA)
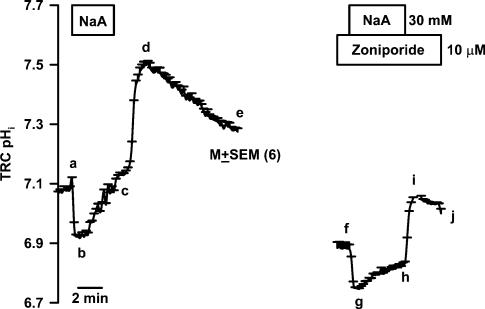
Figure 2 shows the effect of a short basolateral NaA pulse on the temporal changes in TRC pHi. Immediately following the perfusion of Ringer solutions containing 30mm NaA (RNaA; Table 1) in the basolateral compartment, pHi rapidly acidified (a–b), due to the entry of the membrane-permeant undissociated acetic acid and its conversion to free intracellular H+ ions and acetate anion (Roos & Boron, 1981). The intracellular acidification was transient and was followed by a spontaneous recovery of pHi (b–c). Upon NaA washout, TRC pHi alkalinized and became higher than its resting value (c–d). This occurs due to the rapid exit of the undissociated acetic acid from the cells resulting in a decrease in intracellular H+ ions. The spontaneous recovery of alkaline pHi towards baseline (d–e) reflects the presence of as yet unidentified pH recovery mechanism(s) in TRCs that allow base (OH−) exit or entry of acid equivalents at alkaline pHi.
Figure 2. Effect of zoniporide on the spontaneous TRC pHi recovery following intracellular acid loading with sodium acetate (NaA).
A lingual epithelial preparation was initially perfused on both sides with control solution containing 150mm NaCl (RC; pH 7.4; Table 1). Temporal changes in TRC pHi were monitored following the exposure of the basolateral membrane to short sodium acetate (RNaA; Table 1) pulses under control conditions (a–b–c–d–e) and in the presence of 10μm zoniporide in the basolateral compartment (f–g–h–i–j). The pHi values are presented as mean±s.e.m. of n (number of ROIs within the taste bud).
The initial rate of change in pHi was measured during the first 2min of spontaneous TRC pHi recovery following the NaA pulse (b–c). Taking the mean pHi value at the midpoint of the first 2min between points b and c (pH 7.01) gives the mean β1 value of 29.9mm pH−1. Thus under control conditions, the spontaneous mean initial pHi recovery rate (b–c; 0.084±0.003 pH unit min−1; n=6) represents a mean JH+ of 2.51±0.09mm min−1. Similarly, in the presence of 10μm zoniporide, using a mean pHi value at the midpoint of the first 2min between points g and h (pH 6.78) gave a mean β1 value of 38.5mm pH−1. Thus in the presence of zoniporide, the spontaneous mean initial pHi recovery rate (g–h; 0.030±0.001 pH unit min−1; N=6) represents a mean JH+ of 1.15±0.04mm min−1. This represents a 54.2% (P<0.01) inhibition of JH+ compared to control. However, zoniporide did not affect the exit of undissociated acetic acid from cells (h–i) and the subsequent spontaneous recovery of alkaline pHi towards baseline (i–j). These data indicate that zoniporide specifically inhibits pHi recovery from an intracellular acid load and does not affect mechanisms involved in base (OH−) exit or entry of acid equivalents at alkaline pHi. Similar results were obtained with cariporide and amiloride (Vinnikova et al. 2004).
Studies with NH4Cl
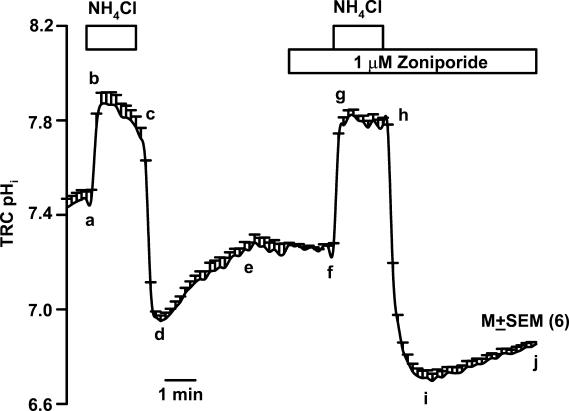
Data presented in Fig. 3 show the effect of a short basolateral NH4Cl pulse on the temporal changes in TRC pHi. Immediately following NH4Cl perfusion (RNH4Cl; Table 1), TRC pHi rapidly alkalinized (a–b), due to the entry of NH3 and conversion of free intracellular H+ ions to NH4+ ions (Roos & Boron, 1981). This was followed by a slow decline of pHi towards baseline (b–c), presumably, reflecting NH4+ entry or pH compensation mechanisms in TRC membranes (Roos & Boron, 1981). Upon replacing NH4Cl solution (RNH4Cl; Table 1) with control Ringer solution (RC; Table 1) in the basolateral compartment, TRC pHi acidified (c–d), and became lower than its resting value due to the combined effect of rapid NH3 exit from the cells and the conversion of NH4+ to NH3+ free H+ ions. This decrease in pHi was transient and was followed by spontaneous pHi recovery towards its control value (d–e). The initial spontaneous rate of change in TRC pHi was measured for the first 2min following the NH4Cl pulse. In the presence of 1μm zoniporide in the basolateral compartment, the mean pHi recovery rate (i–j; 0.045±0.001 pH unit min−1; n=6) was significantly reduced (58.9% inhibition) compared to control (d–e; 0.11±0.003 pH unit min−1). This was equivalent to a decrease in JH+ from 2.08±0.06 to 1.44±0.03mm min−1 (30.8% inhibition; P<0.01) in the presence of 1μm zoniporide. Although not shown in the figure, increasing zoniporide concentration to 10μm, decreased the mean pHi recovery rate to 0.036±0.003 pH unit min−1 (67.3% inhibition) and JH+ to 1.18±0.10 (43.3% inhibition; P<0.01) relative to control.
Figure 3. Effect of zoniporide on the spontaneous TRC pHi recovery following acid loading with NH4Cl.
A lingual epithelial preparation was initially perfused on both sides with a control solution containing 150mm NaCl (RC; pH 7.4; Table 1). Temporal changes in TRC pHi were monitored following a short basolateral NH4Cl pulse (RNH4Cl; Table 1) under control conditions (a–b–c–d–e) and in the presence of 1μm zoniporide in the basolateral compartment (f–g–h–i–j). The pHi values are presented as mean ± s.e.m. of n (number of ROIs within the taste bud).
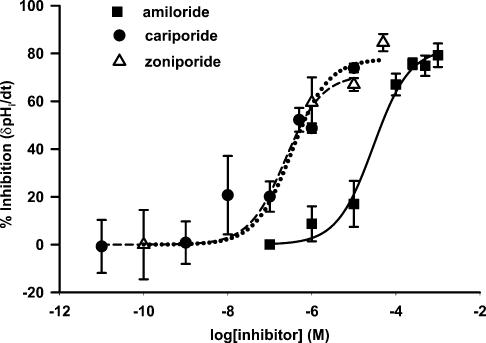
Zoniporide inhibited the spontaneous rate of pHi recovery after the NH4Cl pulse in a dose-dependent manner (Fig. 4; open triangles and dotted line). The data were fitted to a Michaelis–Menten-type equation. In three polarized TRC preparations, the mean Ki value (a concentration that inhibits the spontaneous rate of pHi recovery by 50%) for zoniporide was 0.33μm (range=0.17–0.64μm). Cariporide, another specific blocker of NHE-1, also inhibited the spontaneous rate of pHi recovery after the NH4Cl pulse in a dose-dependent manner (Fig. 4; filled circles and dashed line) with a Ki of 0.23μm (range=0.14–0.40μm). Amiloride, a non-specific blocker of NHEs, also inhibited the spontaneous rate of pHi recovery in a dose-dependent manner (Fig. 4; filled squares and continuous line) with a mean Ki value of 29.0μm (range=23–36μm) (Vinnikova et al. 2004). The data summarized in Fig. 4, also show that at zoniporide, cariporide and amiloride concentrations greater than 50 times the value of Ki, the mean maximal inhibition of the spontaneous pHi recovery rate was around 80%. These data suggest that in the nominal absence of CO2/HCO3−, about 80% of the pHi recovery from an intracellular acid load occurs via the basolateral NHE-1. The remaining 20% of the pHi recovery must involve additional pH regulatory mechanisms, yet to be identified in TRCs (Vinnikova et al. 2004).
Figure 4. Effect of NHE-1 blockers on the spontaneous TRC pHi recovery from basolateral NH4Cl pulses.
Lingual epithelial preparations were initially perfused on both sides with control solution containing 150mm NaCl (RC; pH 7.4; Table 1). Temporal changes in TRC pHi were monitored following exposure of the basolateral membranes to short NH4Cl pulses (RNH4Cl; Table 1), in the presence of increasing concentrations of amiloride (▪), cariporide (•), and zoniporide (▵). Each drug was tested individually in a separate lingual preparation. In each case, the spontaneous rate of pHi recovery in the absence of the drug was taken as 100%. The spontaneous pHi recovery rates (δpHi min−1) are presented as means±s.e.m. of number of lingual epithelial preparations, N, where N = 3.
Effect of ionomycin and zoniporide on TRC pHi
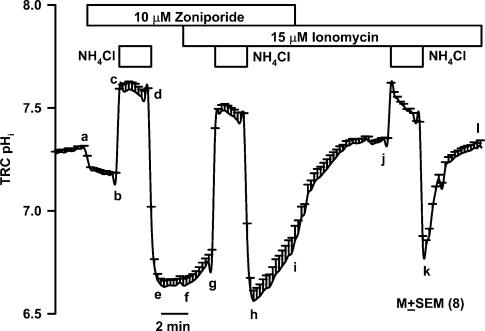
Data summarized in Fig. 5 show that perfusing control Ringer solution (RC; Table 1) containing 10μm zoniporide in the basolateral compartment decreased the mean resting TRC pHi (a–b) from 7.26±0.01 to 7.17±0.02 (P<0.01; n=8). This indicates that under control conditions, there is a basal NHE-1 activity in the basolateral membranes of TRCs. Following a short basolateral NH4Cl pulse (b–c–d), no spontaneous pHi recovery (e–f) was observed in the presence of zoniporide. In the continuous presence of zoniporide, treating the basolateral membrane with 15μm ionomycin produced a small but significant (P<0.01; n=8) increase in TRC pHi (f–g) from 6.65±0.03 to 6.77±0.04 but increased the spontaneous initial JH+ from 0.26±0.18mmmin−1 (e–f) to 3.55±0.45mmmin−1 (h–i). Thus in the presence of zoniporide, ionomycin increased JH+ by 13.6±1.7-fold (P<0.01; n=8). In the final step, perfusing the basolateral membrane with Ringer solution (RC; Table 1) containing ionomycin, but without zoniporide, increased TRC pHi (i–j) from 6.80±0.07–7.34±0.01 (P<0.001), and increased the JH+ from the NH4Cl pulse (k–l) to 10.70±0.84mmmin−1 (a 41.1±3.2 fold increase relative to zoniporide alone; e–f; P<0.001). Similar results were obtained in two additional TRC preparations (data not shown). These results indicate that ionomycin alkalinizes resting TRC pHi and activates basolateral NHE-1, and zoniporide inhibits the ionomycin-induced increase in the basolateral NHE-1 activity.
Figure 5. Effect of ionomycin and zoniporide on TRC pHi.
A lingual epithelial preparation was initially perfused on both sides with control Ringer solution (RC; Table 1). Temporal changes in TRC pHi were monitored following short basolateral NH4Cl pulses (RNH4Cl; Table 1) in the presence 10μm zoniporide (b–c–d–e–f); 10μm zoniporide + 15μm ionomycin (g–h–i); and 15μm ionomycin (j–k–i). The pHi values are presented as mean±s.e.m. of number of ROIs within the taste bud, n.
In vivo studies
Effect of zoniporide on the CT responses to acidic stimuli
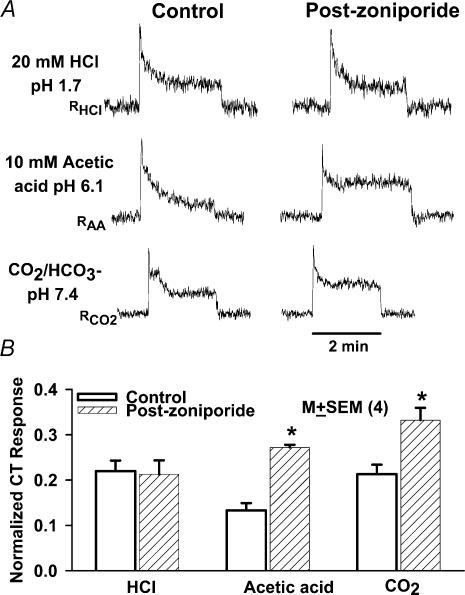
The above results (cf. Fig. 5) indicate that under physiological conditions the basolateral NHE-1 maintains a basal activity that is involved in maintaining steady-state pHi in TRCs. We reasoned that during acid stimulation NHE-1 must be involved in pHi recovery. If this is the case, then inhibiting the basal NHE-1 activity with zoniporide should enhance CT responses to acid stimulation. To test this hypothesis, we monitored CT responses to 20mm HCl (SHCl; Table 2; pH 1.7), 10mm acetic acid adjusted to pH 6.1 with potassium acetate (SAA; Table 2), and dissolved CO2 (SCO2; pH 7.4; Table 2), before and after the topical lingual application of 250μm zoniporide. The numerical value of an integrated CT response to a particular acid stimulus was obtained in the quasi-steady-state part of the response (i.e. during the adaptation phase), as the area under the integrated CT response curve for a time interval of 1 min, measured from the end of a typical 2min stimulation period (see Methods). Stimulating the tongue with HCl, acetic acid, and CO2 increased CT responses (Fig. 6A) relative to the corresponding rinse solutions: RHCl, RAA, and RCO2, respectively (Table 2) (Lyall et al. 2001, 2002a, b). As predicted from in vitro studies, the topical application of 250μm zoniporide enhanced the CT responses to CO2 by 45% (Fig. 6A, lower panel) and acetic acid by 154% (Fig. 6A, middle panel). However, no changes in the CT response to HCl were observed after zoniporide treatment (Fig. 6A, top panel). The mean data from four individual animals are summarized in Fig. 6B. The topical lingual application of zoniporide increased the normalized CT responses to acetic acid and CO2 by 111±19% (P<0.01) and 57.0±8.6%(P<0.01; paired; N=4), respectively, relative to control. No significant changes in HCl CT responses were observed after zoniporide treatment.
Figure 6. Effect of zoniporide on the CT responses to HCl, CO2 and acetic acid.
A, the CT responses were recorded at zero current-clamp (0cc) under control conditions (control), and after the topical lingual application of 250μm zoniporide (Post-zoniporide). The tongue was stimulated with 20mm HCl (SHCl), 10mm acetic acid titrated to pH 6.1 with potassium acetate (SAA), and CO2/HCO3− buffer, pH 7.4 (SCO2). The corresponding rinse solutions were: RHCl, RAA, and RCO2, respectively (Table 2). B summarizes mean data from 4 individual experiments. The CT responses to acidic stimuli were normalized to 300mm NH4Cl stimulation in each experiment. The open bars represent normalized CT responses under control conditions and hatched bars represent the corresponding CT responses postzoniporide treatment. The normalized CT responses are presented as mean±s.e.m. values from 4 animals (N). *P<0.01.
An increase in TRC [Ca2+]i alkalinizes resting pHi, accelerates the spontaneous pHi recovery rate from a basolateral NH4Cl pulse (cf. Figure 5), and increases neural adaptation to HCl stimulation (Lyall et al. 2002a). We reasoned that if NHE-1 is involved in neural adaptation, topical application of zoniporide should inhibit the Ca2+-induced increase in neural adaptation to acid stimulation.
Effect of ionomycin on CT responses to acidic stimuli
Consistent with our previous studies (Lyall et al. 2002a), topical lingual application of ionomycin + 10mm CaCl2 (Fig. 7, lower panel, middle trace) did not affect the phasic part of the CT response to 20mm HCl (e–f versus a–b), but it decreased the tonic part of the CT response to 50% of its initial level within 1min (f–g versus b–c). In order to investigate, if ionomycin affects the tonic phase of the CT responses to strong acids only, or if its effects can be generalized also to weak organic acids, CT responses were also recorded with CO2 and acetic acid.
In Fig. 7 (upper panel) stimulating the tongue with dissolved CO2 at pH 7.4 (SCO2; Table 2) increased the CT response (a–b–c) relative to the rinse solution (RCO2; pH 7.4; Table 2). CO2 diffuses across the apical membranes of TRCs, and once inside the cells, is converted to H2CO3 by carbonic anhydrases in TRCs, which dissociates into H++ HCO3−. Thus at constant external pH (pHo), the generation of acid equivalents inside the cells elicits a CT response. This is consistent with the observation that topical lingual application of the membrane-permeant blockers of carbonic anhydrases, inhibit CT responses to CO2 (Lyall et al. 2001, 2002a). Topical lingual application of ionomycin + 10mm CaCl2 (Fig. 7, upper panel, middle trace) did not affect the initial CT response to dissolved CO2 (e–f versus a–b) but the response declined to 30% of its initial level within 1min (f–g versus b–c).
In Fig. 7 (middle panel) stimulating the tongue with acetic acid (AA) solution (SAA, pH 6.1; Table 2) increased the CT response (a–b–c) relative to the rinse solution (RAA; Table 2). The undissociated acetic acid diffuses across the apical membranes of TRCs, and once inside the cells, dissociates into H++ acetate anion. Thus at constant pHo, the generation of acid equivalents inside the cells elicits a CT response. Topical lingual application of ionomycin + 10mm CaCl2 (middle panel, middle trace) did not affect the initial CT response to acetic acid (e–f versus a–b), but it declined to 50% of its initial level within 1min (f–g versus b–c).
The ionomycin effects were completely reversible (Lyall et al. 2002a). Upon suffusing the tongue with rinse solution without ionomycin for 5 min, control level responses to HCl, CO2, and acetic acid were restored (data not shown). Taken together, the above results indicate that ionomycin reversibly increases the neural adaptation to both strong and weak acid stimuli, and that the ionomycin effects are independent of the pH of the acidic stimuli.
Effect of zoniporide on the CT responses to acidic stimuli
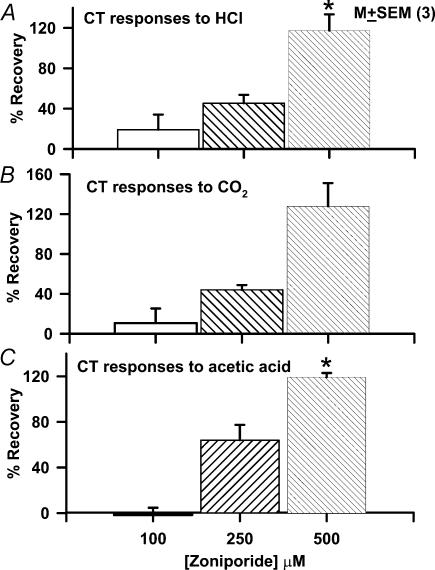
To test if ionomycin induces its effects via the activation of the basolateral NHE-1, we further investigated the effect of ionomycin on the CT responses to acid stimulation in the presence of zoniporide. Ionomycin (150μm) was topically applied to the tongue together with varying concentrations of zoniporide (0–500μm) for 45 min. Data summarized in Fig. 7 also show that when 150μm ionomycin was applied together with 500μm zoniporide, ionomycin failed to produced the observed neural adaptation in the CT responses to CO2 (upper panel; right trace), acetic acid (middle panel; right trace), and HCl (bottom panel; right trace) stimulation. Thus, in the presence of zoniporide, the inhibition of the NHE-1 activity results in the CT responses to HCl, CO2 and acetic acid, which were not different from control (i–j–k versus a–b–c). Stated another way, in the presence of zoniporide, the ionomycin-induced changes in the CT responses recover to near control levels. The effect of zoniporide was dose dependent (Fig. 8). The percentage recovery of the tonic part of the CT response to acids, in the presence of zoniporide, was calculated as follows:
Figure 8. Effect of varying zoniporide concentration on the ionomycin-induced changes in CT responses to acid stimulation.
The CT responses to acidic stimuli were recorded under control conditions (Control), after the topical lingual application of 150μm ionomycin (Ionomycin), and following topical lingual application of zoniporide (100, 250, and 500μm) + 150μm ionomycin (Zoniporide). All rinse (R) and test solutions (S) contained, in addition, 10mm CaCl2. The percentage recovery of the tonic part of the normalized CT response to 20mm HCl (A), CO2 (B), and 10mm acetic acid (C) was calculated at each zoniporide concentration for each individual animal (see text for details). The percentage recovery was expressed as the mean ± s.e.m. of 3 animals (N) at each zoniporide concentration. *P<0.01 (paired).
where, CTC, CTI and CTZ are the normalized CT responses to a particular acid stimulation under control conditions (C), after topical application of ionomycin alone (I), and after ionomycin + zoniporide treatment (Z), respectively. At a zoniporide concentration of 100, 250 and 500μm the tonic part of the CT responses to HCl recovered by 19.2±15.0% (P>0.05), 45.3±8.4% (P <0.05) and 117.4±16.0% (P <0.01; N =3; paired), respectively, relative to ionomycin alone (Fig. 8A). The corresponding recoveries for CT responses to CO2 were 10.7±14.6% (P >0.05), 44.0±4.9% (P <0.01) and 127.9±23.1% (P<0.05; N =3; paired), respectively, relative to ionomycin alone (Fig. 8B). The corresponding recoveries for CT responses to acetic acid were –1.7±6.4% (P>0.05), 64.0±13.5% (P<0.05) and 119.3±3.7% (P<0.01; N =3; paired), respectively, relative to ionomycin alone (Fig. 8C). These results demonstrate that at the zoniporide concentration that causes maximum inhibition of the NHE-1 activity, neural adaptation to acid stimulation is abolished completely.
Independence of cAMP and Ca+ effects on the CT responses to acid stimulation
In polarized TRCs, stimulating the apical membrane with HCl produced a decrease in pHi, and treating TRCs with cAMP, increased the magnitude of the HCl-induced decrease in pHi (Lyall et al. 2002a). In parallel in vivo experiments, stimulating the tongue with HCl elicited CT responses at zero current-clamp (0cc) that were voltage-insensitive. The topical lingual application of the membrane-permeant form of the cAMP (8-CPT-cAMP) increased the magnitude of the CT responses to HCl relative to control and the post-cAMP CT responses to HCl demonstrated significant voltage sensitivity (Lyall et al. 2002a). However, at present it is not clear if (i) cAMP also enhances the CT responses to weak organic acids, (ii) cAMP and Ca2+ act independently to modulate the phasic and tonic part of the CT response to acids, and (iii) cAMP and Ca2+ have antagonistic effects on the neural adaptation to acid stimulation.
Data summarized in Fig. 9 show that under zero current-clamp (0cc), topical lingual application of 8-CPT-cAMP enhanced the CT response to 20mm HCl by approximately twofold, but had no effect on the CT responses to CO2 (pH 7.4) and acetic acid (pH 6.1) relative to control. These results indicate that cAMP specifically modulates the H+ flux across the apical membranes of TRCs. In contrast to fully dissociated strong acids (e.g. HCl), cAMP does not affect the passive flux of the undissociated form of the weak organic acids (acetic acid and CO2) across the apical membranes of taste cells. In addition, cAMP had no effect on the tonic component of the CT responses to HCl, acetic acid or CO2.
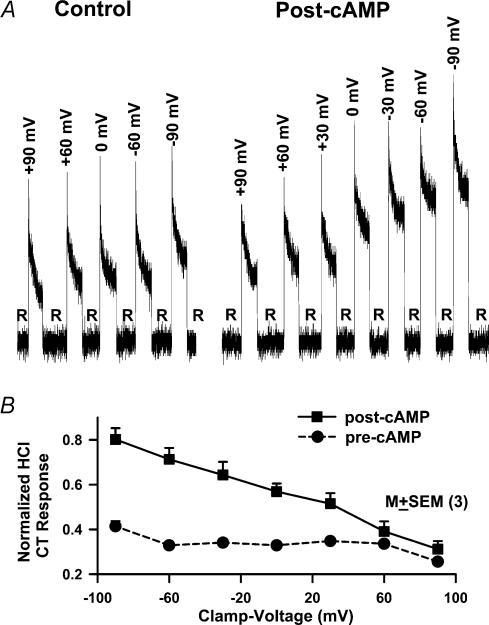
We monitored CT responses to 20mm HCl under zero current-clamp (0cc) and between –90mV and +90mV lingual voltage-clamp conditions before and after cAMP treatment. As reported before (Lyall et al. 2002a), HCl CT responses did not demonstrate voltage sensitivity at ±60mV. However, at ±90mV the CT responses demonstrated small, but significant, voltage sensitivity, increasing at –90mV and decreasing at +90mV relative to 0cc (0mV; Fig. 10A). The topical lingual application of 8-CPT-cAMP enhanced the CT responses to HCl relative control at 0cc, and the post-cAMP HCl CT responses became significantly voltage-sensitive at ±30, ±60mV and ±90mV. Figure 10B summarizes data from three individual animals in which the voltage sensitivity of the CT responses was investigated between –90mV and +90mV, before and after cAMP treatment. The data demonstrate that under control conditions (pre-cAMP), the CT responses to HCl do not demonstrate voltage sensitivity between –60 and +60mV applied voltage-clamp. The voltage sensitivity was only observed when the clamp voltage was increased to ±90mV. At –90mV the HCl CT responses increased and at +90mV voltage-clamp decreased relative to 0cc. The post-cAMP CT responses to HCl were enhanced at 0cc relative to control and demonstrated a near linear relationship between –90 and +90mV applied voltage-clamp and CT activity. The data demonstrate that cAMP activates an apical H+ conductive pathway in TRCs. This apical H+ conductive pathway is both amiloride- and Ca2+-insensitive (Lyall et al. 2002a).
Figure 10. Effect of lingual voltage-clamp on HCl CT responses.
A, the CT responses to 20mm HCl were recorded under zero current-clamp conditions (0cc), at ±30mV, ±60mV and ±90mV. Rinse (R)=10mm KCl. B, the CT responses to 20mm HCl were recorded before (precAMP; •) and after the topical lingual application of 8-CPT-cAMP (postcAMP; ▪) under lingual voltage-clamp conditions between –90mV and +90mV. Values are presented as means±s.e.m. of 3 animals (N). R=rinse solution.
Similar to the case under control conditions (cf. Fig. 7), data summarized in Fig. 11 show that post-cAMP CT responses to HCl, CO2 and acetic acid are also subject to regulation by TRC [Ca2+]i. Topical lingual application of 8-CPT-cAMP + ionomycin, induced a rapid neural adaptation of CT responses to HCl, CO2, and acetic acid relative to post-cAMP alone. Similar results were obtained in two additional animals (data not shown). These data suggest that both cAMP and [Ca2+]i modulate CT responses to acidic stimuli independently. While cAMP activates H+ entry across the apical membranes of TRCs, and enhances the phasic part of the CT response to HCl, an increase in [Ca2+]i activates basolateral NHE-1, and increases neural adaptation to both strong and weak acid stimulation.
Discussion
The CT response profiles for acidic stimuli are composed of a phasic and a tonic response. While several factors may be involved in determining the overall CT response profile to acidic stimuli, the data presented in this study demonstrate that the phasic and tonic parts of the CT response are largely determined by the entry of acid equivalents across the apical membrane and the exit of H+ across the basolateral membrane of TRCs via the NHE-1, respectively. The H+ conductive pathway in the apical membrane and the basolateral NHE-1 activity are regulated differentially by second messengers (cAMP or Ca2+) and pharmacological agents (zoniporide), and thus can be studied as separate entities.
In polarized TRCs, stimulating the apical membrane with acidic stimuli induced sustained decreases in pHi (Lyall et al. 2001, 2002a, b). Thus both strong acids and weak organic acids gain entry into TRCs across the apical cell membrane and induce a decrease in pHi. Weak organic acids permeate the apical membrane as neutral molecules, and strong acids via an H+ entry pathway that is both amiloride- and Ca2+-insensitive, but is activated by cAMP (Lyall et al. 2001, 2002a, b; DeSimone et al. 2001b). During acid stimulation, a decrease in TRC pHi, rather than a decrease in pHo, is the stimulus intensity variable that correlates specifically with increased CT taste nerve activity. Since inhibiting acid-induced TRC acidification also inhibits the acid-evoked CT response (Lyall et al. 2001, 2002b), it indicates that a decrease in TRC pHi is the proximate stimulus for sour taste.
The data further demonstrate that TRC pH regulatory mechanisms play an important role in the neural adaptation to acidic stimuli (Lyall et al. 2002a; Vinnikova et al. 2004). The functional characteristics of the basolateral NHE-1, as they relate to TRC pHi regulation and its role in sour taste transduction are discussed below.
Role of basolateral NHE-1 in TRC pHi regulation
Our pH- and Na+-imaging studies (Vinnikova et al. 2004) demonstrated that in TRCs, basolateral NHE-1 is functional in the nominal absence of CO2/HCO3−. At the physiological pH, NHE-1 activity is low. Thus, under control conditions, i.e. in the absence of an acid stimulus, TRCs regulate their pHi by maintaining a balance between the generation of intracellular H+ due to metabolic activity and the exit of intracellular acid equivalents from the cells, in part, by the basolateral NHE-1 (Vinnikova et al. 2004). At constant pHo, it is activated by intracellular acidification and by the Na+ concentration in the basolateral compartment. However, changes in pHo have an opposite effect on the basolateral NHE-1. An increase in basolateral pH enhanced, and a decrease in basolateral pH attenuated, the NHE-1 activity. Here, we demonstrate that NHE-1 activity is inhibited by zoniporide, a novel specific blocker of NHE-1 (cf. Figs 1–5). Cariporide (HOE 642), another specific blocker of NHE-1 activity, and amiloride, a non-specific blocker of NHEs, also inhibit NHE-1 activity in TRCs (Vinnikova et al. 2004).
Similar to the case in other tissues (Josette & Pouysségur, 1995; Ritter et al. 2001), in TRCs the basolateral NHE-1 activity is regulated by [Ca2+]i. Treating the basolateral membrane of polarized TRCs with ionomycin, a Ca2+ ionophore, increased [Ca2+]i, alkalinized resting pHi, and increased the spontaneous recovery of pHi from an NH4Cl pulse. Both the ionomycin-induced alkalinization and the increase in pHi recovery rate were blocked by zoniporide (Fig. 5).
Role of basolateral NHE-1 during acid stimulation
The topical lingual application of zoniporide enhanced the CT response to CO2 and acetic acid by 57% and 111%, respectively, relative to control (Fig. 6B). In contrast, HCl responses were not affected by zoniporide. The fact that zoniporide only enhanced the CT responses to CO2 and acetic acid, but not to HCl, is related to the pH of the acidic stimuli. The tongue was stimulated with CO2 solutions at the physiological pH of 7.4, and with acetic acid solutions that were adjusted to pH 6.1. In contrast, 20mm HCl stimulating solutions were at a pH of 1.7. We have previously shown that a decrease in pHo inhibits NHE-1 activity (Vinnikova et al. 2004). Similar dependence of NHE activity on pHo has been reported in other cells (Vaughan-Jones & Wu, 1990). Upon acidification of the basolateral compartment, protons bind to the external H+ binding site on the NHE-1 and inhibit its activity. Similarly, a decrease in apical pH inhibits the NHE-1 activity; however, the mechanism of inhibition is more complex, and most likely involves changes in cell volume and/or changes in cytoskeleton of the cell (Vinnikova et al. 2004). Thus, it follows that, during HCl stimulation at pHo 1.7, the basolateral NHE-1 activity is already inhibited and zoniporide treatment does not produce additional inhibition of the exchanger. In contrast, at pH 7.4 or 6.1, the basolateral NHE-1 still retains its basal activity, which can be blocked by zoniporide, eliciting increased CT responses to CO2 and acetic acid stimulation relative to control.
Effect of NHE-1 activation on CT responses to acid stimulation
The Ca2+-induced increase in NHE-1 activity has important consequences for both TRC pHi regulation in vitro and the CT responses during acid stimulation in vivo (Lyall et al. 2002a). Stimulating the apical membrane with HCl induced a sustained decrease in TRC pHi. However, upon NHE-1 stimulation with ionomycin, the HCl-induced decrease in TRC pHi was transient and demonstrated rapid recovery towards its baseline value (Lyall et al. 2002a). Consistent with these in vitro results, topical lingual application of ionomycin, did not alter the initial magnitude of the CT responses to HCl (the phasic part of the CT response) but greatly accelerated the adaptation phase (tonic phase) of the neural response (Figs 7 and 8). The data further demonstrate that these effects of ionomycin can be generalized to strong acids, as well as to weak organic acids, such as CO2 and acetic acid. The ionomycin-induced enhanced adaptation in the CT response was independent of pHo and the accompanying anion. Although, these data are sufficient to demonstrate that the activation of a pH recovery mechanism in TRCs results in the rapid adaptation of the neural response to acid stimulation, they do not, by themselves, prove that the basolateral NHE-1 is involved in this process.
The additional proof that it is indeed the activation of basolateral NHE-1 that brings about the neural adaptation comes from our studies with zoniporide. Under control conditions, topical lingual application of zoniporide, increased CT responses to CO2 and acetic acid. In addition, zoniporide pretreatment reversed the ionomycin-induced increase in the adaptation phase of the CT responses to HCl, CO2 and acetic acid, in a dose-dependent manner. At a zoniporide concentration of 500μm, the CT responses to all three acidic stimuli, following ionomycin treatment, were at or exceeded control level responses. Thus at zoniporide concentrations that cause complete inhibition of the basolateral NHE-1 activity, an increase in TRC [Ca2+]i failed to enhance its activity and abolished high [Ca2+]i-induced neural adaptation.
Recent studies indicate that acid responses occur in a subset of TRCs that participate in sour taste transduction. There are significant variations in the resting pHi values in individual ROIs within a taste bud. TRCs can be separated into two distinct populations based on their initial value of resting pHi. One subset of TRCs demonstrated a normal distribution with a mean pHi of around 7.2. The second subset demonstrated a skewed distribution with a mean pHi of around 7.45 (Vinnikova et al. 2004). It is suggested that TRCs having relatively more alkaline resting pHi values, and consequently lower buffer capacity (β1) values, will produce greater decreases in pHi when stimulated with acids.
In polarized taste bud preparations, stimulating with apical acetic acid or HCl at pH 3.0, produced significantly different regional changes in TRC pHi. At the same pH acetic acid produced a greater mean decrease in TRC pHi compared to HCl. The changes in pHi varied widely within different ROIs after treatment with the two acids. After HCl treatment 34.5% of ROIs responded with a decrease in pHi>0.3 pH unit. It is likely that TRCs in the ROIs that respond with the greatest decrease in pHi participate most in sour transduction. In contrast, after acetic acid treatment, 91.4% of ROIs responded with a decrease in pHi>0.3 pH unit (Lyall et al. 2001). The data suggest that HCl-induced CT responses are elicited by a subpopulation of TRCs contained in different ROIs within the taste bud that contain an apical H+ entry mechanism. This conclusion is further supported by the observations that cAMP increases H+ conductive entry across the apical membranes of TRCs (Fig. 10) and enhanced CT responses to HCl stimulation without affecting responses to acetic acid or CO2 (Fig. 9). In contrast, for acetic acid, the influx of acid equivalents into TRCs is augmented by a significant flow of unionized acetic acid that results in a greater CT response relative to HCl (Lyall et al. 2001).
Although stimulating the apical membrane with acid stimuli decreases pHi in a significant number of TRCs within the taste bud, only a subset of TRCs respond with a decrease in pHi and a concomitant increase in [Ca2+]i (Liu & Simon, 2001; Richter et al. 2003; Lyall et al. 2003). Since an increase in [Ca2+]i is a prerequisite for the release of neurotransmitter, it is suggested that this subset of TRCs participate in sour taste transduction within the taste bud. Thus, it is likely that an acid-induced increase in TRC [Ca2+]i subsequently activates the basolateral NHE-1 and brings about pHi recovery and serves as a source of neural adaptation.
In a subset of TRCs in which an acid-induced decrease in pHi is not accompanied by a concomitant increase in [Ca2+]i, changes in pHi may participate in mixture interactions and/or in modulating responses to other taste modalities. We have previously shown that in TRCs containing ENaC, changes in pHi modulate amiloride-sensitive apical Na+ entry and the rat CT responses to NaCl (Lyall et al. 2002b).
Our studies further suggest that cAMP and [Ca2+]i modulate CT responses to acids independently (Figs 9–11). Cyclic AMP enhanced the phasic part of the CT responses to HCl, but had no effect on the CT responses to CO2 and acetic acid. The observed voltage sensitivity of the post-cAMP CT responses to HCl suggest that cAMP activates an apical H+ conductance. However, cAMP does not affect the passive apical entry of the undissociated weak organic acids. In contrast, changes in [Ca2+]i modulate the tonic part of the CT response to both strong and weak organic acids. Since in the presence of cAMP, topical lingual application of ionomycin enhanced neural adaptation to HCl stimulation, we conclude that the effects of [Ca2+]i are independent of those due to cAMP. This is consistent with the concept that the sites of action of [Ca2+]i and cAMP are different, non-interacting cellular entities, i.e. the basolateral NHE1 and an apical H+ conducting pathway, respectively.
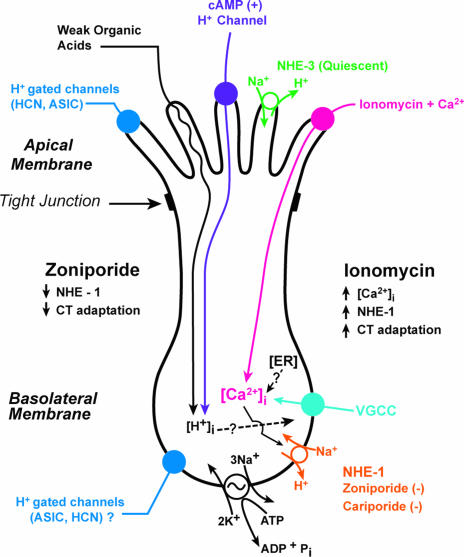
The main conclusions of the paper and the proposed mechanisms for the regulation of neural adaptation are summarized in a schematic diagram (Fig. 12). The apical cell membranes of TRCs contain acid entry mechanisms. In the case of fully dissociated strong acids, H+ ions enter across the apical membrane of TRCs via an amiloride- and Ca2+-insensitive, but cAMP-sensitive H+ pathway (Lyall et al. 2002a). Weak organic acids, such as acetic acid and dissolved CO2, enter across the apical membrane as neutral molecules and decrease pHi by generating intracellular acid equivalents. In the case of CO2, the dissolved gas is converted to H2CO3 by intracellular carbonic anhydrases, subsequently, yielding H++ HCO3−. However, there is some evidence that H+-gated channels, such as the acid-sensing ion channel (ASIC) in the apical membrane of TRCs (Ugawa et al. 1998; Lin et al. 2002), and both ASIC (Ugawa et al. 1998; Lin et al. 2002) and hyperpolarization-activated channels (HCN) (Stevens et al. 2001) in the basolateral membranes of TRCs may also play a role in sour taste transduction. These channels in the basolateral membrane could be activated if H+ ions can cross the tight junctions and decrease pHi in the basolateral compartment.
Figure 12. Proposed model for the mechanism of neural adaptation to acidic stimuli.
Our data suggest that the basolateral NHE-1 is involved in neural adaptation during sour taste transduction. Acidic stimuli applied to the lingual surface induce a decrease in TRC pHi as a result of the entry of acid equivalents across the apical cell membranes of TRCs. The apical membranes of TRCs exhibit an amiloride- and Ca2+-insensitive, cAMP-dependent H+ conductive pathway for strong acids (purple). In contrast, weak organic acids permeate across the apical membranes passively as undissociated molecules. The pHi recovery occurs, in part, due to the presence of zoniporide- and cariporide-sensitive basolateral NHE-1. Although NHE-3 is present in the apical membranes of TRCs, under our experimental conditions the NHE-3 seems to be quiescent, and does not participate in pHi regulation in TRCs (green). In the model the pathways for the apical entry and the basolateral exit of acid equivalents are shown in a single TRC. However, within a taste bud, TRCs are heterogeneous, and it is quite likely that not all of the above components are present in all cells. The favourable Na+ gradient for the Na+–H+ exchangers is maintained by the basolateral Na+–K+-ATPase. An increase in TRC [Ca2+]i induced by ionomycin, activates basolateral NHE-1, increasing the neural adaptation in CT responses to acidic stimuli. Zoniporide, a specific blocker of NHE-1, increased the magnitude of the CT responses to acidic stimulation under control conditions, and completely reversed the ionomycin-induced increase in neural adaptation to acidic stimuli. We conclude that during sour taste transduction the basolateral NHE-1 plays an important role in determining the adaptation (tonic) phase of the CT taste nerve responses to acidic stimuli.
The H+ exit from the cells occurs in part, via the zoniporide-sensitive basolateral NHE-1. The accompanying Na+ ions exit TRCs via the basolateral ouabain-sensitive Na+–K+-ATPase. We have previously demonstrated the presence of mRNA transcripts for NHE-3 in TRCs and the specific binding of NHE-3 antibodies to the apical membranes of TRCs; however, under the experimental conditions examined so far, the apical NHE-3 appears to be quiescent and does not contribute to pHi regulation in TRCs (Vinnikova et al. 2004). Although the model depicts the presence of acid entry and exit pathways in a single TRC, it must be emphasized that within a taste bud, TRCs are heterogeneous, and it is likely that not all of the above mechanisms are present in all taste cells. Topical lingual application of ionomycin + CaCl2, increases TRC [Ca2+]i and results in the activation of basolateral NHE-1. The activation of NHE-1 results in an acid-induced decrease in pHi that is transient, i.e. recovers spontaneously, leading to a rapid adaptation in the CT responses to acid stimulation. However, topical lingual application of zoniporide, a specific NHE-1 blocker, reverses the observed adaptation in CT responses to acid stimulation. Taken together, the data indicate that in TRCs, a basolateral NHE-1 is involved in neural adaptation to acidic stimuli. Recent, studies (Liu & Simon, 2001; Richter et al. 2003; Lyall et al. 2003) suggest that in a subset of TRCs an acid-induced decrease in pHi is accompanied by an increase in TRC [Ca2+]i. It is likely that an increase in TRC [Ca2+]i activates basolateral NHE-1 and increases neural adaptation.
Acknowledgments
This work was supported by National Institute on Deafness and Other Communication Disorders Grants DC-02422 and DC-00122. We thank Ms Victoria A. Bickel for help with art work.
References
- Béhé P, DeSimone JA, Avenet P, Lindemann B. Membrane currents in taste cells of the rat fungiform papilla. Evidence for two types of Ca currents and inhibition of K currents by saccharin. J General Physiol. 1990;96:1061–1084. doi: 10.1085/jgp.96.5.1061. [DOI] [PMC free article] [PubMed] [Google Scholar]
- Chu S, Brownell WE, Montrose MH. Quantitative confocal imaging along the crypt-to-surface axis of colonic crypts. Am J Physiol Cell Physiol. 1995;269:C1557–C1564. doi: 10.1152/ajpcell.1995.269.6.C1557. [DOI] [PubMed] [Google Scholar]
- DeSimone JA, Lyall V, Heck GL, Feldman GM. Acid detection by taste receptor cells. Respir Physiol. 2001b;129:231–245. doi: 10.1016/s0034-5687(01)00293-6. [DOI] [PubMed] [Google Scholar]
- DeSimone JA, Lyall V, Heck GL, Phan THT, Alam RI, Feldman GM, Buch RM. A novel pharmacological probe links the amiloride-insensitive NaCl, KCl, and NH4Cl chorda tympani taste responses. J Neurophysiol. 2001a;86:2638–2641. doi: 10.1152/jn.2001.86.5.2638. [DOI] [PubMed] [Google Scholar]
- Guzman-Perez A, Wester RT, Allen MC, Brown JA, Buchholz AR, Cook ER, Day WW, Hamanaka ES, Kennedy SP, Knight DR, et al. Discovery of zoniporide: a potent and selective sodium-hydrogen exchanger type 1 (NHE-1) inhibitor with high aqueous solubility. Bioorg Med Chem Lett. 2001;11:803–807. doi: 10.1016/s0960-894x(01)00059-2. [DOI] [PubMed] [Google Scholar]
- Lin W, Ogura T, Kinnamon SC. Acid-activated cation currents in rat vallate taste receptor cells. J Neurophysiol. 2002;88:133–141. doi: 10.1152/jn.2002.88.1.133. [DOI] [PubMed] [Google Scholar]
- Liu L, Simon SA. Acidic stimuli activates two distinct pathways in taste receptor cells from rat fungiform papillae. Brain Res. 2001;923:58–70. doi: 10.1016/s0006-8993(01)03190-0. [DOI] [PubMed] [Google Scholar]
- Lyall V, Alam RI, Phan DQ, Ereso GL, Phan THT, Malik SA, Montrose MH, Chu S, Heck GL, Feldman GM, DeSimone JA. Decrease in rat taste receptor cell intracellular pH is the proximate stimulus in sour taste transduction. Am J Physiol Cell Physiol. 2001;281:C1005–C1013. doi: 10.1152/ajpcell.2001.281.3.C1005. [DOI] [PubMed] [Google Scholar]
- Lyall V, Alam RI, Phan THT, Phan DQ, Heck GL, DeSimone JA. Excitation and adaptation in the detection of hydrogen ions by taste receptor cells: a role for cAMP and Ca2+ J Neurophysiol. 2002a;87:399–408. doi: 10.1152/jn.00331.2001. [DOI] [PubMed] [Google Scholar]
- Lyall V, Alam RI, Phan THT, Russell OF, Malik SA, Heck GL, DeSimone JA. Modulation of rat chorda tympani NaCl responses and intracellular Na+ activity in polarized taste receptor cells by pH. J General Physiol. 2002b;120:793–815. doi: 10.1085/jgp.20028656. [DOI] [PMC free article] [PubMed] [Google Scholar]
- Lyall V, Heck GL, DeSimone JA, Feldman GM. Effect of osmolarity on taste receptor cell size and function. Am J Physiol Cell Physiol. 1999;277:C800–C813. doi: 10.1152/ajpcell.1999.277.4.C800. [DOI] [PubMed] [Google Scholar]
- Lyall V, Malik SA, Alam RI, Heck GL, DeSimone JA. Relationship between intracellular pH and Ca2+ in fungiform rat taste receptor cells. Chem Senses. 2003;28:A83. [Google Scholar]
- Noel J, Pouysségur J. Hormonal regulation, pharmacology, and membrane sorting of vertebrate Na+/H+ exchange isoforms. Am J Physiol Cell Physiol. 1995;268:C283–C296. doi: 10.1152/ajpcell.1995.268.2.C283. [DOI] [PubMed] [Google Scholar]
- Orlowski J, Grinstein S. Na+/H+ exchangers of mammalian cells. J Biol Chem. 1997;272:22373–22376. doi: 10.1074/jbc.272.36.22373. [DOI] [PubMed] [Google Scholar]
- Pfaffmann C. Gustatory nerve impulses in rat, cat, and rabbit. J Neurophysiol. 1955;18:429–440. doi: 10.1152/jn.1955.18.5.429. [DOI] [PubMed] [Google Scholar]
- Richter TA, Caicedo A, Roper SD. Sour taste stimuli evoke Ca2+ and pH responses in mouse taste cells. J Physiol. 2003;547:475–483. doi: 10.1113/jphysiol.2002.033811. [DOI] [PMC free article] [PubMed] [Google Scholar]
- Ritter M, Fuerst J, Wöll E, Chwatal S, Gschwentner M, Lang F, Deetjen P, Paulmichl M. Na+/H+ exchangers: linking osmotic dysequilibrium to modify cell function. Cell Physiol Biochem. 2001;11:1–18. doi: 10.1159/000047787. [DOI] [PubMed] [Google Scholar]
- Roos A, Boron WF. Intracellular pH. Physiol Rev. 1981;61:296–434. doi: 10.1152/physrev.1981.61.2.296. [DOI] [PubMed] [Google Scholar]
- Scholz W, Albus U, Counillon L, Gögelein H, Lang HJ, Linz W, Weichert A, Schölkens BA. Protective effects of HOE642, a selective sodium-hydrogen exchange subtype 1 inhibitor, on cardiac ischaemia and reperfusion. Cardiovasc Res. 1995;29:260–268. [PubMed] [Google Scholar]
- Simon SA. Interactions between salt and acid stimuli: a lesson in gustation from simultaneous epithelial and neural recordings. J General Physiol. 2002;120:787–791. doi: 10.1085/jgp.20028735. [DOI] [PMC free article] [PubMed] [Google Scholar]
- Smith DV, Bealer SL. Sensitivity of the rat gustatory system to the rate of stimulus onset. Physiol Behav. 1975;15:303–314. doi: 10.1016/0031-9384(75)90098-0. [DOI] [PubMed] [Google Scholar]
- Smith DV, Bealer SL, Van Buskirk RL. Adaptation and recovery of the rat chorda tympani response to NaCl. Physiol Behav. 1978;20:629–636. doi: 10.1016/0031-9384(78)90256-1. [DOI] [PubMed] [Google Scholar]
- Stevens DR, Seifert R, Bufe B, Muller F, Kremmer E, Gauss R, Meyerhof W, Kaupp UB, Lindemann B. Hyperpolarization-activated channels HCN1 and HCN4 mediate responses to sour stimuli. Nature. 2001;413:631–635. doi: 10.1038/35098087. [DOI] [PubMed] [Google Scholar]
- Ugawa S, Minami Y, Guo W, Saishin Y, Takatsuji K, Yamamoto T, Tohyama M, Shimada S. Receptor that leaves a sour taste in the mouth. Nature. 1998;395:555–556. doi: 10.1038/26882. [DOI] [PubMed] [Google Scholar]
- Vaughan-Jones RD, Wu ML. Extracellular H+ inactiviation of Na+–H+ exchange in the sheep cardiac Purkinje fibres. J Physiol. 1990;428:441–466. doi: 10.1113/jphysiol.1990.sp018221. [DOI] [PMC free article] [PubMed] [Google Scholar]
- Vinnikova AK, Alam RI, Malik SA, Ereso GL, Feldman GM, McCarty JM, Knepper MA, Heck GL, DeSimone JA, Lyall V. Na+-H+ exchange activity in taste receptor cells. J Neurophysiol. 2004;91:1297–1313. doi: 10.1152/jn.00809.2003. [DOI] [PubMed] [Google Scholar]
- Wakabayashi S, Shigekawa M, Pouysségur J. Molecular physiology of vertebrate Na+/H+ exchangers: a review. Physiol Rev. 1997;77:51–74. doi: 10.1152/physrev.1997.77.1.51. [DOI] [PubMed] [Google Scholar]
- Ye Q, Heck GL, DeSimone JA. Voltage dependence of the rat chorda tympani responses to Na+ salts: implications for the functional organization of taste receptor cells. J Neurophysiol. 1993;70:167–178. doi: 10.1152/jn.1993.70.1.167. [DOI] [PubMed] [Google Scholar]
- Ye Q, Heck GL, DeSimone JA. Effects of voltage perturbations of the lingual receptive field on chorda tympani responses to Na+ and K+ salts. J General Physiol. 1994;10:885–907. doi: 10.1085/jgp.104.5.885. [DOI] [PMC free article] [PubMed] [Google Scholar]


