Abstract
In vivo, most vasopressin cells of the hypothalamic supraoptic nucleus fire action potentials in a ‘phasic’ pattern when the systemic osmotic pressure is elevated, while most oxytocin cells fire continuously. The phasic firing pattern is believed to arise as a consequence of intrinsic activity-dependent changes in membrane potential, and these have been extensively studied in vitro. Here we analysed the discharge patterning of supraoptic nucleus neurones in vivo, to infer the characteristics of the post-spike sequence of hyperpolarization and depolarization from the observed spike patterning. We then compared patterning in phasic cells in vivo and in vitro, and we found systematic differences in the interspike interval distributions, and in other statistical parameters that characterized activity patterns within bursts. Analysis of hazard functions (probability of spike initiation as a function of time since the preceding spike) revealed that phasic firing in vitro appears consistent with a regenerative process arising from a relatively slow, late depolarizing afterpotential that approaches or exceeds spike threshold. By contrast, in vivo activity appears to be dominated by stochastic rather than deterministic mechanisms, and appears consistent with a relatively early and fast depolarizing afterpotential that modulates the probability that random synaptic input exceeds spike threshold. Despite superficial similarities in the phasic firing patterns observed in vivo and in vitro, there are thus fundamental differences in the underlying mechanisms.
In vivo, most magnocellular vasopressin cells of the hypothalamic supraoptic and paraventricular nuclei fire action potentials (spikes) in a distinctive ‘phasic’ pattern when the systemic osmotic pressure is elevated. Phasic firing comprises alternating periods of relatively stable activity and electrical silence, and this pattern optimizes the efficiency of stimulus—secretion coupling at the neurosecretory nerve terminals of these cells in the neurohypophysis (see Bourque & Renaud, 1990; Leng et al. 1999 for reviews). However, not all vasopressin cells fire phasically in vivo. Even after osmotic stimulation, some fire continuously, in a manner superficially like that of oxytocin cells (see Brimble & Dyball, 1977). It is not clear whether these non-phasic ‘vasopressin’ cells lack the intrinsic mechanisms that underlie phasic firing, or whether they are oxytocin cells misidentified as vasopressin cells through imprecision in functional identification.
Phasic firing has been studied extensively in in vitro preparations, and studies using intracellular or patch-clamp recording have provided much of our current understanding of how this activity is generated. In vitro, in many supraoptic neurones, spikes are followed by a fast hyperpolarizing afterpotential (HAP) (Bourque et al. 1985) and a superimposed, slower afterhyperpolarization (AHP) (Armstrong et al. 1994) that reflect activation of voltage- and Ca2+-dependent K+ conductances. The net hyperpolarization is followed in turn by a depolarization, reflecting further superposition of a slow Ca2+-dependent depolarizing afterpotential (DAP) (Andrew & Dudek, 1983). Phasic bursts appear to arise through summation of DAPs to form a plateau potential, and spikes generated from this plateau appear to arise regeneratively, as subsequent DAPs approach spike threshold independently of synaptic input (Andrew & Dudek, 1983; Roper et al. 2003). Whether synaptic input in the form of excitatory postsynaptic potentials (EPSPs) is necessary for phasic firing in vitro is unclear; phasic firing has been observed to persist after pharmacological blockade of synaptic transmission (Hatton, 1982), but, in vivo, phasic firing is inhibited by glutamate antagonists (Nissen et al. 1995).
All in vitro preparations of the supraoptic nucleus entail extensive deafferentation, for there is little or no direct synaptic connectivity between supraoptic neurones. The major sources of input are the brainstem, structures adjacent to the lamina terminalis of the third ventricle, and the immediate perinuclear zone (Hatton, 1990; Cunningham & Sawchenko, 1991; Armstrong, 1995). Some perinuclear projections are intact in slice preparations; more are intact in explant preparations, which also encompass the organum vasculosum of the lamina terminalis (OVLT). However, it seems surprising that the discharge patterning of vasopressin cells should be similar in vitro as in vivo despite deafferentation. This persuaded us to look more closely at phasic firing in vivo and in vitro.
We analysed supraoptic neurones in vivo, comparing activity in oxytocin cells with that observed in phasic cells within bursts, and in non-phasic ‘vasopressin’ cells. The functional significance of the HAP, AHP and DAP is thought to lie in their effects on spike patterning, and here we sought to work in the inverse direction — to infer the characteristics of the post-spike sequence of hyperpolarization and depolarization from the observed spike patterning. We then compared patterning in phasic cells in vivo and in vitro.
Methods
In vivo electrophysiology
Single neurones were recorded from the supraoptic nucleus of female rats under urethane anaesthesia (ethyl carbamate, 1.3 g kg−1i.p.), using conventional extracellular recording techniques. The supraoptic nucleus and neural stalk of the pituitary were exposed by transpharyngeal surgery; a bipolar stainless-steel electrode was placed on the neural stalk, and a glass microelectrode filled with 0.9% NaCl was introduced into the supraoptic nucleus under direct visual control (see Leng & Dyball, 1991). Neurones were identified anti-dromically as projecting to the neural stalk; all displayed positive-going action potentials (spikes), and for most cells, spikes displayed a distinct notch on the descending slope of the spike (Leng & Dyball, 1991). At the end of the experiments the rats were killed with an overdose of the anaesthetic.
Neurones were initially classified as phasically active (a distinguishing characteristic of vasopressin cells in vivo), or as non-phasic. Non-phasic cells were tested for their response to i.v. injection of cholecystokinin (CCK; sulphated octapeptide Sigma Chemical Co, Dorset, UK, 20 µg kg−1) (Renaud et al. 1987; Leng et al. 1991). Injection of CCK transiently increases oxytocin secretion and transiently decreases vasopressin secretion (Verbalis et al. 1986a,b). Most non-phasic cells respond to CCK injection with a transient increase in firing rate, and this response has previously been shown to be characteristic of oxytocin cells, functionally identified in suckled, lactating rats by their burst discharge correlated with reflex milk ejection (Leng et al. 1991). Some non-phasic cells, however, are inhibited by CCK injection, and since such neurones are not active during reflex milk ejection these seem likely to be vasopressin cells, despite the absence of phasic firing. The analyses described in this paper are of three populations of neurones; non-phasic cells, identified as oxytocin cells by their excitatory response to CCK; non-phasic cells, identified as putative vasopressin cells by their inhibitory response to CCK; and phasic cells. Phasic cells are generally accepted as predominantly vasopressin cells: in a meta-analysis of published work, Armstrong (1995) shows that, of 98 phasic cells observed through reflex milk ejection, only 8 appeared to be involved in reflex oxytocin secretion. Conversely, most cells activated during milk ejection do not fire phasically. Wakerley et al. (1978) studied oxytocin cells and vasopressin cells in lactating rats exposed to progressive dehydration; in these circumstances most vasopressin cells (52 of 57) fired phasically, but phasic firing was observed in only 3 of 59 oxytocin cells. Including the cells recorded in control conditions, reflex milk ejection was accompanied by milk-ejection bursts in only 3 of 56 phasic cells (5%). Phasic firing has also been observed in conscious rats (Summerlee, 1981), and again in these conditions is mainly seen in identified vasopressin cells.
In vitro electrophysiology
Male Sprague—Dawley rats (180–220 g) were stunned, decapitated and their brains were removed quickly. Coronal slices of 400 µm thickness were cut through the hypothalamus and prepared for recording in a conventional slice chamber. Single neurones were recorded extracellularly using conventional techniques using microelectrodes identical to those used in vivo. Neurones were recorded from the region of the supraoptic nucleus, just lateral to the optic chiasm. All recorded cells displayed positive-going spikes, and, as in vivo, for most cells (and for all cells included in the current analysis), spikes displayed a distinct notch on the descending slope (Mason & Leng, 1984). When slices were penetrated with broad-tipped electrodes as for patch-clamping, filled with high K+-containing solution, most cells encountered showed considerable ‘spontaneous’ discharge activity. However, fine electrodes filled with isotonic saline encountered few cells with any spontaneous discharge, although many cells when initially encountered showed brief periods of discharge that decayed to electrical silence within a few minutes at most. Therefore, like previous authors (Hatton, 1982; Mason, 1983a; Yamashita et al. 1983; Andrew & Dudek, 1984; Dudek & Gribkoff, 1987; Inenaga et al. 1993, 1994), we recorded discharge activity in the presence of medium with a weakly depolarizing influence; following Andrew & Dudek (1983), we raised the concentration of KCl in the extracellular medium to 5 mm, with the composition of the medium being (mm): NaCl, 124; KCl, 5; NaHCO3, 26; CaCl2, 2.4; glucose, 10; KH2PO4, 1.2; MgSO4, 1.3.
We also recorded from supraoptic neurones intracellularly in hypothalamic explants in vitro (Brown & Bourque, 2004). Recordings were made from supraoptic nucleus neurones impaled with sharp electrodes filled with 2 m potassium acetate, in hypothalamic explants superfused with carbogenated aCSF at 32–33°C. The aCSF (pH 7.4; 295 ± 3 mosmol kg−1) was composed of (mm): NaCl, 120; KCl, 3; MgCl2, 1.2; NaHCO2, 26; CaCl2, 2.5; glucose, 10. These cells had resting membrane potentials more negative than −50 mV, input resistances of greater than 150 MΩ and action potential amplitudes exceeding 60 mV when measured from baseline. Each cell displayed frequency-dependent spike broadening and transient outward rectification when depolarized from initial membrane potentials more negative than −75 mV; these combined characteristics are specific to magnocellular neurosecretory neurones (Renaud & Bourque, 1991).
Statistical analyses
For all cells, interspike interval histograms were constructed (normally in 5 ms bins) from at least 10 min of stationary spontaneous discharge activity. Discharge was judged to be stationary if cells displayed a similar mean firing rate throughout the period of recording when measured in segments substantially longer than the period of phasic firing. From these histograms, hazard functions (Leng et al. 1995) were constructed (normally in 5-ms bins) according to the formula (hazard in bin [t, t+ 5]) = (number of intervals in bin [t, t+ 5])/(number of intervals of length > t). Hazard functions from different cells were normalized to the average hazard for that cell, and consensus functions were calculated from the means of normalized hazard functions. These consensus hazard functions were fitted (by least squares) by the equation:
where c is the estimated level of hazard at long intervals (> 300 ms), where P1 and q1 characterize a post-spike refractoriness, and P2 and q2 characterize a post-spike hyperexcitability.
For phasic cells, bursts were identified by automated analysis according to the following criteria: minimum length 3 s; minimum interburst period 3 s; maximum intraburst interspike interval 1 s; minimum 20 spikes per burst; maximum interval at start of burst 0.8 s. Such analyses typically partitioned more than 95% of recorded spikes into ‘bursts.’ These criteria conservatively include the full range of bursting described by Poulain et al. (1988), whose sample of 55 cells showed mean burst durations exceeding 7 s, interburst interval durations exceeding 3.5 s and intraburst frequencies exceeding 4 spikes s−1.
Regression analyses were initially performed in Excel spreadsheets using the linear trendline function, and subsequently checked in SigmaStat. For these analyses, log intervals were paired with preceding intervals, and all pairs where one member of the pair exceeded 0 (equivalent to a 1-s interspike interval) were deleted from the data set. Log transformation of interval length removes the influence of frequency on the dispersion of the interval distribution (Bhumbra & Dyball, 2004). The equations quoted are those of the linear trendline fitted in Excel. For some cells, intervals were ordered by their order of occurrence within bursts, and the analysis confined to defined stationary periods of bursts. In all cases, the regression analyses were checked by random shuffling of the interval data, using the random number function of Excel to generate a random ordering. In all cases this destroyed observed regressions, giving r2 values and slopes close to 0.
Statistical comparisons were made using non-parametric tests; where two groups are compared directly, the significance level quoted is from a Mann—Whitney rank test. Where more than two groups are compared, a non-parametric one-way analysis of variance (ANOVA) on ranks was applied, followed by multiple pairwise comparisons (Dunn's method). All statistical tests were performed with SigmaStat software.
Results
Discharge patterning of oxytocin cells in vivo
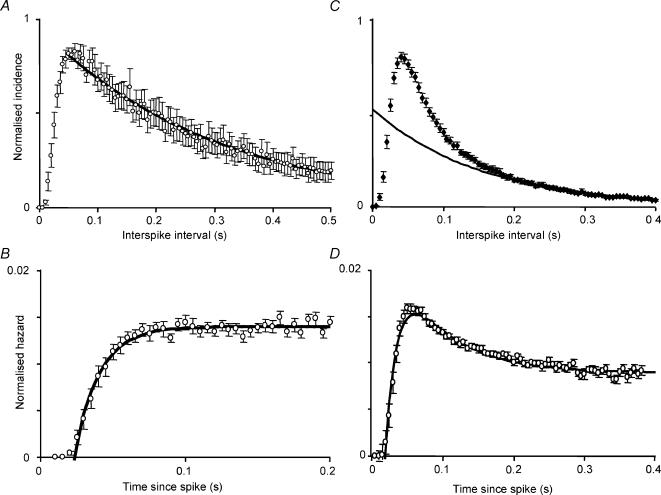
Twenty-three spontaneously active oxytocin cells were analysed, with a mean firing rate of 2.3 ± 0.4 spikes s−1 (range 0.5–6.3 spikes s−1). Interspike-interval distributions had modes of 25–75 ms (mean 50 ± 2.5 ms), and were markedly skewed: only 10 ± 1.5% of all intervals were shorter than the mode. Very few intervals shorter than 20 ms were observed in any cell (0.6 ± 0.2%). There was no significant correlation between the mode and the mean firing rate. As previously described (Leng et al. 2001), the descending tails of the interval distributions from oxytocin cells could be fitted well using a single negative exponential. To obtain an ‘average’ distribution, histograms were normalized to the amplitude of the mode and averaged. The resulting ‘consensus’ distribution has a mode at 50 ms and a tail that is also well fitted by a single exponential with a time constant of 200 ms (Fig. 1A; r2= 0.982 for the fit to intervals from 50 to 500 ms).
Figure 1. Spike patterning in oxytocin cells and phasic vasopressin cells in vivo.
A, consensus interspike interval distribution of 22 oxytocin cells recorded from the supraoptic nucleus in vivo. Distributions were normalized to the height of the mode and averaged; the graph shows the mean ± s.e.m. The fitted curve is an exponential fit to the average data for intervals of 50 ms and above. B, consensus hazard function for the same 22 oxytocin cells. Hazard functions for each cell were normalized to the total hazard over the first 500 ms and averaged; the symbols show means ± s.e.m. The consensus hazard function is fitted by a curve with equation: (hazard at time t) = 0.014 − 0.055exp(−60t). C, consensus interspike interval distribution of 77 phasic cells recorded from the supraoptic nucleus in vivo. Distributions were normalized to the height of the mode and averaged; the graph shows the mean ± s.e.m. The fitted curve is an exponential fit to the average data for intervals of 200 ms and above. D, consensus hazard function for the same phasic cells. Hazard functions for each cell were normalized to the total hazard over the first 500 ms and averaged; the error bars show the mean ± s.e.m. The consensus hazard function is fitted by a curve with equation: (hazard at time t) = 0.009 − 0.075exp(−60t) + 0.02exp(−14.5t).
Events that arise as a result of a Poisson process generate interval distributions that can be described by a single negative exponential, so this shape of interval distributions from oxytocin cells is consistent with the interpretation that spikes are generated randomly, but subject to a post-spike hyperpolarization. This relationship is revealed more directly by hazard functions. Hazard functions employ the same data as interval histograms, but, in each bin, plot the incidence of spikes as a proportion of the size of the subsequent tail of the histogram. When plotted in this way, a negative exponential distribution becomes a constant ‘hazard’ proportional to the average firing rate. Deviations from this constant hazard level then become interpretable as periods of hyper- or hypo-excitability. Hazard functions for oxytocin cells show a constant hazard after a post-spike interval of about 50 ms, implying that after about 50 ms, there are no detectable effects of an individual spike upon cell excitability. The shape of the hazard function is well fitted by a single exponential with a time constant of 17 ms and asymptote at the constant hazard level, consistent with an approximately exponential decay of post-spike hyperpolarization (Fig. 1B).
Statistical characteristics of phasic cells in vivo
Eighty-three phasic cells were analysed, with a mean firing rate of 4.2 ± 0.2 spikes s−1 (range 0.9–10.7 spikes s−1). Interspike interval distributions (analysed for 77 of these cells) were highly skewed, with modes in the range 15–80 ms, and very few intervals of less than 20 ms (3493 of 211817 intervals, 1.6%). The mean mode was 45 ± 1.5 ms, and 22 ± 1% of intervals were shorter than the mode. For the other six cells, only burst parameters were analysed, as a corruption of the data files meant that interspike intervals could not be retrieved.
As previously described (Leng et al. 2001), the tails of the interval distributions could not be fitted well using a single exponential, unlike those from oxytocin cells. However the distributions were very similar between cells. To obtain an ‘average’ distribution characteristic of phasic cells, histograms were normalized to the height of the mode and were averaged. The resulting ‘consensus’ distribution (Fig. 1C) has a mode at 45 ms, and is similar in shape to the histograms from individual cells. A single negative exponential fits well to the distal tail of the distribution (intervals > 200 ms; r2= 0.98) but leaves a large excess of intervals above the fitted curve that increases towards the mode. This suggests that spike patterning is dominated by a sequence of post-spike refractoriness followed by hyperexcitability, consistent with a sequential hyperpolarization and depolarization.
Hazard functions display this more directly, and show a low probability of discharge in the region 0–40 ms after a spike followed by an increased probability 40–200 ms after each spike (Fig. 1D). The normalized hazard function was fitted by a double exponential; assuming that the post-spike refractoriness decays with the same time constant as for oxytocin cells (17 ms), the superimposed post-spike hyperexcitability decays with a time constant of 69 ms. This assumption is arbitrary, but other assumptions that fitted the profile equally well give similar estimates for the decay of post-spike hyperexcitability.
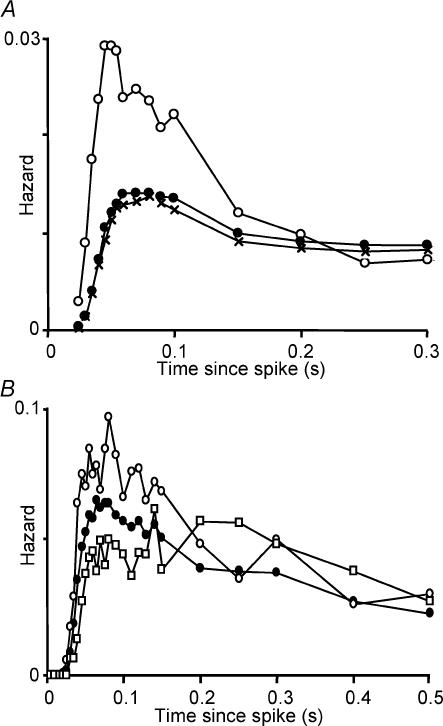
The activity through a burst is not constant, but declines over the first few seconds from an initial peak to a steady-state level. For 10 cells, arbitrarily chosen to span the range of intraburst firing rates, we constructed hazard functions for the first 5 s of bursts and for the subsequent steady-state activity. For each cell, the ‘early’ hazard (50–60 ms after a spike) was higher at the beginning of a burst than in the steady-state phase, whereas the ‘late’ hazard (300 ms after a spike) was similar (Fig. 2A). This indicates that the decline in spike frequency at the start of a burst does not reflect a progressive hyperpolarization, which would be revealed as a decline in the late hazard. However hazard functions constructed from the steady-state phase of bursts still showed evidence of post-spike hyperexcitability.
Figure 2. Evolution of the hazard function during a burst.
A, hazard functions generated from interspike interval distributions constructed for the first 100 spikes of 45 successive bursts (○), for the next 900 spikes of each burst (•) and for all subsequent steady-state activity (×) in a representative phasic cell recorded in vivo. In this cell, as in all 10 cells analysed similarly, the post-spike excitability was much more prominent at the beginning of a burst than during the steady-state phase. B, hazard functions generated from interval distributions constructed during steady-state activity for a representative phasic cell in vivo. •, the hazard function calculated for all activity during the steady-state phase. ○, hazard following a short interspike interval (< 0.04 s). □, hazard following a relatively long interspike interval (> 0.25 s). The post-spike hyperexcitability is much more marked after a short interval than after a long interval, even within steady-state activity.
If the post-spike hyperexcitability has a duration of > 50 ms, the effects should summate when spikes occur at sufficiently short intervals. To test this, we constructed hazard functions conditional upon interval length for a representative phasic cell — we chose the cell with the longest stable recording, to give the most data conditional on previous spike history; all measured burst parameters of this cell were close to the population means. Figure 2B shows hazard functions from steady-state activity′ (i.e. excluding the first 100 spikes of each burst). One describes the hazard after relatively short interspike intervals (< 40 ms), and the other describes the hazard after relatively long intervals (> 250 ms). The late hazard is identical for these two functions, but the early hazard is much greater after a short interval than after a long interval, consistent with a post-spike hyperexcitability that summates over about 100 ms.
Discharge patterning in non-phasic ‘vasopressin’ cells
Although phasic firing in a supraoptic neurone in vivo is accepted as a reliable indicator that the cell is a vasopressin cell, the converse is less true. Of supraoptic neurones recorded in urethane-anaesthetized rats, only a minority fire phasically (Brown et al. 1998). Cells that fire continuously may be oxytocin cells or vasopressin cells, and further identification is needed. The most commonly used identification is by response to i.v. injection of CCK; such injections increase oxytocin secretion, and inhibit vasopressin secretion. To get an unbiased estimate of the incidence of phasic firing, we looked at the characteristics of the first identified supraoptic neurone encountered in each of 120 experiments. Of these 120 neurones, five were very slow or silent (< 0.5 spikes s−1); and 27 were phasically active. The remaining 88 neurones were tested with CCK; of these, 51 were excited, 35 were inhibited, and only two showed no clear response. Thus, discounting the seven unidentified cells, combining the use of CCK with observation of phasic firing gives an estimated incidence of 55% vasopressin cells and 46% oxytocin cells in the supraoptic nucleus. This is a lower proportion of vasopressin cells than estimated for the whole supraoptic nucleus from immunocytochemical studies (67%; Rhodes et al. 1981), but is similar to the 46% estimated from electrophysiological studies in lactating rats using reflex milk ejection to identify cells (Poulain et al. 1988).
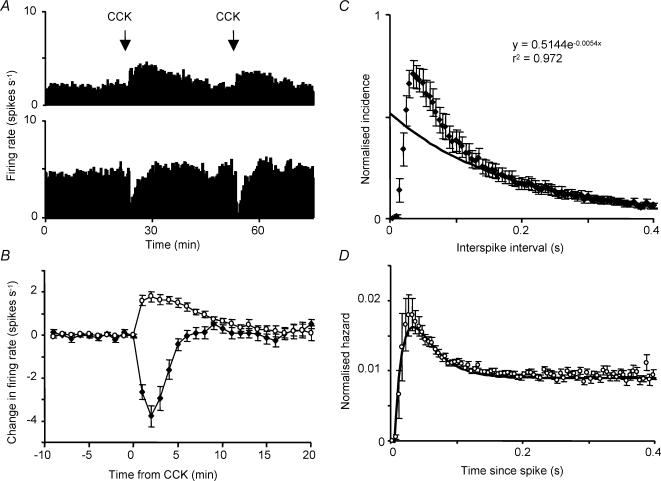
In suckled, lactating rats, responsiveness to CCK correlates well with neuronal identity as established by activation associated with reflex milk ejection. Thus continuously active supraoptic neurones that are inhibited by CCK (Fig. 3A) are likely to be vasopressin cells, despite the absence of phasic firing. From the data above, excluding the seven unidentified cells, 51/113 supraoptic neurones (45%) were identified as oxytocin cells, and 62/113 (55%) were identified as putative ‘vasopressin’ cells. Of the ‘vasopressin’ cells, 44% were phasically active, and 56% were non-phasically active, either irregular in firing pattern or continuously active.
Figure 3. Effects of CCK on firing activity in supraoptic neurones.
A, simultaneous recording of two antidromically identified neurones from the supraoptic nucleus in vivo. CCK was injected i.v. at the times indicated, one cell was repeatedly excited and the other repeatedly inhibited. B, average changes in mean firing rate for 24 oxytocin cells (○) and 22 non-phasic ‘vasopressin’ cells (•) following i.v. injection of CCK. The graph shows mean changes ± s.e.m. from the control firing rate in the 10 min before injection. C, consensus interspike interval distribution of 22 non-phasic vasopressin cells recorded in vivo. Distributions were normalized to the height of the mode and averaged; the graph shows the mean ± s.e.m. The fitted curve is an exponential fit to the average data for intervals of 0.2 s and above. D, consensus hazard function constructed from 22 non-phasic vasopressin cells. The function is fitted by the equation: (hazard at time t) = 0.009 − 0.075exp(−60t) + 0.05exp(−32t).
Here we analysed 22 continuously active ‘vasopressin’ cells. Their responses to CCK have a profile that is an inverse of the profile of responses of oxytocin cells to CCK (Fig. 3B). The mean firing rate of this sample was 6.6 ± 0.5 spikes s−1 (range 4–12 spikes s−1); ‘non-phasic’ cells firing at less than 4 spikes s−1 were excluded because of uncertainties about classifying such cells as phasic or continuous. The interspike interval distributions were skewed, with modes of 15–60 ms (mean 36 ± 3 ms; significantly shorter than for oxytocin cells or phasic vasopressin cells, P < 0.005) and 15.7 ± 1.4% of intervals were shorter than the mode. However, the distributions and the hazard functions were similar to those of phasic cells and unlike those of oxytocin cells (Figs 3C and D). In particular, the hazard functions showed a post-spike refractoriness followed by hyperexcitability. To quantify this, we compared the early hazard (maximum hazard within 70 ms after a spike) with the average late hazard (200–300 ms after a spike): a ratio of 1 would imply constant hazard (for oxytocin cells, the average ratio was 1.1 ± 0.05). For non-phasic ‘vasopressin’ cells, the average ratio of hazards was 2.5 ± 0.35 (P < 0.0001 versus oxytocin cells), and only two cells had a ratio below 1.2.
Comparison of the consensus normalized hazard functions of phasic cells and continuously active ‘vasopressin’ cells indicates that the post-spike refractoriness is shorter in the continuously active ‘vasopressin’ cells, as reflected also in the significantly shorter mode of the interval distribution. Moreover, the subsequent hyperexcitability, while no less marked than in phasic cells, is more transient. Activity-dependent mechanisms leading to post-spike hyperpolarization and depolarization are superimposed in time, so what appears as a short post-spike refractoriness may reflect a large post-spike hyperexcitability. Assuming, as we did for phasic cells, that post-spike refractoriness decays with the same time constant as in oxytocin cells (17 ms), the consensus hazard function of continuously active vasopressin cells is best fitted by a post-spike hyperexcitability that declines with a time constant of 29 ms. As before, the assumption about the decay of post-spike refractoriness is arbitrary, but is not critical to the estimate of the time constant of the decline in hyperexcitability.
Statistical characteristics of phasic firing: comparison of cells recorded in vitro to cells recorded in vivo
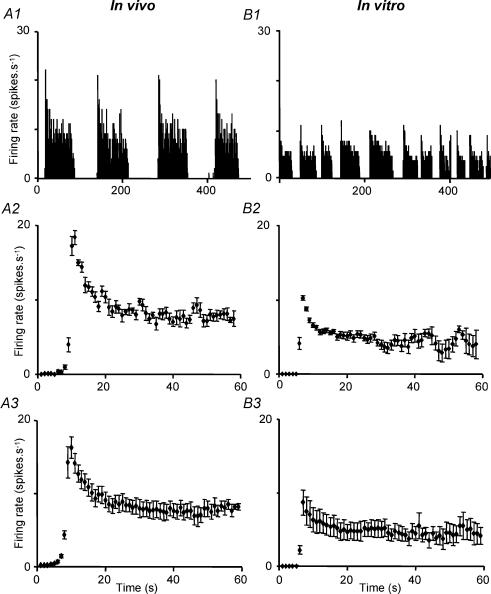
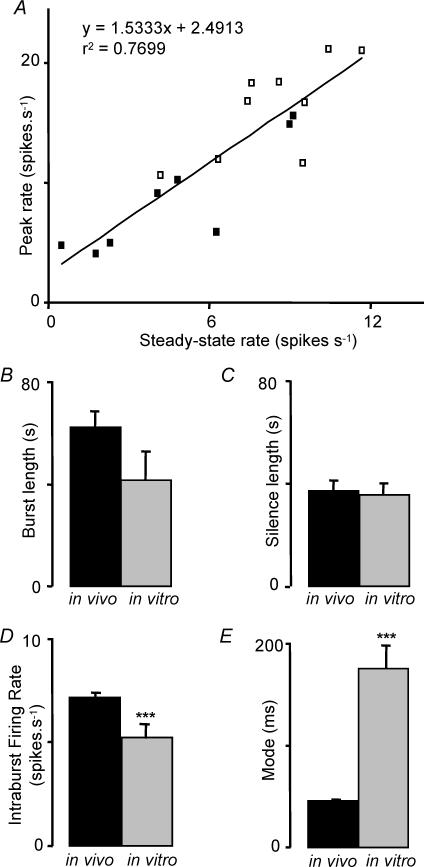
Phasic bursts in vivo or in vitro showed an initial high discharge rate that abated within a few seconds to a stable steady-state (Fig. 4). The initial peak rate was proportional to the steady-state level for 10 cells in which burst profiles were analysed in detail (Fig. 5A), and the time course of the decline and the relationship of peak rate to steady-state discharge rate were similar in vivo and in vitro.
Figure 4. Bursts profiles in phasic cells in vivo and in vitro.
A1, representative example of phasic discharge in a supraoptic neurone in vivo. A2, average (± s.e.m.) intraburst firing rate for 10 bursts in a representative phasic cell in vivo. A3, average (± s.e.m.) intraburst firing rate for 9 phasic cells in vivo. B1, phasic discharge in a supraoptic neurone in vitro. B2, average (± s.e.m.) intraburst firing rate for 16 bursts in a representative phasic cell in vitro. B3, average (± s.e.m.) intraburst firing rate for 8 phasic cells in vitro.
Figure 5. Statistical characteristics of burst firing in cells recorded in vivo and in vitro.
A, positive correlation between average peak firing rate and average steady-state firing rate in bursts from 9 cells recorded in vivo (□) and from 8 cells recorded in vitro (▀). B, mean burst durations. C, silence durations. D, intraburst firing rate. E, modal interspike intervals. All bars show means ± s.e.m., for 77 cells recorded in vivo and 19 cells recorded in vitro. In general, burst characteristics are similar in vivo and in vitro but the interspike interval distributions are very different, as indicated by the large difference in modal interspike interval.
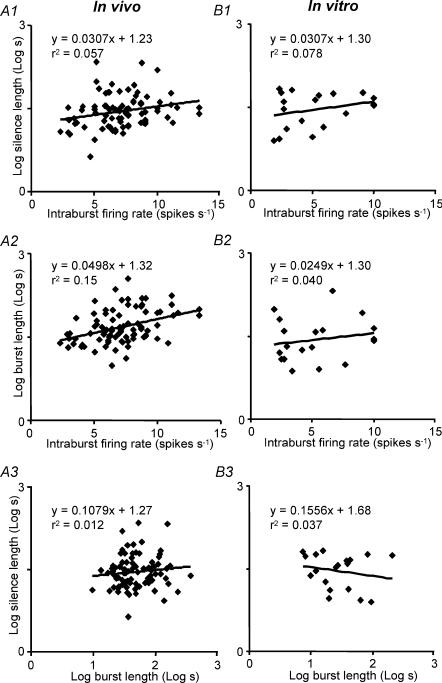
We analysed global features of bursting activity for 77 phasic cells recorded in vivo, and 19 phasic cells recorded from the supraoptic nucleus in vitro. Neurones in vivo had a mean burst duration of 62 ± 6 s (range 10–360 s), and interburst (silence) duration of 37 ± 4 s (range 4–216 s) (Figs 5B and C). The burst durations were not distributed normally, so we also calculated medians and the means of log durations. The median burst duration was 42 s, close to the antilog of the mean log duration (48 s). The median silence duration was 28 s, identical to the antilog of the mean log duration. The mean intraburst firing rate was 7.1 ± 0.3 spikes s−1 (range 2.3–13.3 spikes s−1; median 7.1 spikes s−1; Fig. 5D). There were weak but significant positive correlations between intraburst firing rate and silence duration (P < 0.05; Fig. 6A1), and between intraburst firing rate and (log) burst duration (P < 0.001; Fig. 6A2).
Figure 6. Burst parameters in vivo and in vitro.
Relationship between silence length and intraburst firing rate in vivo (A1) and in vitro (B1); relationship between burst length and intraburst firing rate in vivo (A2) and in vitro (B2); relationship between silence length and burst length in vivo (A3) and in vitro (B3). There is a weak but significant positive correlation between intraburst firing rate and burst duration in vivo, but generally the burst parameters are largely independent of each other in vivo and in vitro. The lines show linear regressions fitted by least squares minimization.
For neurones in vitro, the mean burst duration was 41 ± 11 s (range 7–207 s; median 25.5 s; Fig. 5B) and the mean silence duration was 35 ± 5 s (range 8–67 s; median 36 s; Fig. 5C). The mean intraburst firing rate was 5.3 ± 0.7 spikes s−1 (range 1.9–10 spikes s−1; Fig. 5D), significantly slower than for phasic cells in vivo (P < 0.001). Thus, on average, bursts were shorter and less intense than for phasic cells in vivo, but there was extensive overlap between the populations in these parameters. There was no significant relationship between burst duration and silence duration either in vivo or in vitro (Fig. 6A3 and B3).
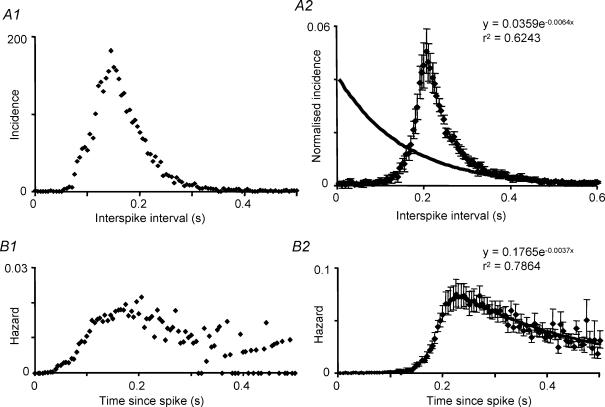
While some characteristics of burst firing were thus similar in vivo and in vitro, marked differences were apparent in the interspike interval distributions. The distributions for phasic cells in vitro were relatively symmetrical about the mode (Fig. 7A1), in contrast to the skewed distributions of cells in vivo (Fig. 1C), 35 ± 3% of intervals were shorter than the mode (significantly more than each in vivo group, P < 0.001). Moreover, the modes were on average very long (mean 174 ± 23 ms; median 140 ms; range 30–395 ms, significantly longer than any of the in vivo groups, P < 0.0001; Fig. 5E).
Figure 7. Interspike interval distributions and hazard functions in phasic cells in vitro.
A1, representative interval distribution from a phasic cell in vitro. B1, hazard function plotted from the same cell. A2, consensus interspike interval distribution of 19 phasic cells recorded in vitro. Distributions were normalized to the height of the mode and averaged, after displacing each so that the modes coincided at the position of the average mode. The graph shows the mean ± s.e.m. The fitted curve is an exponential fit to the average data for intervals of 0.4 s and longer. B2, consensus hazard function (corresponding to the interspike interval histograms displaced as above so that the modes coincide). The tail of the function is fitted by a single exponential as indicated.
Because the modes of these distributions vary markedly with firing rate, to generate a representative ‘average’ distribution we normalized all histograms to the total number of intervals, and then displaced all distributions so that the modes coincided, before averaging. The ‘average’ distribution, plotted in Fig. 7A2 with the mode at the position of the average mode, has a shape that is typical of individual cells (cf. Fig. 7A). The distribution is relatively symmetrical, and exponentials fitted to the distal tail deviate from the average distribution for intervals < 400 ms. This indicates that the mechanisms underlying spike generation do not constitute a renewal process, but are dominated by deterministic mechanisms for at least 400 ms after each spike.
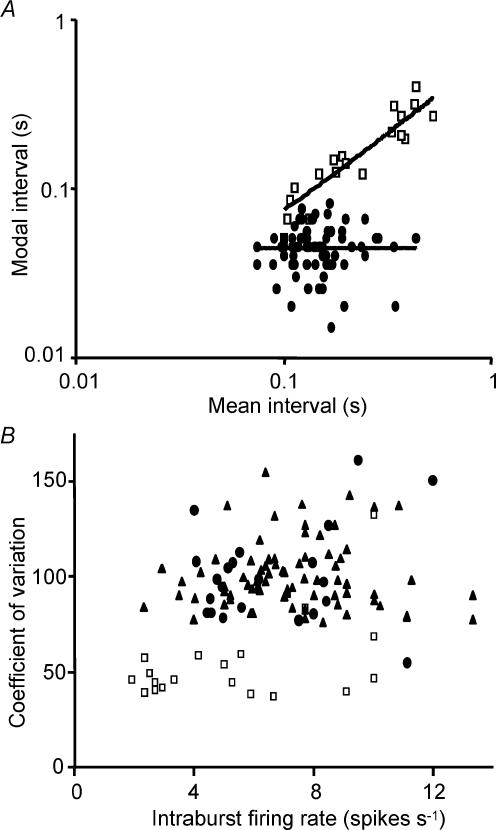
For phasic cells in vivo, there was no significant correlation between the mode and the intraburst firing rate, or any other parameters of bursts, but by contrast, for phasic cells in vitro there was a very strong inverse correlation between the mode and the intraburst firing rate (Fig. 8A). Such distributions appear inconsistent with spikes arriving through a random process.
Figure 8. Dependence of statistical parameters on mean firing rate.
A, relationship between the mode of interspike interval distributions and the mean interspike interval. Plots for 77 phasic cells in vivo (•) and 19 phasic cells in vitro (□). The lines show linear regressions fitted by least squares minimization. The in vivo data show no correlation (r2= 0.00; y =−0.0004x+ 45), but the in vitro data show a strong positive regression (r2= 0.79; y = 0.636x+ 11.38). B, coefficient of variation as a function of intraburst firing rate. Plots for 77 phasic cells in vivo (▴), 23 non-phasic vasopressin cells in vivo (•), and 19 phasic cells in vitro (□). Coefficients of variation of intraburst activity are higher for cells recorded in vivo than for cells recorded in vitro, do not differ significantly between phasic and non-phasic vasopressin cells in vivo, and do not vary significantly as a function of firing rate in any group.
The hazard functions indicate that for phasic cells in vitro, after each spike, a long period of refractoriness is overtaken by a slowly developing and slowly decaying hyperexcitability. The consensus hazard function (Fig. 7B2) can be reasonably well fitted by assuming that post-spike refractoriness declines exponentially with a time constant of 77 ms, and superimposed upon this is a post-spike hyperexcitability which declines with a time constant of 294 ms. In vivo, the peak of post-spike excitability is reached at about 40 ms after a spike and is relatively short lasting (cf. Fig. 1); by contrast in vitro the peak of post-spike excitability appears to occur 200–300 ms after a spike and decays slowly.
The coefficient of variation (standard deviation/mean, usually expressed as a percentage) is a commonly used measure of the variability of spike firing, though it is an imperfect measure since it is influenced by the skew of the interval distribution. However, for wholly regular firing, the coefficient will have value 0, and with increasing irregularity it takes increasing values. For a random, Poisson process the value will be 100% (though a value of 100 does not alone imply that the process is Poissonian). For phasic vasopressin cells in vivo the mean coefficient of variation of intraburst activity (excluding intervals > 1 s) was 100.6 ± 1.9% (n = 77), very similar to that of continuously active vasopressin cells in vivo(100.4 ± 5.4%, n = 22), and both were significantly higher than the coefficient of variation for oxytocin cells (75.1 ± 1.8%, n = 23), which in turn was significantly higher than for phasic cells in vitro (54 ± 5.3%, n = 19; P < 0.001 in both cases). By this measure, phasic cells in vitro are significantly more regular in their firing than either vasopressin cells or oxytocin cells in vivo. The difference in coefficient of variation between phasic cells in vitro and vasopressin cells in vivo is not related to differences in intraburst firing rate (Fig. 8B).
Order effects
Since bursts begin with a brief period of accelerated firing, and since post-spike changes in excitability can persist for long enough to summate over at least the effects of two spikes in vivo, there are order effects in the patterns of spike discharge of vasopressin cells both in vivo and in vitro. To estimate the impact of such effects, we analysed the relationship between successive interspike intervals for 16 of the phasic cells in vivo to compare with the 19 phasic cells recorded in vitro. The in vivo cells were chosen for analysis without bias, except that we selected particularly long recordings, and chose cells from independent experiments. For this analysis, we log-transformed interval durations (measured in seconds), and calculated linear regressions for each interval against the preceding interval (see Bhumbra & Dyball, 2004). We excluded all intervals of duration > 1 s to confine the regression analysis to activity within bursts; as apparent from Fig. 9, this retains virtually all intervals except for outlying interburst intervals.
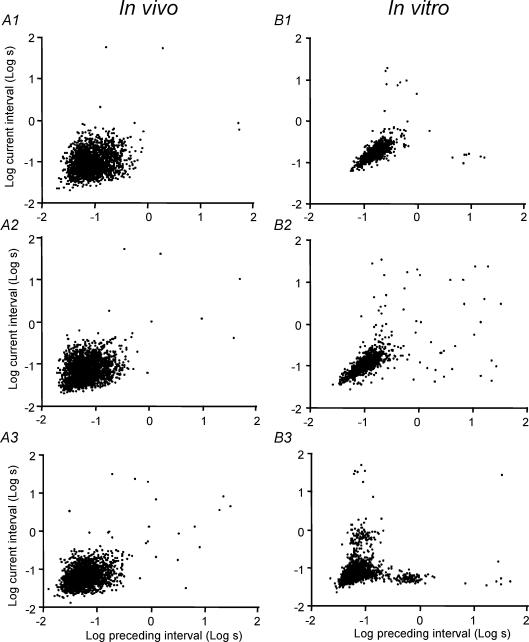
Figure 9. Correlations between adjacent interspike intervals.
Plots for three representative phasic cells recorded in vivo (left; A1–3) and three phasic cells recorded in vitro (right; B1–3). Each plot shows only the first 2000 interval pairs of each recording; the regression analyses quoted in the text were performed on all data. Intervals duration (in seconds) were log-transformed, and each interval length is plotted against the preceding interval. The recordings from cells in vitro show less dispersion of the data and a stronger correlation between adjacent intervals.
For the 16 in vivo cells analysed there was, in every case, a weak positive correlation between adjacent intervals (Fig. 9). The average slope of the regression was 0.19 ± 0.017 with an intercept of +0.87 ± 0.017, and the mean r2 value was 0.04 ± 0.007. The shallow slope of this regression and the low r2 value indicate a weak order effect overall — the duration of any particular interval is almost, but not completely, independent of the length of the previous interval. In all cases no significant regressions were observed after random shuffling of the interval data.
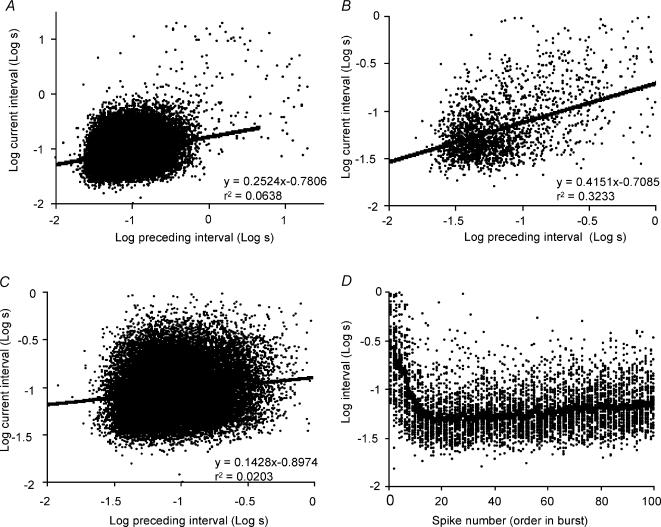
We then calculated the regressions in different stages of the bursts. Figure 10 shows the cell with the longest recording (62 000 intervals); for the first 40 spikes of each burst there is a much stronger correlation (r2= 0.32; Fig. 10B) between adjacent intervals than in the whole recording (r2= 0.06; Fig. 10A), and, excluding the first 100 spikes of each burst, spikes in the remainder of the burst show little correlation between adjacent intervals (r2= 0.02; Fig. 10C). Thus most of the order effects apparent in the total activity arise from effects at the beginnings of bursts.
Figure 10. Correlations between adjacent interspike intervals within bursts for a representative phasic cell recorded in vivo.
A shows all interval pairs in a recording from a single phasic cell in vivo, and the line is a linear regression to the entire data set, with equation and regression coefficient indicated. B shows the first 40 spikes of each burst only, and C shows all interval pairs except for the first 100 of each burst. As in Fig. 9, interval durations (in seconds) were log-transformed, and each interval length is plotted against the preceding interval. The analysis shows a very weak correlation between adjacent intervals generally, but there is a stronger correlation at the beginning of bursts than in the steady-state phase. D shows the log interval duration for each of the first 100 spikes of each of 45 bursts, and the line shows the means interval for each spike in a burst. At the beginning of bursts, firing rate accelerates rapidly to a maximum by the 20th spike and thereafter declines.
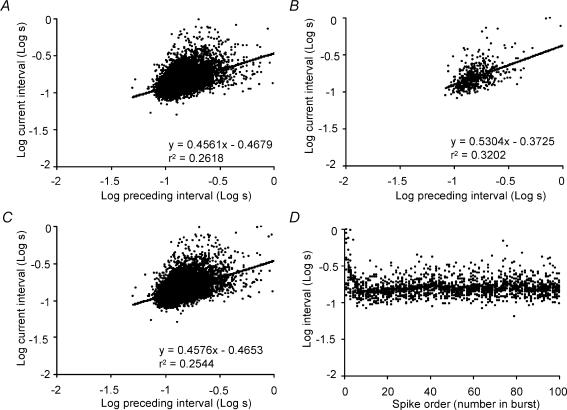
We analysed cells recorded in vitro similarly (Fig. 9). The average slope of the regression between adjacent intervals was 0.44 ± 0.04 with an intercept of +0.4 ± 0.04, and a mean r2 value of 0.22 ± 0.04. The steeper slope of this regression and the higher r2 value indicate a stronger order effect than observed in vivo (both differences significant at P < 0.001). As before, we calculated the regressions in different stages of the component bursts. Figure 11 shows the in vitro cell with the longest single recording (15 500 intervals, with characteristics close to the population mean): the correlation between adjacent intervals in the first 40 spikes of each burst (r2= 0.32) is similar to that in the recording as a whole (r2= 0.26), similar to that after excluding the first 100 spikes of each burst (r2= 0.25), and similar also to that of the in vivo cell in Fig. 9 for the first 40 spikes of a burst only (r2= 0.32). By contrast, the correlation between one interval and the second preceding interval was very weak in the steady-state phase of bursts (r2= 0.005), with a slope close to zero (0.06), indicating that the observed order effects do not arise from non-stationarity within the steady-state phase of the bursts.
Figure 11. Correlations between adjacent interspike intervals within bursts for a representative phasic cell recorded in vitro.
A shows all interval pairs in the recording; the line is a linear regression to the entire data set, with equation and regression coefficient indicated. B shows the first 40 spikes of each burst only, and C shows all interval pairs except for the first 100 of each burst. As in Fig. 11, intervals (in seconds) were log-transformed, and each interval length is plotted against the preceding interval. The analysis shows a stronger correlation between adjacent intervals generally than observed in vivo. Note that, unlike recordings in vivo, there is a similar correlation at the beginning of bursts as in the steady-state phase. D shows the log interval duration for each of the first 100 spikes of each of 23 bursts, and the line shows the mean interval for each spike in a burst. At the beginning of bursts, firing rate accelerates rapidly to a maximum by the 20th spike and thereafter declines.
A positive correlation between adjacent interspike intervals observed within stationary periods of activity (the steady-state phase of bursts) is consistent with the interpretation that spikes are followed by a prolonged post-spike hyperexcitability, which influences not only the timing of the next spike but also that of the following spike. A stronger correlation in vitro than in vivo suggests that stochastic influences are much weaker in vitro, and/or that the post-spike hyperexcitability is longer lasting. However at the beginning of spontaneous bursts, in vivo and in vitro, similar deterministic influences may apply.
Phasic firing in different physiological states
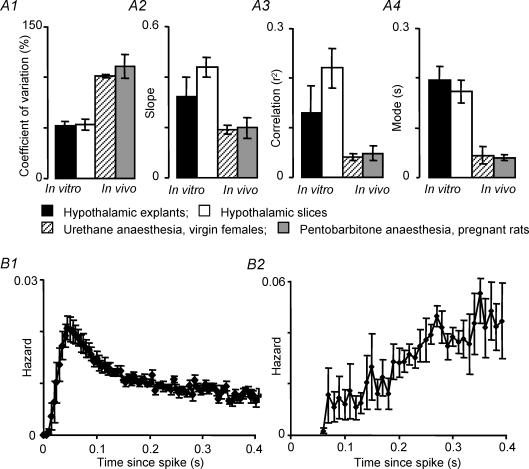
Given the large difference in phasic firing observed between in vivo and in vitro recordings, we tested whether the characteristics that we describe above were confined to particular experimental conditions. The analysis of in vivo firing above is confined to recordings from virgin rats, under urethane anaesthesia, using a ventral surgical approach. We extended our analysis to phasic cells recorded from pentobarbitone-anaesthetized virgin rats (4 cells), term-pregnant rats under pentobarbitone anaesthesia (8 cells see Douglas et al. 2001 for technical details) or urethane anaesthesia (2 cells); and from lactating rats recorded with a dorsal approach (see Luckman et al. 1994 for technical details), using pentobarbitone anaesthesia (5 cells) or urethane anaesthesia (4 cells). Like all phasic cells recorded in urethane-anaesthetized virgin rats, all of these cells showed interspike interval distributions with early modes and high coefficients of variation, and all showed weak correlations between adjacent intervals, with slopes and r2 values similar to other in vivo recordings. Figure 12 shows data from the largest additional in vivo group (term-pregnant rats recorded with pentobarbitone anaesthesia). Hazard functions from all cells in vivo showed an early peak hazard, and we observed no differences in the characteristics of phasic firing in vivo between physiological states or between anaesthetics.
Figure 12. Statistical characteristics of intraburst firing in vivo and in vitro.
A, comparison of statistical properties of intraburst discharge activity in phasic cells recorded from two in vitro conditions (open columns: extracellular recordings from hypothalamic slices, n = 19; closed columns: intracellular recordings from hypothalamic explants, n = 7) and from two in vivo conditions (hatched columns: urethane anaesthesia, virgin females n = 16; grey columns: pentobarbitone anaesthesia, pregnant rats, n = 8). Bars show means ± s.e.m. In each panel differences between in vivo and in vitro groups are significant but no differences between in vivo groups or between in vitro groups are significant (see text for full details). A1, coefficient of variation of intervals; A2, the slope of the correlation between adjacent intervals; A3, correlation coefficients of the correlation between adjacent intervals; A4, the mode of the interspike interval distributions. B, consensus hazard functions (means ± s.e.m.) for 8 phasic cells recorded in pregnant rats under pentobarbitone anaesthesia (B1) and for 7 phasic cells recorded from hypothalamic explants (B2). Hazard functions were normalized as in Fig. 1. The hazard function from in vivo recordings in pregnant rats under pentobarbitone anaesthesia is very similar to that from virgin rats under urethane anaesthesia (Fig. 1). The hazard function from explant recordings is very different from all in vivo recordings, and like other recordings in vitro, indicates a very slow post-spike rise to peak excitability.
Finally, we analysed seven phasic cells recorded intracellularly from hypothalamic explants, which preserve more synaptic input than coronal slices, and which retain more of the dendritic architecture. Like the phasic cells recorded in slice preparations, and unlike all phasic cells recorded in vivo in all conditions analysed, these cells all showed interspike interval distributions with late modes and low coefficients of variation, and all showed significant positive correlations between adjacent intervals with slopes and r2 values similar to other in vitro recordings. The hazard functions, like those of phasic cells recorded in slices, showed a late peak hazard; even later than for phasic cells recorded in slices. This may reflect the lower mean intraburst firing rate of this group of cells (3.2 ± 0.5 spikes s−1) compared to the cells recorded in slices (5.3 ± 0.7 spikes s−1), since for in vitro recordings of phasic cells the time to peak hazard, like the mode of the interspike interval distribution, is strongly correlated with mean intraburst firing rate (see Fig. 8A). Figure 12 shows data from explant preparations for comparison with the original in vivo and in vitro groups analysed. One-way analyses of variance on ranks showed highly significant differences amongst groups for the mode, coefficient of variation, and the r2 value and slope of regressions between adjacent intervals (P < 0.0001 in each case). Subsequent all pairwise comparisons (Dunn's method) showed no significant differences between the two in vivo groups or between the two in vitro groups. The modes and coefficient of variation differ significantly between each in vivo group and each in vitro group, and there are significant differences in r2 and slope between data from slices and each in vivo group (P < 0.05 in every case).
Discussion
Studies in vitro have led to the hypothesis that phasic firing is a regenerative process resulting from large, slow, post-spike DAPs that follow a post-spike hyperpolarization mediated by a fast HAP and slower AHP. This conclusion is most fully expressed in a recent computational modelling study (Roper et al. 2003, 2004) based on in vitro data (Teruyama & Armstrong, 2002), which simulates phasic firing by a fully regenerative mechanism, via a calcium- and voltage-dependent DAP with a time-to-peak of ∼300 ms. This slow time-to-peak is generally consistent with direct observations of the DAP in vitro, thus for instance, Li & Hatton (1997), with patch-clamp recordings from supraoptic neurones in horizontal slices of the rat hypothalamus, reported that DAPs following single evoked spikes had a time-to-peak of 320 ms.
This hypothesis leads to a number of predictions about spike patterning within bursts. If spikes within bursts arise as a result of a predominantly deterministic process (i.e. a regenerative mechanism), then spike timing should be far from random. In this study, we used statistical approaches to test this prediction.
If spike timing within bursts results mainly from a random Poissonian process, then we would expect: (1) the interspike interval distributions should be well fitted by a single negative exponential, with a coefficient of variation close to 100%; (2) the hazard should be independent of time after a spike; and (3) there should be no significant correlation between adjacent intervals within a burst. Conversely, for spikes arriving as a result of slow DAPs following a HAP/AHP, we would expect: (1) the interval distributions should be distributed more symmetrically about a mean that reflects the timing of the DAP; with a relatively low coefficient of variation; (2) the hazard functions should reflect the dynamics of the sequence of hyperpolarization and depolarization and in particular, should show a maximum at the expected time that the DAP reaches spike threshold; (3) at increasingly depolarized resting potentials the DAP should reach spike threshold sooner after a spike, so the mode of the interspike interval distribution and the peak of the hazard function should be inversely related to average firing rate; and (4) adjacent intervals should be correlated, reflecting the long-lasting effects of summation of slow DAPs.
By these criteria, the present analysis of recordings in vitro supports the hypothesis that spikes within phasic bursts in vitro result from a mainly deterministic process. In vitro, spikes in phasic cells are generated at long, relatively regular intervals. The interval distributions are very poorly fitted by negative exponentials. The shape of the hazard functions suggests that maximum excitability is reached several hundred milliseconds after a spike. The coefficient of variation is typically well below 100, and there are relatively strong positive correlations between adjacent interspike intervals. These observations suggest that spikes in phasic bursts in vitro arise by a regenerative mechanism that involves a slow or late DAP that reaches spike threshold, or which falls just short of threshold.
However, analysis of phasic firing in vivo results in very different conclusions. Interspike interval distributions and hazard functions indicate a sequence of post-spike refractoriness followed by hyperexcitability as expected from a sequence of HAP/DAP, but the dynamics of these changes in excitability are very different to in vitro observations. The post-spike hyperexcitability is early, small, and transient compared with in vitro observations. Most of the tail of the interspike interval distribution is well fitted by a single negative exponential, and firing within bursts in vivo is relatively irregular, with a coefficient of variation close to 100%, suggesting that most spikes arise from a random process. Consistent with the dominance of stochastic processes, order effects are very weak: the length of any particular interval is virtually independent of the length of the preceding interval, implying that post-spike changes in excitability within bursts are of short duration.
A previous statistical analysis of phasic firing in vivo drew similar conclusions to the present study: Poulain et al. (1988), in an analysis of phasic firing in supraoptic neurones from lactating rats, concluded that activity within bursts is close to what would be expected of a random process subject to a short refractory period (see Fig. 20 of Poulain et al. 1988). A recent comparison of the statistical discharge of continuously firing supraoptic neurones in vivo and in vitro, independently of the present study, also concluded that discharge is much more regular in vitro than in vivo (Bhumbra & Dyball, 2004).
Here, as in many previous studies (e.g. Hatton, 1982; Mason, 1983b; Andrew & Dudek, 1984; Inenaga et al. 1992, 1993), supraoptic neurones in hypothalamic slices in vitro were recorded in 5 mm KCl (total [K+] 6.25 mm), a condition expected to lead to a modest, sustained subthreshold depolarization. Rather than depolarize cells by raising extracellular [K+], Haller et al. (1978) and Haller & Wakerley (1980) used bath application of glutamate to observe phasic firing in hypothalamic slices. These papers display only five examples of interspike interval distributions from phasic cells, but each of these is relatively symmetrical, with modes between 80 and 130 ms, consistent with the in vitro recordings described here, but different from the in vivo recordings described here. We also analysed seven phasic cells recorded from explant preparations which better preserve the dendritic trees of supraoptic neurones, and which retain more afferent input than slices. In these preparations spontaneous phasic firing can be observed without recourse to extrinsic depolarization. These neurones all showed a late peak in post-spike excitability like phasic neurones from slices, but firing within bursts, though more regular than activity in vivo, was less regular than activity within bursts in slices.
The present in vivo recordings, like those of Poulain et al. (1988), and indeed, like virtually all studies of supraoptic neurones in vivo, were mainly made under urethane anaesthesia. Urethane is the anaesthetic of choice for the magnocellular system since the physiological reflexes — in particular the suckling-induced milk-ejection reflex are intact under urethane, but impaired by most anaesthetics. The advantage of urethane as an anaesthetic is that it ‘produces a long-lasting steady level of surgical anaesthesia, and has minimal effects on autonomic and cardiovascular systems’ (Hara & Harris, 2002). Urethane appears to exert its anaesthetic action by a modest effect on many channels rather than a dominant action on any one: at anaesthetic doses, urethane modestly potentiates the actions of GABA, glycine and acetylcholine, and modestly depresses AMPA and NMDA actions (Hara & Harris, 2002). By contrast, the anaesthetic action of pentobarbitone is thought to result from a large and relatively selective potentiation of GABA actions. However, the structural characteristics of phasic firing do not much differ between urethane or pentobarbitone anaesthesia, nor do they differ between virgin, pregnant and lactating rats, nor do they differ between rat strains, nor do they differ between dorsal and ventral surgical approaches. The consistent differences are between in vivo preparations and in vitro preparations.
The simplest description of the observed differences is that in vitro, both the HAP and the DAP are larger and slower than in vivo. What might account for this? Since both the HAP and the DAP are Ca2+-regulated processes, altered Ca2+ buffering seems a possibility, as Ca2+ buffering is critical for patterning of activity of supraoptic neurones in vitro (Li et al. 1995). However, a second possibility is that loss of tonic synaptic input alters the passive electrical properties of supraoptic neurones. There have been only two brief reports of intracellular recordings from supraoptic neurones in vivo (Bourque & Renaud, 1991; Dyball et al. 1991), but both confirm that there is a much higher PSP frequency in vivo, and a lower input resistance. Recently, Destexhe et al. (2003) compared the electrophysiological properties of neocortical neurones in vivo and in vitro; like the present study, firing in vivo was much more irregular than in vitro, and these authors used computational modelling to study the differences in patterning. Intracellular recordings indicated a massively lower cell input resistance in vivo, as expected from a much greater afferent input, and computational modelling showed that this ‘high-conductance’ state of neurones in vivo was accompanied by an increase in voltage attenuation, and a reduction in membrane time constant compared with the in vitro state. These observations indicate a possible explanation for the apparent differences in DAP amplitude and dynamics inferred from the present study. The duration of the DAP far exceeds the membrane time constant, but the differences in hazard functions between in vivo and in vitro preparations indicate differences in the activation time of the DAP or inactivation time of post-spike hyperpolarization, and both of these may be expected to be influenced by membrane time constant.
Here, we have also shown that non-phasic cells in the supraoptic nucleus that are functionally identified as vasopressin cells show discharge patterning similar to the intraburst activity of phasic cells, and dissimilar to that of oxytocin cells. In non-dehydrated rats, not all non-phasic cells are oxytocin cells (typically fewer than half of all vasopressin cells fire phasically), so other criteria are needed, particularly to identify cells in non-lactating rats. Oxytocin release is increased following CCK injection, and CCK consistently activates oxytocin cells identified by reflex milk ejection; conversely, vasopressin release is inhibited by CCK (Verbalis et al. 1986a,b) and CCK inhibits some non-phasic cells. Increases in blood pressure induced for instance by phenylephrine inhibit phasic cells and some non-phasic cells, but rarely inhibit identified oxytocin cells (Leng et al. 1991). Thus non-phasic cells that are inhibited by CCK are probably mostly vasopressin cells. Spikes in phasic cells and non-phasic ‘vasopressin’ cells are followed by a transient refractoriness consistent with a HAP/AHP, succeeded by a fast, transient hyperexcitability consistent with a DAP, though the inferred DAP is more transient for non-phasic vasopressin cells than for phasic cells. Oxytocin cells in vivo showed post-spike refractoriness consistent with a HAP/AHP but no indications of a post-spike hyperexcitability as would be expected from the effects of a DAP.
Thus vasopressin cells in vivo consistently differ from oxytocin cells in displaying a transient post-spike hyperexcitability, indicative of a fast DAP, but this is not always associated with phasic firing. The hyperexcitability lasts for long enough to summate with repeated spiking, though such order effects are weak. In non-phasic vasopressin cells the post-spike hyperexcitability was more transient than in phasic cells, with potentially less opportunity to summate. Thus the conclusion that phasic firing reflects spike activity above a plateau resting potential that is sustained by summation of DAPs appears plausible. However, while this general conclusion originally derived from in vitro studies seems valid in vivo, the suggestion that phasic firing is regenerative and independent of synaptic input does not seem tenable as a description of phasic firing in vivo. Indeed, a recent study shows that evoked phasic bursts are not regenerative in vivo, but require continued excitatory input even at the onset of bursts (Brown et al. 2004).
The present type of analysis cannot address the issue of what terminates bursts — and the termination of bursts and the long refractoriness of burst generation establish the phasic firing pattern in conjunction with the mechanisms that sustain firing within bursts. The mechanisms underlying burst generation remain incompletely understood. Recently, it has become apparent that activity-dependent dendritic secretion of vasopressin (Ludwig & Leng, 1997) and dynorphin, coexpressed with vasopressin, may have an autoregulatory role in burst patterning (Brown et al. 1998, 2004) along with activity-dependent generation of nitric oxide (Srisawat et al. 2000). Recently, Brown & Bourque (2004) showed that burst termination results from activity-dependent inhibition of plateau potentials by endogenous dynorphin, and Roper et al. (2004) proposed a model of burst generation and termination in which dynorphin secretion from dendrites terminates bursts by a slow progressive desensitization to calcium of the plateau potential. Oxytocin cells also coexpress opioid peptides, and synthesize nitric oxide, though at lower levels than vasopressin cells (see Brown et al. 2000; Srisawat et al. 2000). Thus some basic mechanisms that are important for phasic firing are present in both cell types.
In summary, phasic firing in vasopressin cells in vitro appears to arise regeneratively from a relatively slow, late DAP that approaches or exceeds spike threshold. By contrast, in vivo activity is dominated by stochastic rather than deterministic mechanisms, and appears to reflect a relatively early and fast DAP that peaks below threshold but which modulates the probability that random synaptic input exceeds spike threshold. Recent work indicates that computational modelling may have the power to reconcile observations made in vitro with observations made in vivo.
Acknowledgments
This study was supported by grants from the BBSRC and the Wellcome Trust. We thank Charles Bourque for valuable comments and suggestions, and for permitting us to include data from intracellular recordings made in collaborative experiments between him and Colin Brown.
References
- Andrew RD, Dudek FE. Burst discharge in mammalian neuroendocrine cells involves intrinsic regenerative mechanism. Science. 1983;221:1050–1052. doi: 10.1126/science.6879204. [DOI] [PubMed] [Google Scholar]
- Andrew RD, Dudek FE. Analysis of intracellularly recorded phasic bursting by mammalian neuroendocrine cells. J Neurophysiol. 1984;51:552–566. doi: 10.1152/jn.1984.51.3.552. [DOI] [PubMed] [Google Scholar]
- Armstrong WE. Morphological and electrophysiological classification of hypothalamic supraoptic neurons. Prog Neurobiol. 1995;47:291–339. [PubMed] [Google Scholar]
- Armstrong WE, Smith BN, Tian M. Electrophysiological characteristics of immunochemically identified rat oxytocin and vasopressin neurones in vitro. J Physiol. 1994;475:115–128. doi: 10.1113/jphysiol.1994.sp020053. [DOI] [PMC free article] [PubMed] [Google Scholar]
- Bhumbra G, Dyball REJ. Measuring spike coding in the supraoptic nucleus. J Physiol. 2004;555:291–296. doi: 10.1113/jphysiol.2003.053264. [DOI] [PMC free article] [PubMed] [Google Scholar]
- Bourque CW, Randle JC, Renaud LP. Calcium-dependent potassium conductance in rat supraoptic nucleus neurosecretory neurons. J Neurophysiol. 1985;54:1375–1382. doi: 10.1152/jn.1985.54.6.1375. [DOI] [PubMed] [Google Scholar]
- Bourque CW, Renaud LP. Electrophysiology of mammalian magnocellular vasopressin and oxytocin neurosecretory neurons. Front Neuroendocrinol. 1990;11:183–212. [Google Scholar]
- Bourque CW, Renaud LP. Membrane properties of rat magnocellular neuroendocrine cells in vivo. Brain Res. 1991;540:349–352. doi: 10.1016/0006-8993(91)90535-4. [DOI] [PubMed] [Google Scholar]
- Brimble MJ, Dyball REJ. Characterization of the responses of oxytocin- and vasopressin-secreting neurons in the supraoptic nucleus to osmotic stimulation. J Physiol. 1977;271:253–271. doi: 10.1113/jphysiol.1977.sp011999. [DOI] [PMC free article] [PubMed] [Google Scholar]
- Brown CH, Bourque CW. Autocrine feedback inhibition of plateau potentials terminates phasic bursts in magnocellular neurosecretory cells. J Physiol. 2004;557:949–960. doi: 10.1113/jphysiol.2004.063818. [DOI] [PMC free article] [PubMed] [Google Scholar]
- Brown CH, Bull PM, Bourque CW. Phasic bursts in rat magnocellular neurosecretory cells are not intrinsically regenerative in vivo. Eur J Neurosci. 2004;19:2977–2983. doi: 10.1111/j.0953-816X.2004.03408.x. [DOI] [PubMed] [Google Scholar]
- Brown CH, Ludwig M, Leng G. Kappa-opioid regulation of neuronal activity in the rat supraoptic nucleus in vivo. J Neurosci. 1998;18:9480–9488. doi: 10.1523/JNEUROSCI.18-22-09480.1998. [DOI] [PMC free article] [PubMed] [Google Scholar]
- Brown CH, Ludwig M, Leng G. Temporal dissociation of the feedback effects of dendritically co-released peptides on rhythmogenesis in vasopressin cells. Neuroscience. 2004;124:105–111. doi: 10.1016/j.neuroscience.2003.11.038. [DOI] [PubMed] [Google Scholar]
- Brown CH, Russell JA, Leng G. Opioid modulation of magnocellular neurosecretory cell activity. Neurosci Res. 2000;36:97–120. doi: 10.1016/s0168-0102(99)00121-2. [DOI] [PubMed] [Google Scholar]
- Cunningham ET, Jr, Sawchenko PE. Reflex control of magnocellular vasopressin and oxytocin secretion. Trends Neurosci. 1991;14:406–411. doi: 10.1016/0166-2236(91)90032-p. [DOI] [PubMed] [Google Scholar]
- Destexhe A, Rudolph M, Pare D. The high-conductance state of neocortical neurons in vivo. Nat Rev Neurosci. 2003;4:739–751. doi: 10.1038/nrn1198. [DOI] [PubMed] [Google Scholar]
- Douglas AJ, Scullion S, Antonievic IA, Brown D, Leng G. Uterine contractile activity stimulates supraoptic neurons in term pregnant rats via a noradrenergic pathway. Endocrinology. 2001;142:633–644. doi: 10.1210/endo.142.2.7962. [DOI] [PubMed] [Google Scholar]
- Dudek FE, Gribkoff VK. Synaptic activation of slow depolarization in rat supraoptic nucleus neurones in vitro. J Physiol. 1987;387:273–296. doi: 10.1113/jphysiol.1987.sp016573. [DOI] [PMC free article] [PubMed] [Google Scholar]
- Dyball REJ, Tasker JG, Wuarin JP, Dudek FE. In vivo intracellular recording of neurons in the supraoptic nucleus of the rat hypothalamus. J Neuroendocrinol. 1991;3:383–386. doi: 10.1111/j.1365-2826.1991.tb00291.x. [DOI] [PubMed] [Google Scholar]
- Haller EW, Brimble MJ, Wakerley JB. Phasic discharge in supraoptic neurones recorded from hypothalamic slices. Exp Brain Res. 1978;33:131–134. doi: 10.1007/BF00238799. [DOI] [PubMed] [Google Scholar]
- Haller EW, Wakerley JB. Electrophysiological studies of paraventricular and supraoptic neurones recorded in vitro from slices of rat hypothalamus. J Physiol. 1980;302:347–362. doi: 10.1113/jphysiol.1980.sp013247. [DOI] [PMC free article] [PubMed] [Google Scholar]
- Hara K, Harris RA. The anesthetic mechanism of urethane: the effects on neurotransmitter-gated ion channels. Anesth Analg. 2002;94:313–318. doi: 10.1097/00000539-200202000-00015. [DOI] [PubMed] [Google Scholar]
- Hatton GI. Phasic bursting activity of rat paraventricular neurones in the absence of synaptic transmission. J Physiol. 1982;327:273–284. doi: 10.1113/jphysiol.1982.sp014231. [DOI] [PMC free article] [PubMed] [Google Scholar]
- Hatton GI. Emerging concepts of structure-function dynamics in adult brain: the hypothalamo-neurohypophysial system. Prog Neurobiol. 1990;34:437–504. doi: 10.1016/0301-0082(90)90017-b. [DOI] [PubMed] [Google Scholar]
- Inenaga K, Akamatsu N, Nagatomo T, Ueta Y, Yamashita H. Intracellular EGTA alters phasic firing of neurons in the rat nucleus in vitro. Neurosci Lett. 1992;147:189–192. doi: 10.1016/0304-3940(92)90592-u. [DOI] [PubMed] [Google Scholar]
- Inenaga K, Nagatomo T, Kannan H, Yamashita H. Inward sodium current involvement in regenerative bursting activity of rat magnocellular supraoptic neurones in vitro. J Physiol. 1993;465:289–301. doi: 10.1113/jphysiol.1993.sp019677. [DOI] [PMC free article] [PubMed] [Google Scholar]
- Leng G, Brown CH, Bull PM, Brown D, Scullion S, Currie J, Blackburn-Munro RE, Feng JF, Onaka T, Verbalis JG, Russell JA, Ludwig M. Responses of magnocellular neurons to osmotic stimulation involves coactivation of excitatory and inhibitory input. An experimental and theoretical analysis. J Neurosci. 2001;21:6967–6977. doi: 10.1523/JNEUROSCI.21-17-06967.2001. [DOI] [PMC free article] [PubMed] [Google Scholar]
- Leng G, Brown D, Murphy NP, Saito T, Kurokawa K, Yoshida S. Neurohypophysis. Recent Progress of Vasopressin and Oxytocin Research. The Netherlands: Elsevier Science B.V.; 1995. Patterning of electrical activity in magnocellular neurones; pp. 225–235. [Google Scholar]
- Leng G, Brown CH, Russell JA. Physiological pathways regulating the activity of magnocellular neurosecretory cells. Prog Neurobiol. 1999;57:625–655. doi: 10.1016/s0301-0082(98)00072-0. [DOI] [PubMed] [Google Scholar]
- Leng G, Dyball REJ, Greenstein B. Neuroendocrine Research Methods. Switzerland: Chur; Harwood. Academic Publishers GmbH; 1991. Functional identification of magnocellular neuroendocrine neurones; pp. 769–791. [Google Scholar]
- Leng G, Way S, Dyball RE. Identification of oxytocin cells in the rat supraoptic nucleus by their response to cholecystokinin injection. Neurosci Lett. 1991;122:159–162. doi: 10.1016/0304-3940(91)90847-m. [DOI] [PubMed] [Google Scholar]
- Li Z, Decavel C, Hatton GI. Calbindin-D28k: role in determining intrinsically generated firing patterns in rat supraoptic neurones. J Physiol. 1995;488:601–608. doi: 10.1113/jphysiol.1995.sp020993. [DOI] [PMC free article] [PubMed] [Google Scholar]
- Li Z, Hatton GI. Ca2+ release from internal stores: role in generating depolarizing after-potentials in rat supraoptic neurones. J Physiol. 1997;498:339–350. doi: 10.1113/jphysiol.1997.sp021862. [DOI] [PMC free article] [PubMed] [Google Scholar]
- Luckman SM, Dyball REJ, Leng G. Induction of c-fos expression in hypothalamic magnocellular neurons requires synaptic activation and not simply increased spike activity. J Neurosci. 1994;14:4825–4830. doi: 10.1523/JNEUROSCI.14-08-04825.1994. [DOI] [PMC free article] [PubMed] [Google Scholar]
- Ludwig M, Leng G. Autoinhibition of supraoptic nucleus vasopressin neurons in vivo — a combined retrodialysis/electrophysiological study in rats. Eur J Neurosci. 1997;9:2532–2540. doi: 10.1111/j.1460-9568.1997.tb01682.x. [DOI] [PubMed] [Google Scholar]
- Mason WT. Electrical properties of neurons recorded from the rat supraoptic nucleus in vitro. Proc Roy Soc Lond B Biol Sci. 1983a;217:141–161. doi: 10.1098/rspb.1983.0003. [DOI] [PubMed] [Google Scholar]
- Mason WT. Excitation by dopamine of putative oxytocinergic neurones in the rat supraoptic nucleus in vitro: evidence for two classes of continuously firing neurones. Brain Res. 1983b;267:113–121. doi: 10.1016/0006-8993(83)91044-2. [DOI] [PubMed] [Google Scholar]
- Mason WT, Leng G. Complex action potential waveform recorded from supraoptic and paraventricular neurones of the rat. evidence for sodium and calcium spike components at different membrane sites. Exp Brain Res. 1984;56:135–143. doi: 10.1007/BF00237449. [DOI] [PubMed] [Google Scholar]
- Nissen R, Hu B, Renaud LP. Regulation of spontaneous phasic firing of rat supraoptic vasopressin neurones in vivo by glutamate receptors. J Physiol. 1995;484:415–424. doi: 10.1113/jphysiol.1995.sp020674. [DOI] [PMC free article] [PubMed] [Google Scholar]
- Poulain DA, Brown D, Wakerley JB, Leng G. Pulsatility in Neuroendocrine Systems. Boca Raton FL USA: CRC Press, Inc.; 1988. Statistical analysis of patterns of electrical activity in vasopressin and oxytocin-secreting neurones; pp. 119–154. [Google Scholar]
- Renaud LP, Bourque CW. Neurophysiology and neuropharmacology of hypothalamic magnocellular neurons secreting vasopressin and oxytocin. Prog Neurobiol. 1991;36:131–169. doi: 10.1016/0301-0082(91)90020-2. [DOI] [PubMed] [Google Scholar]
- Renaud LP, Tang M, McCann MJ, Stricker EM, Verbalis JG. Cholecystokinin and gastric distension activate oxytocinergic cells in rat hypothalamus. Am J Physiol. 1987;253:R661–R665. doi: 10.1152/ajpregu.1987.253.4.R661. [DOI] [PubMed] [Google Scholar]
- Rhodes CH, Morrell JI, Pfaff DW. Immunohistochemical analysis of magnocellular elements in rat hypothalamus. distribution and numbers of cells containing neurophysin, oxytocin, and vasopressin. J Comp Neurol. 1981;198:45–64. doi: 10.1002/cne.901980106. [DOI] [PubMed] [Google Scholar]
- Roper P, Callaway J, Armstrong W. Burst initiation and termination in phasic vasopressin cells of the rat SON: a combined mathematical, electrical and calcium fluorescence study. J Neurosci. 2004;24:4818–4831. doi: 10.1523/JNEUROSCI.4203-03.2004. [DOI] [PMC free article] [PubMed] [Google Scholar]
- Roper P, Callaway J, Shevchenko T, Teruyama R, Armstrong W. AHP's HAP's and DAP's: How potassium currents regulate the excitability of rat supraoptic neurons. J Comput Neurosci. 2003;15:367–389. doi: 10.1023/a:1027424128972. [DOI] [PubMed] [Google Scholar]
- Srisawat R, Ludwig M, Bull PM, Douglas AJ, Russell JA, Leng G. Nitric oxide and the oxytocin system in pregnancy. J Neurosci. 2000;20:6721–6727. doi: 10.1523/JNEUROSCI.20-17-06721.2000. [DOI] [PMC free article] [PubMed] [Google Scholar]
- Summerlee AJ. Extracellular recordings from oxytocin neurones during the expulsive phase of birth in unanaesthetized rats. J Physiol. 1981;321:1–9. doi: 10.1113/jphysiol.1981.sp013967. [DOI] [PMC free article] [PubMed] [Google Scholar]
- Teruyama R, Armstrong WE. Changes in the active membrane properties of rat supraoptic neurones during pregnancy and lactation. J Neuroendocrinol. 2002;14:933–944. doi: 10.1046/j.1365-2826.2002.00844.x. [DOI] [PubMed] [Google Scholar]
- Verbalis JG, McCann MJ, McHale CM, Stricker EM. Oxytocin secretion in response to cholecystokinin and food: differentiation of nausea from satiety. Science. 1986a;232:1417–1419. doi: 10.1126/science.3715453. [DOI] [PubMed] [Google Scholar]
- Verbalis JG, McHale CM, Gardiner TW, Stricker EM. Oxytocin and vasopressin secretion in response to stimuli producing learned taste aversions in rats. Behav Neurosci. 1986b;100:466–475. doi: 10.1037//0735-7044.100.4.466. [DOI] [PubMed] [Google Scholar]
- Wakerley JB, Poulain DA, Brown D. Comparison of firing patterns in oxytocin- and vasopressin-releasing neurons during progressive dehydration. Brain Res. 1978;148:425–440. doi: 10.1016/0006-8993(78)90730-8. [DOI] [PubMed] [Google Scholar]
- Yamashita H, Inenaga K, Kawata M, Sano Y. Phasically firing neurons in the supraoptic nucleus of the rat hypothalamus: immunocytochemical and electrophysiological studies. Neurosci Lett. 1983;37:87–92. doi: 10.1016/0304-3940(83)90509-8. [DOI] [PubMed] [Google Scholar]


