Abstract
Cardiac Ca2+ transients are enhanced by cAMP-dependent protein kinase (PKA). However, PKA-dependent modulation of ryanodine receptor (RyR) function in intact cells is difficult to measure, because PKA simultaneously increases Ca2+ current (ICa), SR Ca2+ uptake and SR Ca2+ loading (which independently increase SR Ca2+ release). We measured ICa and SR Ca2+ release ± 1 μm isoproterenol (ISO; isoprenaline) in voltage-clamped ventricular myocytes of rabbits and transgenic mice (expressing only non-phosphorylatable phospholamban). This mouse model helps control for any effect of ISO-enhanced SR uptake on observed release, but the two species produced essentially identical results. SR Ca2+ load and ICa were adjusted by conditioning. We thus evaluated PKA effects on SR Ca2+ release at constant SR Ca2+ load and ICa trigger (with constant unitary ICa). The amount of SR Ca2+ release increased as a function of either ICa or SR Ca2+ load, but ISO did not alter the relationships (measured as gain or fractional release). This was true over a wide range of SR Ca2+ load and ICa. However, the maximal rate of SR Ca2+ release was ∼50% faster with ISO (at most loads and ICa levels). We conclude that the isolated effect of PKA on SR Ca2+ release is an increase in maximal rate of release and faster turn-off of release (such that integrated SR Ca2+ release is unchanged). The increased amount of SR Ca2+ release normally seen with ISO depends primarily on increased ICa trigger and SR Ca2+ load, whereas faster release kinetics may be the main result of RyR phosphorylation.
Cardiac manifestations of adrenergic stimulation (inotropy, chronotropy and lusitropy) were already under investigation by 1900 (Elliott, 1905). Via protein kinase A (PKA) activation, β-adrenergic receptor (β-AR) activation promotes phosphorylation of at least four cellular targets which have key roles in the control of excitation–contraction coupling (ECC) and Ca2+-induced Ca2+ release (CICR). PKA-dependent phosphorylation of: (1) troponin-I (TnI) reduces myofilament Ca2+ sensitivity (Zhang et al. 1995), (2) L-type Ca2+ channels increases Ca2+ current (ICa, due mainly to increased open probability; Bean et al. 1984), (3) phospholamban (PLB) enhances SR Ca2+-ATPase activity and SR Ca2+ load (by disinhibiting SR Ca2+-ATPase; Lindemann et al. 1983), (4) ryanodine receptor/Ca2+ release channels (RyR) can alter function as described below (Yoshida et al. 1992; Marx et al. 2000). Since non-subtype-selective β-AR agonists like isoproterenol (ISO) normally phosphorylate all these targets simultaneously, the balance of effects on ECC in the intact cell is complex. This study evaluates how PKA-dependent RyR phosphorylation affects RyR behaviour during ECC, independently of effects on ICa, TnI or PLB.
In cardiac RyRs in isolation in lipid bilayers (in steady state), PKA activation led to enhanced open probability (Po) and appearance of submaximal conductance states, with a net increase in integrated Ca2+ flux (Marx et al. 2000,2001). These PKA effects were correlated with unbinding of the FK-506 binding protein (FKBP-12.6) from the RyR, where FKBP-12.6 bound to RyR normally stabilizes and coordinates RyR gating, minimizing substate occurrence and SR Ca2+ leak (Marx et al. 2001; Prestle et al. 2001). On the other hand, Valdivia et al. (1995) showed that PKA decreased steady-state RyR Po in bilayers, but enhanced the transient peak Po in response to a rapid rise in activating [Ca2+] (meant to simulate what happens in ECC). Extrapolating these disparate RyR bilayer results to intact cells, we might or might not expect enhanced SR Ca2+ release with PKA (for a given ICa trigger and SR Ca2+ load).
Li et al. (2002) studied PKA effects on resting Ca2+ sparks in intact and permeabilized ventricular myocytes, thereby retaining RyR in a more physiological local environment. Ca2+ sparks reflect the stochastic resting openings of clusters of RyRs and are probably the main route of Ca2+ leak from the SR (Cheng et al. 1993; Bers, 2001). PKA greatly stimulated Ca2+ spark frequency in these myocytes, but only when PLB could be phosphorylated (which caused SR Ca2+ load to increase). In mice that either lack PLB or express only a mutant PLB which lacks both the Ser16 and Thr17 regulatory phosphorylation sites (the latter used also in the present study), Ca2+ spark frequency and characteristics were unchanged, despite direct evidence of RyR phosphorylation. Evidently, PKA activation does not affect RyR leak much during rest. However, the situation could be quite different during ECC where ICa triggers RyR opening. Intact stimulated cells are required to assess this.
With β-AR stimulation, larger and faster relaxing [Ca2+]i transients are routinely observed in cardiac myocytes (Callewaert et al. 1988), and the typical bell-shaped dependence of [Ca2+]i transients on membrane voltage usually becomes flat-topped (Hussain & Orchard, 1997). However, in these studies, both the ICa trigger and SR Ca2+ load increased simultaneously with ISO. Since both load and trigger strongly affect ECC/CICR independently of β-AR modulation (Bassani et al. 1995b; Shannon et al. 2000), these studies do not reveal how intrinsic RyR function is altered independently of ICa or SR Ca2+ load changes.
β-AR stimulation led to more spatially organized and time-synchronized depolarization-induced Ca2+ release in rat ventricular myocytes (Song et al. 2001) and post-infarct border zone rabbit myocytes (Litwin et al. 1998). The former reported a decrease of ECC gain with ISO, but in that study most ICa triggers with ISO were large, a possibly saturating condition where we see ECC gain to be at its lowest with or without ISO (note that ECC gain is usually some function of Ca2+ release/ICa). In contrast, Viatchenko-Karpinski & Györke (2001) found increased ECC gain with ISO, but only when both intra- and extracellular Na+ were present (implying a role of Na+–Ca2+ exchange, which can alter the spatial properties and stability of the Ca2+ trigger; Sham, 2000). delPrincipe et al. (2001) also detected an ISO-mediated increase in ECC gain, especially near threshold. They used a controlled flash-photolytic Ca2+ trigger (rather than ICa), in cells at constant SR load. While this technique offers close control of the Ca2+ trigger, it is less physiological than ICa. Taken together, these disparate results indicate that Ca2+ release in active cells is strongly dependent on specifics of the trigger and SR Ca2+ load.
A unique feature of our experiments is that we compared fractional SR Ca2+ release (and ECC gain) ± ISO over a broad range of controlled ICa triggers and SR Ca2+ loads. We used steady-state pre-inactivation of ICa to control ICa (rather than test membrane potential (Em) or external [Ca2+]). This helped us adjust triggers with ISO over a wide range, including moderate non-saturating values expected during APs. In fact ISO versus control comparisons were made at comparable macroscopic ICa and identical unitary ICa amplitude, test voltage and external [Ca2+]. We used varying conditioning pulses to obtain overlapping SR Ca2+ loads (± ISO). This extends our previous strategy (Li et al. 1997) where we showed that calmodulin-dependent protein kinase II (CaMKII) activation profoundly enhanced SR Ca2+ release for a given ICa and SR Ca2+ load (over a range of ICa triggers).
Further, although we used mainly rabbit ventricular myocytes, we also used a recently developed mouse model expressing only mutant PLB where both phosphorylation sites (Ser16 and Thr17) are mutated to Ala. This mutant PLB was reintroduced in the PLB knockout (Luo et al. 1994) background. The SR Ca2+-ATPase in this model has a Ca2+ affinity comparable to wild-type mice, but cannot be stimulated by ISO (Brittsan et al. 2003). This made it both easier to control SR Ca2+ loading ± ISO, and also prevented the acceleration of [Ca2+]i decline seen in ISO (which could complicate Ca2+ release analysis).
Here we find, as expected, that under fixed conditions (either control or ISO), increasing ICa or SR Ca2+ load enhance fractional SR Ca2+ release (and enhanced SR Ca2+ load enhances ECC gain). For comparable ICa and SR Ca2+ load, ISO had little effect on either SR fractional release or ECC gain, but did cause a significant increase in the SR Ca2+ release rate.
Methods
Cell preparation
All cells were isolated using species-specific protocols approved by Loyola University's Institutional Animal Care and Use Committee (IACUC). The nominally Ca2+-free cell isolation solution was either Tyrode solution (mm: NaCl 140, KCl 4, MgCl2 1, and Hepes 10; pH 7.2) or Dulbecco's minimal essential medium gassed with 95% O2–5% CO2 (DMEM; Type 22300, Gibco/Invitrogen, USA). Rabbits were anaesthetized with sodium pentobarbital (50 mg kg−1i.v.) and deep anaesthesia verified (complete absence of reflex on repeated corneal touch and foot pinch). Hearts were excised (at which time the animal died of exsanguination), rinsed in ice-cold Ca2+-free solution, and retrogradely perfused at 37°C, at either constant flow (30–36 ml min−1) or preferably constant pressure (80 mmHg). After 5 min of perfusion with Ca2+-free solution, collagenase (0.3–0.7 mg ml−1; Yakult Corporation, Japan or Boehringer Mannheim, Germany) and Ca2+ (10–20 μm) were added. After 15–25 min, perfusion was stopped and ventricles were minced into ∼2 mm3 size pieces. Optionally the pieces were incubated for 5–20 min in fresh enzyme. Finally, enzyme activity was stopped with DMEM solution containing bovine serum albumin (BSA; 0.5–1%), and tissue was agitated or triturated to liberate single cells. These were washed and stored in DMEM solution adjusted to [Ca2+]= 150 μm.
Mice were anaesthetized (inhalation of 2–3% isoflurane in 100% O2), tracheotomized and mechanically ventilated. Upon verifying total insentience (complete absence of reflex on repeated corneal touch and foot pinch), we opened the chest cavity, injected cold high-K+ cardioplegia solution into the vena cava, quickly excised the heart (at which time the mouse died of exsanguination), and transferred it to our gravity-driven (80 mmHg) apparatus for perfusion at 37°C. The initial flow rate, ∼3 ml min−1, increased during digestion, and this increase was a criterion for ending perfusion. After enzyme perfusion the mouse hearts were further treated as described above for rabbit. All mice were the PLB double mutants described in the introduction.
Fluorescent measurement of [Ca2+]i
Cells were plated on single-use laminin-coated glass cover slips and mounted on an epifluorescence microscope. We loaded rabbit cells with 10 μm indo-1 AM, applied externally for 22–27 min at 23°C, and allowed an equal time for washing and de-esterification. Indo-1 was excited at 365 ± 5 nm and emitted fluorescence (405 ± 10 nm and 485 ± 10 nm) was recorded at 100 Hz bandwidth. The background-subtracted ratio (R) of fluorescence at 405 nm versus 485 nm was converted to [Ca2+]i using [Ca2+]i=Kdβ(R−Rmin)/(Rmax−R) (Grynkiewicz et al. 1985). Rmin, Rmax, and β were determined and Kd was taken as 844 nm (Bassani et al. 1995a).
Mouse (and some rabbit) myocytes were loaded with fluo-3 AM for 25–40 min, with a comparable de-esterification time. Cells were excited at 480 ± 5 nm, and emission was recorded at 535 ± 20 nm [Ca2+]i, was determined using (Cheng et al. 1993):
where R was emitted fluorescence divided by resting emitted fluorescence, each after background subtraction. [Ca2+]rest was taken as 100 nm, and Kd= 1100 nm was used to calculate [Ca2+]i. No difference in results was evident between the two indicators.
Solutions and recording conditions
ICa was recorded in perforated patch whole cell voltage clamp (120 μg ml−1 amphotericin-B) to prevent rundown. Capacitance was cancelled and series resistance was compensated as needed. Cells were recorded in a modified Tyrode solution containing (mm: NaCl 140, CsCl 4, MgCl2 1, CaCl2 1 (for mouse) or 2 (for rabbit), and Hepes 10; pH 7.4 at 23°C) with niflumate (30 μm) included to block Cl− currents. ISO was freshly made (<1.5 h before use) and added at 0.3–1 μm. This same solution with caffeine (10 mm) added was rapidly applied for SR Ca2+ load measurements. The pipette solution contained 40 mm CsCl and 80 mm of either caesium methanesulphonate or caesium glutamate, Hepes 10 mm (pH 7.2), 1 mm MgCl2 and 1 mmKCl, the latter to ensure a counter-ion supply for SR Ca2+ release (Litwin et al. 1998). The liquid junction potential (13 mV, pipette negative) was corrected. We kept the pipette solution Na+ free and INa inactivated (see below) to minimize subsarcolemmal [Na+] and avoid Ca2+ influx via outward Na+–Ca2+ exchange current (INaCaX). These solutions assured that all depolarization-activated current was ICa and that all Na+–Ca2+ exchange current flowed as post-pulse inward tail current (Trafford et al. 1997).
Measurement of SR Ca2+ load
SR Ca2+ content was measured relative to non-mitochondrial cell volume as described (Ginsburg et al. 1998). [Ca2+]i at rest and at peak during caffeine application were each converted to total cytosolic Ca2+ considering Ca2+ binding at high and low affinity sites and by the fluorophore ([Ca]T=[Ca2+]i+ 203 μm/(1 + 420 nm/[Ca2+]i) + 703 μm/(1 + 79000 nm/[Ca2+]i) + 50 μm/(1 + 1000 nm/[Ca2+]i; Hove-Madsen & Bers, 1993; Bers, 2001), and the difference (Δ[Ca]T) was taken as the SR Ca2+ load. In most cells, caffeine-induced INaCaX was recorded and fitted, and the fit was integrated (Varro et al. 1993), for an additional confirmatory measure of SR Ca2+ content.
Recording protocols
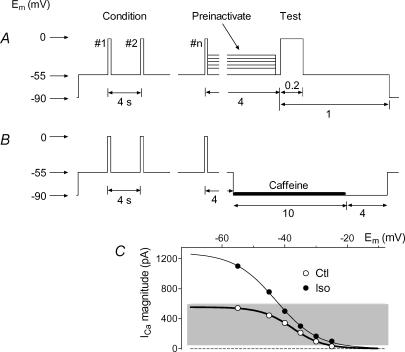
Figure 1A shows the protocol used in all experiments except those in Fig. 2 to condition the SR to a particular load and then evoke twitch responses. SR loading was adjusted by changing the number of pulses (n= 15) at 0.25 Hz, their depolarization level and/or duration as needed. After a conditioning series, one of usually six different test trigger amplitudes was applied. The trigger strength was adjusted by pre-inactivation of ICa at various holding potentials (Vhold) levels for 4 s after the conditioning, but all test triggers were depolarizations to 0 mV. As shown by example in Fig. 1C (with both sets of ICa from the same cell), trigger strength could be adjusted over a similar range ± ISO (grey background), by shifting the range of pre-inactivating Em. Cells were held at −90 mV between trials to promote inward INaCaX and thereby minimize SR reloading independently of the applied conditioning, but in order to keep INa inactivated, Vhold was never negative of −55 mV during a trial. As shown in Fig. 1B, after the six sequences of conditioning–test twitch we applied a final identical conditioning series followed by caffeine (10 mm) to measure the corresponding SR load.
Figure 1. Experimental protocol.
A, voltage clamp protocol to evoke twitch contractions with various sized ICa in a cell whose SR was repeatedly loaded with the same conditioning regime. Pre-inactivation followed by depolarization, always to 0 mV, was used to vary ICa without changing unitary Ca2+ flux. B, immediately after the protocol shown in A, the same conditioning was repeated, followed by application of 10 mm caffeine, to measure the conditioned load. C, example showing substantially overlapping (grey background) ICa magnitudes attained ± ISO by adjusting pre-inactivation voltage (all traces from same cell).
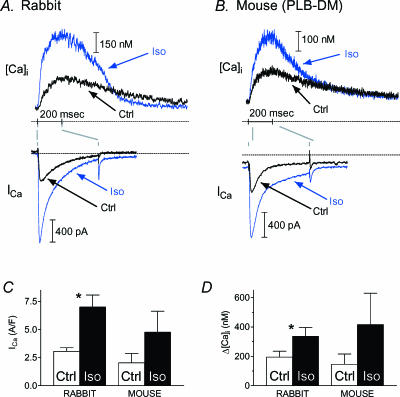
Figure 2. ISO effects with uncontrolled ICa trigger and SR Ca2+ load.
In cells stimulated infrequently (≤ 0.05 Hz) to maximize ICa recovery, but otherwise without specific control of trigger and load, ICa and [Ca2+]i increased on adding ISO (blue traces) in both rabbit (A) and DM mouse (B). [Ca2+]i transient decay accelerated in rabbit but not in DM mouse. C and D, average ICa density and [Ca2+]i transient size in rabbit (n= 10; *P≤ 0.05, Student's t test) and mouse (n= 3; not tested).
Data treatment
Peak [Ca2+]i and time to peak were found directly from the traces for both twitch- and caffeine-induced transients. We determined other features of [Ca2+]i by fitting, which overcomes subjectivity and variation due to noise. The decaying portions of all [Ca2+]i transients in a given series (sharing one SR load) were fitted to establish the decay time constant τ, with all sharing a common asymptote for that series. This fitted asymptote was taken as the baseline, to make maximum use of the data and avoid bias in case [Ca2+]i did not decay quite fully within a record. Twitch amplitude was the difference between peak and asymptotic values. After all decays were fitted, rising phases of twitch [Ca2+]i were fitted to a Boltzmann sigmoidal function:
 |
to establish the maximum rate of rise and its time of occurrence.
Peak ICa and time to peak were found directly from the traces. To establish ΔICa and a baseline for integration, ICa decay post peak was fitted to a weighted sum of two exponentials with asymptote. Only the depolarized region of ICa (always at 0 mV) was fitted, so no leak correction was needed. All ICa values in a given series (sharing one SR load) were readily fitted with a common asymptote (prediction for 0 mV at t=∞). Using the long decaying portion of ICa to determine a common baseline minimized uncertainty, especially for smaller ICa which may be critical in assessing ECC gain changes. Recorded current often shifted outward with ISO (presumably due to unsuppressed CFTR Cl− channel current), but by defining ICa as peak minus fitted baseline (all at 0 mV) we removed any influence of this shift. All ICa in Figs 2–5 were adjusted for plotting so that the fitted asymptote fell on the dotted line. Error bars in figures are ±s.e.m.
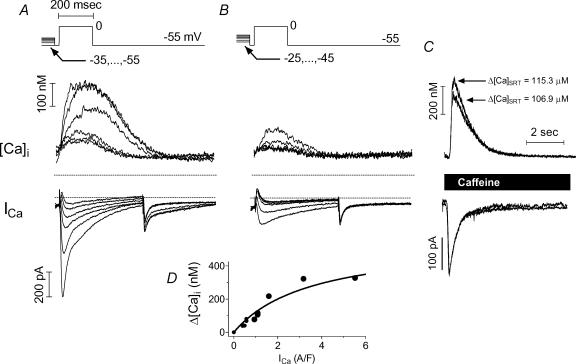
Figure 5. Free Ca2+ release increased in graded then saturating fashion with increasing trigger strength at constant SR load.
A, [Ca2+]i transients and ICa in a larger series generated by pre-inactivating with Vh=−55, −47, −42, −39, −36, −33 mV. B, [Ca2+]i transients and ICa in a smaller series generated by pre-inactivating with Vh=−45, −40, −34, −31, −28, −25 mV. C, SR loads in the two series matched closely according to [Ca2+]i transient and INaCaX. Rabbit cell during ISO treatment. Cell responded robustly on application of ISO (not shown). D, both sets of release followed the same functional dependence on ICa.
Results
We obtained 105 sets of (normally 6) trigger ICa–SR release Δ[Ca2+]i couples with a corresponding SR load from 37 cells (28 rabbit, 9 mouse). This resulted in 664 individual trigger–release couples. We combined rabbit and mouse data, because there were no discernible differences (except where specifically noted below; Fig. 12B) when they were analysed separately.
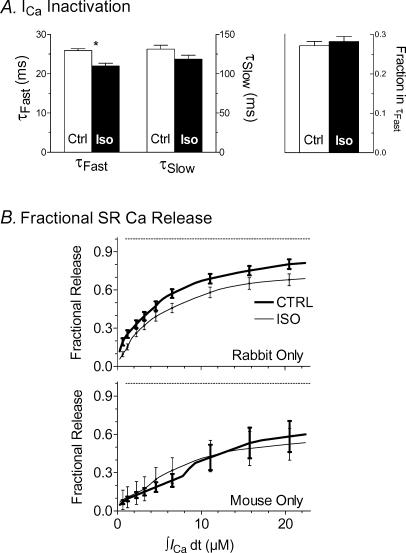
Figure 12. ICa inactivation and species dependence of fractional SR Ca2+ release.
A, ICa decline was fitted to a biexponential function; the fast decay time constant τfast shortened with ISO, but τslow and the proportion of amplitude in the fast component did not change. B, fractional SR Ca2+ release data from Fig. 9, separated by species (including all SR Ca2+ load groups), shows constancy of release ± ISO in mouse.
Canonical ISO effects
Figure 2 shows that both ICa and the [Ca2+]i transient from a rabbit (A) and a mouse (B) cell increased on ISO addition (blue traces). In these records we did not specifically control trigger or SR Ca2+ loading. Instead of using the protocol in Fig. 1, we depolarized cells infrequently (≤ 0.05 Hz) to promote maximal ICa availability. In rabbit, but not mouse (lacking phosphorylatable PLB), the [Ca2+]i transient decayed faster with ISO (note crossover of traces in rabbit). Uncontrolled ICa–[Ca2+]i pairs were obtained from most cells with paired control–ISO data (including washout, not shown, in some cases), to confirm that ISO produced its expected effects in our situation, and also that the cells did not run down. C and D in Fig. 2 show, respectively, that both ICa and [Ca2+]i amplitude increased substantially in rabbit. As expected, the time constant (τ) for monoexponentially fitted [Ca2+]i decay decreased in rabbit by 53% (from 700 ± 128 to 329 ± 64 ms; n= 10 cells; P < 0.05, not shown). Similar increases in ICa and [Ca2+]i amplitude occurred, but decay τ was less affected, as expected in the PLB mutant mouse (see Fig. 2B). An ISO-mediated increase of ICa and [Ca2+]i without any change in decay kinetics has been verified previously in this model (Brittsan et al. 2003).
Ca2+ release with matched triggers and SR loads
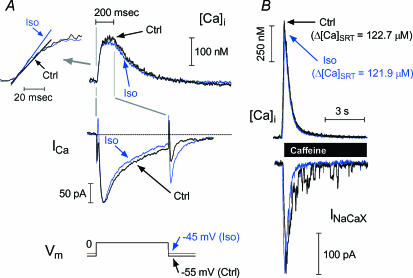
Figure 3A shows twitch [Ca2+]i and ICa recorded ± ISO using the protocol in Fig. 1. Traces were selected where the trigger ICa and SR Ca2+ load (Fig. 3B) were very closely matched. An appropriate range of ICa triggers was obtained by pre-inactivating at −45 mV in ISO versus−55 mV in control. In this example, from a DM mouse myocyte, the Ca2+ transients ± ISO are virtually identical. There is a minor increase in ICa decay rate with ISO (a point we will consider below). This would suggest that ISO has only very minor effects on overall RyR behaviour during ECC, but as shown in the inset (Fig. 3A, left) the maximal rate of rise of [Ca2+]i also increased discernibly.
Figure 3. ISO response with ICa trigger and SR Ca2+ load held constant.
Example records of [Ca2+]i and ICa (A) with closely matched ICa amplitude, from one DM mouse myocyte, in control (black traces) and ISO (blue traces). [Ca2+]i transient amplitude was unaffected by ISO, but inset (A, left) shows that maximum rate of rise of [Ca2+]i increased. B, caffeine-evoked [Ca2+]i and inward Na+–Ca2+ exchange currents show that SR Ca2+ loading was well matched.
Statistical testing for differences in Ca2+ release and ECC gain ± ISO would ideally be based on directly paired records like those in Fig. 3. However, it was difficult to match both trigger and load precisely in a record pair, and as we show next, independently of ISO, Ca2+ release depends profoundly on both. Accordingly we developed release/gain functions which describe each record. These functions were then compared over corresponding trigger and load ranges.
Ca2+ release was strongly affected by trigger and SR load
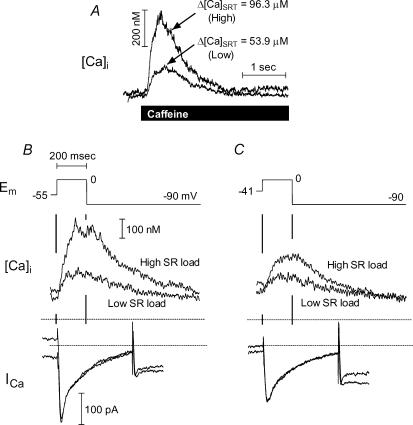
Figure 4, shows that, independently of ISO, increasing SR Ca2+ load increased twitch Ca2+ release when trigger ICa was held constant. Figure 4A shows larger and smaller SR loads, while Fig. 4B and C shows twitch [Ca2+]i and ICa for two different trigger strengths at the respective loads. The rabbit cell in these records was not treated with ISO, but later gave a robust ISO response (not shown). Because the ICa trigger was constant in both B and C in Fig. 4, the different transient amplitudes indicate a load-dependent change in ECC gain.
Figure 4. E–C coupling gain increased with SR Ca2+ load at constant trigger strength.
A, Caffeine-induced [Ca2+]i transients showing high and low SR loads. Below are responses at the two loads to two trigger strengths, set with either minimal (B; Vh=−55 mV) or substantial (C; Vh=−41 mV)ICa pre-inactivation. Rabbit cell, control only. This cell subsequently responded robustly to ISO (not shown).
Figure 5 (from another rabbit cell) shows that (independently of ISO) SR Ca2+ release increased with increasing ICa trigger strength. The larger amplitude ICa series (A) graded Ca2+ release over a larger range than the smaller ICa series (B), while the SR Ca2+ loading was nearly constant (106.9 μmol (l cytosol)−1 for the large trigger series versus 115.3 for the small series). All traces in this example were recorded with ISO. It is notable that pre-inactivation in the range of −45 to −25 mV produced small graded responses, despite the presence of ISO and despite the slightly higher SR Ca2+ loading in the pre-inactivated series (i.e. any sensitization of Ca2+ release by ISO should be apparent with these small triggers). For these two twitch series, release as a function of peak ICa trigger fell along a single saturating function (inset, upper left). Twitches due to fully activated ICa (not shown) recorded before and after these two series showed that this cell was strongly responsive to ISO and did not run down.
Ca2+ release and gain functions at constant SR load
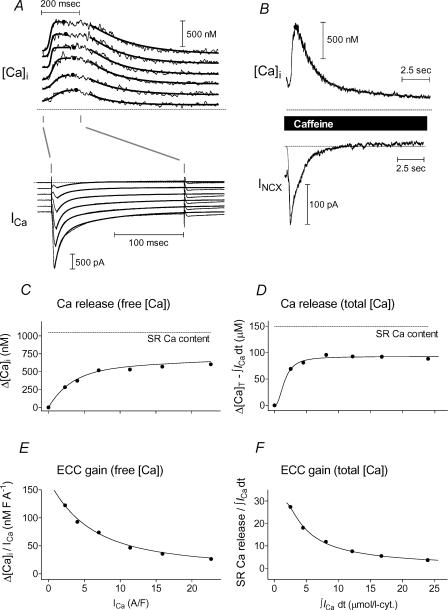
Figure 6 shows how we obtained one Ca2+ release and one ECC gain function for free [Ca2+], along with corresponding functions for total [Ca2+], as well as a maximum rate of rise and time to maximum rate of rise (not shown) from each set of six twitches (Fig. 6A) with a corresponding SR load (Fig. 6B). Figure 6A shows curves fitted separately for rise and decay segments of [Ca2+]i transients and ICa decay.
Figure 6. Release and gain functions.
A, top, [Ca2+]i transients and ICa from a set of 6 twitches associated with a particular conditioned SR Ca2+ load. Traces shown separated by 200 pA (ICa) and 200 nm ([Ca2+]i), respectively, for clarity. [Ca2+]i peaks and times of peak were found by examination (dots). Maximum rates of rise (with times of occurrence), half-decay times, and a common asymptotic baseline were all found by fitting (bold lines). A, bottom, ICa was similarly fitted with a common asymptote serving as a baseline for amplitude and integral calculations. B, corresponding caffeine-evoked [Ca2+]i (top) and INaCaX (bottom) were also fitted (same baseline as the twitch [Ca2+]i in A) to establish SR Ca2+ load. C, Ca2+ release data (peak – asymptotic [Ca2+]i) are fitted to allow interpolation or extrapolation to ICa values not specifically measured. Dotted line indicates SR Ca2+ load. D, same as C, but peak and asymptotic free Ca2+ were first converted to total [Ca] and subtracted, and then Ca2+ influx (ICa integral) was removed to find net change in total [Ca]. E and F, same as C and D, respectively, with all data converted to gain by expressing release/influx.
Figure 6B shows fits for the decay of the caffeine-evoked free [Ca2+]i transient (top, biexponential) and the entire Na+–Ca2+ exchange current (bottom, sigmoidal rise/exponential decay), used to determine SR Ca2+ loads.
To allow a comparison of responses among twitch sets over useful ranges of peak ICa and Ca2+ influx values, we fitted each set of Ca2+ release data to a three-parameter saturating function, e.g. sigmoidal, piecewise linear, etc., as shown in Fig. 6C (points: data; curve: fit) for free Δ[Ca2+]i and Fig. 6D for total calcium. Total calcium release was defined as twitch Δ[Ca]T−∫ICadt (the change in total [Ca2+] due to release with the cumulated Ca2+ influx removed), with ∫ICadt measured with respect to the ICa common asymptote. Integration was started when inward-going ICa first crossed the asymptotic value and carried out as far as the time of the corresponding peak twitch [Ca2+]i transient (dots on traces in Fig. 6A).
Fractional SR release was calculated by normalizing fitted predictions to the measured SR Ca2+ content (dotted lines in Fig. 6C and D). Figure 6E and F show corresponding ECC gain functions (obtained as slopes of the data and curves in Fig. 6C–D).
The ordinate in Fig. 6C has units of nm, while that in Fig. 6D is in μm. Thus the gain function in Fig. 6E is in nm× F × A−1, while that in Fig. 6F is dimensionless.
Ca2+ release in virtually every record increased with increasing trigger in a saturating manner, indicating a decreasing gain (for both free and total [Ca]). Release/gain functions from data like those in Figs 4 and 5 showed very clear systematic changes due to SR Ca2+ loading and trigger, respectively (independently of ISO). Thus our method of parameterizing Ca2+ release/gain is well suited to detecting any changes due to ISO.
Range and grouping of ICa and SR loads in control and ISO
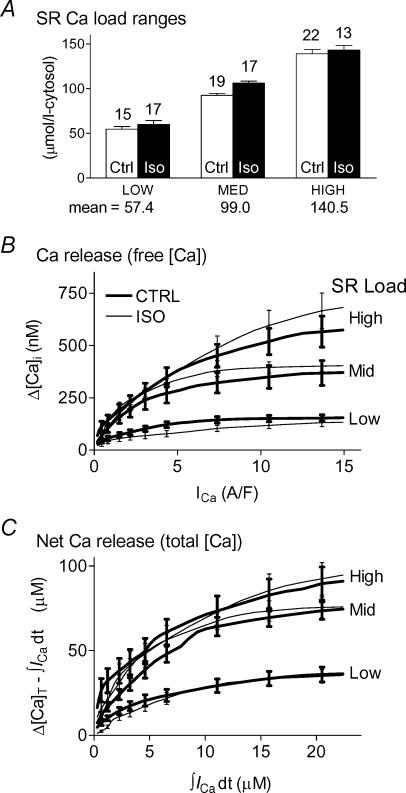
As shown in Fig. 7A, we grouped attained SR Ca2+ loads in three ranges (± ISO), to match their means and to put comparable numbers of functions in each group (see Fig. 7 for values). We might expect Ca2+ release to be enhanced with ISO (see Introduction), but this could be obscured if SR loading decreased with ISO. To avoid this possible pitfall, we built the SR load groups so that the mean load in each group was at least as high + ISO as without ISO. Trigger ICa influxes (peak ICa) were studied over the range 0.2–15 A F−1 while corresponding ICa integrals were examined over the range 0.3–22 μm (respective x-axes in Fig. 6C and D). These ranges extend well below and above the typical ICa peak influx (∼4 A F−1) during action potentials, which would be of the most physiological interest (Yuan et al. 1996).
Figure 7. Ca2+ release amplitude did not change with ISO.
A, classification of SR load data in three overlapping ranges ± ISO. Load group boundaries were set to give comparable mean values and numbers of observations in each group. B and C, Ca2+ release functions expressed as free Δ[Ca2+]i (B) and total Δ[Ca]T (C) increased with trigger in saturating fashion, and also increased with SR load. ISO affected free Ca2+ release minimally and unsystematically, especially compared with effects of trigger and load themselves. Each trace is the average of predictions made for the available data in a given load range (n shown in Fig. 7A). Error bars (±s.e.m.) were placed at visually convenient intervals.
Amplitude-based Ca2+ release and gain were minimally affected by ISO
In Fig. 7 we also show Ca2+ transient amplitude (B) and total SR Ca2+ release (C) in the three SR load ranges, for control (thick lines) and ISO (thin lines). Each curve is the average of n curves (n shown in Fig. 7A) for the corresponding load and condition. All release functions saturated, but saturation appeared at higher influxes when SR load was higher. Release increased systematically with increasing load or increasing trigger, and these changes were greater than any change in release ± ISO within a given load range. The small changes seen with ISO were unsystematic; i.e. for either free or total [Ca], release could be slightly reduced, increased, or unaffected by ISO.
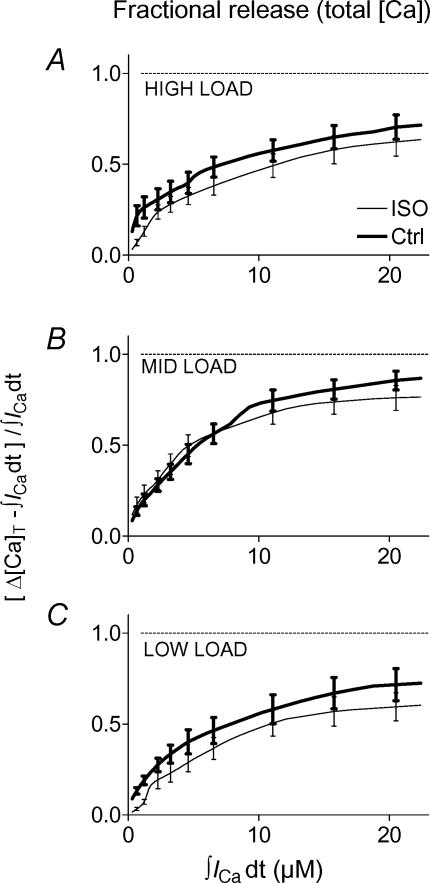
Figure 8 shows fractional SR Ca2+ release based on total calcium for high (A), medium (B) and low (C) SR load ranges. Release functions were averaged as in Fig. 7, but each release datum was normalized to its corresponding SR load before being included in the average. Because fractional release overcomes small cell-to-cell variations in SR load and is constrained between 0 and 1, it might reveal ISO effects more sensitively. Fractional release, like absolute increase, saturated at higher influxes with higher SR load, but the fraction at saturation was quite constant near 0.6–0.8 in all cases. Fractional release was either slightly reduced or unaffected by ISO (see also Fig. 12B).
Figure 8. Fractional Ca2+ release did not change with ISO.
The predictions of Fig. 7B for total calcium release are shown converted to a fraction of the SR Ca2+ load released, to help separate the ISO effect from the load-dependent effect. Under either condition (control or ISO), fractional release saturated near 0.7.
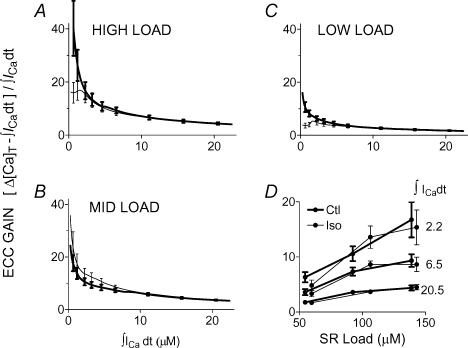
Figure 9 shows ECC gain for high (A), medium (B) and low (C) SR load ranges. As expected for saturating Ca2+ release, gain was highest for the smallest triggers and decreased toward a limiting value as the trigger increased. This limiting gain increased with increasing SR load. For the smallest triggers in each load range, there was more variation in gain ± ISO. The greater scatter at low ICa or influx is intrinsic to the definition of the gain (small denominator). Throughout the modest-to-large trigger range gain predictions were unchanged ± ISO. In order to show more clearly how ECC gain depended on SR Ca2+ load but not on ISO, Fig. 9D shows data from A, B, and C replotted at selected ICa.
Figure 9. ECC gain did not change with ISO.
The predictions of Fig. 7C have been converted to gain and are shown separately for high (A), medium (B) and low (C) SR load ranges. Each release datum was divided by the corresponding influx. At very large triggers, saturation of release left gain at its smallest and least sensitive to modulation, while small and unsystematic effects are seen in the smallest trigger ranges. D, predictions at three selected Ca2+ influxes are replotted to show that gain increased with increasing SR Load.
Rate of Ca2+ release was faster with ISO
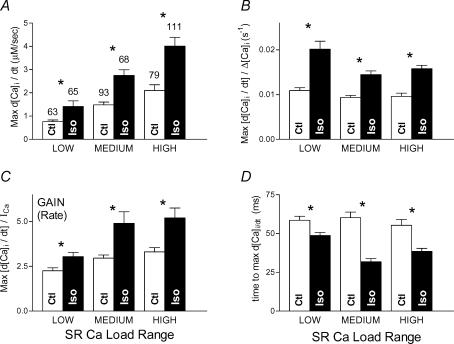
Figure 10A shows maximal rates of rise (in μm s−1, mean ±s.e.m., with n as shown) for twitches whose rising phase was fitted (as in Fig. 6A). With ISO, the maximal rate of rise was ∼50% faster versus control in each SR load group (all P < 0.05). The maximum rate of rise was faster with increasing SR load (control or ISO). We surmised that this was implicit in larger Δ[Ca2+]i transients rising faster. In Fig. 10B, we show that the maximal rate of [Ca2+]i rise normalized to Δ[Ca2+]i was relatively constant versus SR load, yet was still ≥ 50% faster with ISO.
Figure 10. Temporal properties of Ca2+ transients with ISO.
A, maximal rate of rise of [Ca2+]i transients was substantially faster with ISO. Maximal rate of rise was also faster with increased SR loading, but this may be explained by the larger sizes of [Ca2+]i transients, as shown in B (data of A normalized to [Ca2+]i amplitude). C, ‘Rate gain’, i.e. maximal rate of rise normalized to ICa peak influx rate, was also higher with ISO. D, time at which maximal rate of rise (A) occurred was earlier with ISO. All comparisons: *P < 0.05.
We also expected larger ICa to produce faster rising Δ[Ca2+]i transients. In Fig. 10C we plot a ‘rate gain’ measure (d[Ca2+]i/dtmax/(ICa), which also shows that release was faster with ISO. For this figure, to re-express free d[Ca2+]i/dtmax as total, we scaled it up by the approximate cytosolic buffering power for rabbit myocytes (×110; Delbridge et al. 1996). Thus, the rate gains here, like the total calcium-based gains in Fig. 9, are dimensionless and amount to small whole numbers, as expected for Ca2+-induced Ca2+ release. Finally, in Fig. 10D we show that the time from depolarization to maximum release rate was also earlier with ISO. The time-to-peak of ICa (not shown) did not shorten with ISO and so probably does not explain the faster Δ[Ca2+]i.
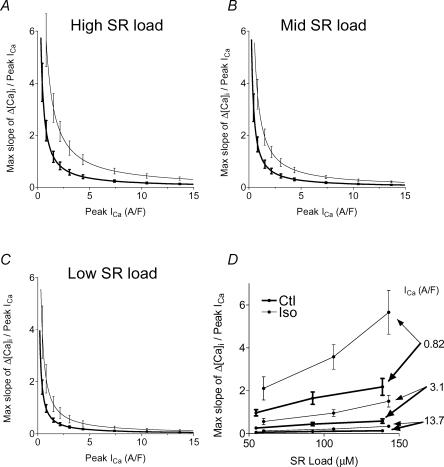
In Fig. 11 appear functions (analogous to the gain functions of Fig. 9) to show how rate gain depended on ICa for the high (A), medium (B) and low (C) SR load ranges. Rate gain increased systematically with ISO at any SR load, and with increasing load regardless of ISO. Figure 11D replots data in A, B, and C at selected ICa, to show that rate gain increased dramatically for small ICa, increased somewhat with increasing SR load, and increased systematically with ISO.
Figure 11. Ca2+ release normalized to influx was faster with ISO.
‘Rate gain’, i.e. maximal rate of rise normalized to ICa peak influx rate, increased with increasing SR load (A, B and C), and decreased with increasing Ca2+ influx, but was systematically higher with ISO. D, predictions at three selected Ca2+ influxes are replotted to show that rate gain increased with increasing SR load and decreased dramatically with increasing trigger.
Rates of ICa and [Ca2+]i decline with ISO
Faster SR Ca2+ release should accelerate ICa inactivation (Bers, 2001). Figure 12A shows that ISO slightly but significantly accelerated the fast component of ICa decay rate, without affecting the slow component or the relative strength of the components. Faster ICa inactivation could contribute to faster shut-off of SR Ca2+ release in ISO, an implicit conclusion in our results (i.e. faster Ca2+ release rate, but with same integral).
Faster SR Ca2+ uptake with ISO could also curtail the peak of the Ca2+ transient, resulting in an underestimation of the total SR Ca2+ release in ISO (Bassani et al. 1994). Indeed [Ca2+]i decay was faster with ISO in rabbit, though much less so in mouse (Figs 2 and 3), even if we studied only similar-sized Δ[Ca2+]i and ICa± ISO to remove intrinsic effects of amplitude on τ (Bers & Berlin, 1995; not shown). In Fig. 8, fractional SR Ca2+ release + ISO for large triggers fell slightly below release without ISO. This might represent a slight snubbing of peak [Ca2+]i by faster SR Ca2+ uptake, particularly when released [Ca2+] was large. To test this we plotted fractional SR Ca2+ release data (all SR loads) separately for rabbit and mouse (Fig. 12B). Indeed, fractional SR Ca2+ release was slightly lower with ISO in rabbit but not in mouse, where SR Ca2+ uptake was not affected (Brittsan et al. 2003) consistent with our conclusion that SR Ca2+ release amplitude is stable ± ISO.
Discussion
Rationale
The inotropic effect of sympathetic stimulation of the heart is mediated mainly by β-AR and PKA activation (Bers, 2001). There are four main PKA targets affecting ECC: ICa, PLB, TnI and RyR. There is extensive and compelling evidence that PKA increases ICa and SR Ca2+-ATPase activity (via PLB phosphorylation), and that these two mechanisms contribute centrally to PKA-induced cardiac inotropy.
The functional role of RyR phosphorylation by PKA is more controversial. It has been difficult to isolate RyR function in the cellular environment where ICa and SR Ca2+ load critically determine RyR behaviour and are both altered by PKA. Indeed PKA effects on ECC consistent with increased, decreased and unchanged RyR activation by Ca2+ have all been reported in myocyte studies (Viatchenko-Karpinski & Györke, 2001; Song et al. 2001; delPrincipe et al. 2001; Li et al. 2002). Even for isolated RyRs in lipid bilayers, results of PKA phosphorylation are mixed (Valdivia et al. 1995; Marx et al. 2000; Jiang et al. 2002).
Summary of outcome
This study addressed the above problem by comparing SR Ca2+ release (± 1 μm ISO) where both ICa and SR Ca2+ load were controlled and measured over a broad range. We found that for any given SR Ca2+ load and ICa, the amount of SR Ca2+ release was not significantly affected by ISO (Figs 3,7 and 9), despite clearly demonstrated ISO effects in the same cells when ICa and load were not controlled (Fig. 2). This was true whether release amplitude was measured using free Ca2+ (Δ[Ca2+]i; Fig. 7B), total calcium (Δ[Ca]T; Fig. 7C and 9), or fractional SR Ca2+ release (Fig. 8), and whether expressed directly (Figs 7B and C) or using ECC gain functions (SR Ca2+ released–integrated ICa; Fig. 9). In contrast, ICa and SR Ca2+ load specifically and strongly affected Ca2+ release and gain, independently of ISO (Figs 4 and 5).
Despite not altering the overall amount of Ca2+ released, ISO did systematically increase the maximal rate of SR Ca2+ release for a given ICa and SR Ca2+ load (Figs 10 and 11). Since release amplitude was constant, some means must also hasten the turn-off of Ca2+ release when ISO is present.
Control of ICa and SR Ca2+ uptake and loading
Increasing either ICa or SR Ca2+ load increases SR Ca2+ release (Fabiato, 1983; Bers, 2001; Figs 4 and 5). The ability of ICa to control SR Ca2+ release (at constant SR Ca2+ load) in graded fashion is at the heart of the CICR mechanism. At the same time, the relationship between SR Ca2+ load and SR Ca2+ release is very steep, so that small changes in SR Ca2+ load can greatly alter SR Ca2+ release. To accomplish the required control of both ICa and SR Ca2+ load (measured almost cotemporally with each set of twitches), several options were available.
We varied ICa by altering Ca2+ channel availability (Fig. 1), rather than test Em or [Ca2+]o. ISO enhances macroscopic ICa mostly by increasing channel open probability. Our use of pre-inactivation with ISO present compensated properly for this by reducing the number of channels available. Indeed, if we had altered test Em or [Ca2+]o, we would have altered single channel ICa and latency (with consequent effects on ECC gain; see below). We believe that single channel ICa would not vary in our protocol.
Despite this, ISO also can promote long (mode 2) L-type Ca2+ channel openings (Yue et al. 1990). For a given macroscopic ICa, if mode 2 openings occur, then fewer channels must be active. If the initial part of an ICa opening is what triggers SR Ca2+ release, Ca2+ admitted later during prolonged openings would be largely wasted, appearing to decrease ECC gain, i.e. there would be less SR Ca2+ release for a given ICa. Indeed, Ca2+ channel agonists such as BayK-8644 (Tsien et al. 1986) or FPL-64176 (Janczewski et al. 2000), which strongly promote mode 2 behaviour, do reduce Ca2+ release and intrinsic ECC gain (McCall & Bers, 1996). We think mode 2 openings are not a complication in our experiments because unlike BayK-8644 or FPL-64176, ISO increases ICa primarily by promoting channel availability, with mode 2 openings being quite rare (Hirano et al. 1999).
Increased SR Ca2+ content enhances RyR-mediated SR Ca2+ release by directly increasing driving force and through allosteric increase of Po (Han et al. 1994; Sitsapesan & Williams, 1994; Györke & Györke, 1998; Bassani et al. 1995b; Shannon et al. 2000; Eisner et al. 2000). Thus controlling for SR Ca2+ load as shown in Fig. 7A is an absolute requirement for measuring the independent effects of PKA on RyR function in intact cells.
Even with load controlled, PLB phosphorylation by PKA could complicate our study by accelerating SR Ca2+ reuptake, which could curtail the peak [Ca2+]i transient (Bassani et al. 1994). This complication was controlled for in the experiments with transgenic mice expressing only non-phosphorylatable PLB. As shown in Figs 3 and 12B, ISO did not affect Ca2+ release in the mouse model. Although a slight loss of fractional SR Ca2+ release with ISO was evident in rabbit versus mouse (Fig. 12B), no rabbit versus mouse differences were evident when the analyses in Figs 7B, C and 9 were repeated separately for rabbit and mouse (not shown).
Fractional SR Ca2+ release and ECC gain
Two complementary numerical indices of cardiac ECC efficacy are in common use: fractional SR Ca2+ release and ECC gain. Both are useful, but neither can completely describe ECC efficacy because they depend on both Ca2+ influx and SR load. In this study, for both SR Ca2+ release and ECC gain (in absolute and in dimensionless units), we have made explicit these functional dependencies. Both Ca2+ release and gain increase with increasing SR Ca2+ load but depend more complexly on ICa (see below).
The fact that our analyses (and choice of experimental conditions) effectively reproduce the known specific dependency of Ca2+ release and ECC gain on trigger and SR load shows that they are robust enough to support our conclusions.
Increasing ECC gain for small ICa
Most previous studies of ECC gain have used test Em to vary ICa (e.g. López-López et al. 1994; Wier et al. 1994; Cannell et al. 1995; Santana et al. 1996). These studies demonstrated that ECC gain increased as ICa amplitude was reduced by increasingly negative test Em. The higher gain at smaller ICa was attributed mainly to the higher single channel ICa expected at more negative Em, due to higher electrochemical driving force. Our observation that ECC gain increased with smaller ICa at constant Em (smaller probability of opening, but constant unitary ICa amplitude; Figs 6 and 9) indicates that this cannot be the entire explanation. Our working hypothesis is that the reduction in ECC gain at higher ICa amplitude is largely due to redundant Ca2+ channel opening at a single SR Ca2+ release site. That is, a single Ca2+ channel opening may be sufficient to activate a whole cluster of RyRs at a single junction, via CICR (Santana et al. 1996). Additional L-type Ca2+ channel openings at the same junction would increase ICa but not increase release. Thus the ECC gain denominator (ICa) would rise for the same numerator. A relatively high fidelity of triggered release (Inoue & Bridge, 2003) is consistent with data suggesting that there are ∼10–20 L-type Ca2+ channels at a single junction associated with ∼100 RyRs (Bers & Stiffel, 1993; Franzini-Armstrong et al. 1999). Thus increasing unitary ICa may be only a minor factor in ECC gain increase at negative Em, and the likelihood of high Ca2+ channel opening probabilities producing redundant Ca2+ influx at more moderate Em needs to be considered.
ECC gain continues to decline monotonically at more positive test Em (> +20 mV) as ICa becomes smaller again. At these positive Em virtually all available Ca2+ channels will be activated, so the redundancy effect to reduce ECC gain would already be maximal. The decrease in unitary ICa as Em approaches the ICa reversal potential may then more critically limit ECC fidelity and gain in that Em region. This is functionally important, because physiological SR Ca2+ release occurs during the early phases of the action potential where Em is +20 to +50 mV.
Another factor which could affect Em dependence of ECC gain is the ICa first latency, which would be most variable at small depolarizations (Rose et al. 1992), reducing fidelity and possibly gain by inducing more variability in kinetics and spatial uniformity of SR Ca2+ release.
Relationship to previous results
Single isolated cardiac RyRs in lipid bilayers have yielded mixed results with PKA phosphorylation. Valdivia et al. (1995) found that RyR Po decreased with PKA activation at resting [Ca2+], while the measured RyR response to rapid jumps in [Ca2+] meant to simulate cellular ICa was an initially high Po that relaxed back to a lower steady-state level, still exceeding that before [Ca2+] was elevated. This pattern is consistent with our cellular results.
Marx et al. (2000) studied only steady-state Po of single RyRs and found that PKA increased open probability, but also revealed reduced unitary conductance substates. Similar subconductance states were observed after depleting FK-506 binding protein (FKBP) from the RyR (Kaftan et al. 1996) and further, PKA could cause FKBP to dissociate from RyR (Marx et al. 2000). Some of these observations were not confirmed by Jiang et al. (2002).
Marx et al. (2000) inferred that PKA phosphorylation would cause a net increase in Ca2+ release, consistent with our observed faster initial release. Increased RyR Po may in time be counterbalanced by reduced conductance, leaving little or no net effect on release. Independently of RyR properties, enhanced ICa inactivation and/or SR Ca2+ uptake could also stabilize ECC gain with ISO in the intact cell (Fig. 12), but SR uptake (as relaxation rate) was unchanged in our mouse data.
Previously we showed that PKA-dependent phosphorylation of the RyR had no effect on any of frequency, kinetic or spatial properties of Ca2+ sparks in intact or permeabilized ventricular myocytes under diastolic conditions, provided that SR Ca2+ load and [Ca2+]i were unaltered (Li et al. 2002). We confirmed that elevating cytosolic [Ca2+] or SR Ca2+ load potently increased Ca2+ spark frequency. This is consistent with our finding of no effect of PKA on amplitude-based measures of Ca2+ release here and the modest resting state depression of RyR Po by PKA described by Valdivia et al. (1995).
In intact ventricular myocytes, ISO increased Ca2+ release during ECC (Hussain & Orchard, 1997), but this could be attributed to increased SR load and ICa. The bell-shaped trigger voltage dependence of Ca2+ release became flat-topped with ISO but reappeared if conditioning was adjusted to reduce SR Ca2+ load or if trigger strength was reduced with nifedipine. This emphasizes the importance of controlling ICa and SR Ca2+ load in assessing the independent effect of RyR phosphorylation on ECC.
Viatchenko-Karpinski & Györke (2001) found that ISO modestly increased SR Ca2+ release and ECC gain (as (ΔF/Fo)/peak (ICa), but they did not make gain comparisons where ICa was the same (nor did they measure Ca2+ release rates). They did find comparable SR Ca2+ loading ± ISO, but this was not measured in the same cells or conditions as ECC gain. PKA activation increased ECC gain only when Na+ was present in pipette and bath, not under Na+-free conditions. Possibly internal Na+ promoted Ca2+ influx via Na+–Ca2+ exchange, not accounted for in ICa, which could lower threshold, increase SR loading, and/or increase spatial spread of triggering and released Ca2+ among release units. Our use of Na+-free pipettes and keeping INa inactivated prevented Ca2+ influx via Na+–Ca2+ exchange.
In a preliminary report delPrincipe et al. (2001) found that PKA activation increased SR Ca2+ release in response to a flash-photolysis-evoked Ca2+ trigger. In this case the Ca2+ trigger may be more alike (± PKA), but it is unlike the spatially focused physiological ICa trigger.
Song et al. (2001) reported that PKA activation decreased ECC gain (based on Ca2+ release rates measured as Ca2+ spikes with millimolar cytosolic Ca2+ buffering). This outcome, under conditions which should emphasize changes in initial release rate, contradicts our finding of faster release. Their reduction in gain was only seen for Em= 0 mV, not at positive Em. In Song et al. (2001), ICa triggers were relatively large and not specifically matched ± PKA activation. Without specific matching, ISO data would fall along a more saturated part (larger ICaversus control data) of a possibly unchanged ECC gain versus trigger function.
Earlier termination of Ca2+ release with ISO
RyR gating is sensitive to intra-SR free [Ca2+] (Sitsapesan & Williams, 1994; Györke & Györke, 1998; Bassani et al. 1995a; Shannon et al. 2000). Moreover, in direct measurements of intra-SR free [Ca2+], Shannon et al. (2003) showed that SR Ca2+ release appears to turn off robustly when SR [Ca2+] drops only partially (e.g. to ∼0.4 mm), regardless of initial SR Ca2+ load. With ISO, the faster initial release would then lead intra-SR free [Ca2+] to fall earlier to the threshold for termination, which could explain the lack of effect of ISO on the total amount released.
Contrasting PKA versus CaMKII effects on SR Ca2+ release and ECC gain
CaMKII can also modify RyR gating in lipid bilayers, but as with PKA phosphorylation the results are mixed, with increases and decreases in Po reported (Witcher et al. 1991; Hain et al. 1995; Lokuta et al. 1995). We previously studied the effect of CaMKII activation on RyR function in intact ventricular myocytes, using a similar approach to that used here (Li et al. 1997). Activation of endogenous CaMKII during conditioning pulses dramatically increased fractional SR Ca2+ release and ECC gain (when both ICa and SR Ca2+ load were well matched before and after). In transgenic mice overexpressing the cytosolic form of cardiac CaMKII we found dramatic activation of Ca2+ spark frequency (despite lower SR Ca2+ load and diastolic [Ca2+]i) which was acutely reversed by inhibition of CaMKII by KN-93 (Maier et al. 2003). Twitch fractional Ca2+ release was also increased in these mice, despite lower SR load (which normally depresses fractional release). These strong CaMKII effects on intact-cell RyR function contrast strikingly with our present study where PKA activation did not appreciably alter these parameters.
The strong CaMKII effect of increasing ECC efficacy shows that changes in RyR function are in principle detectable in intact cells using experimental designs like ours and that of Li et al. (1997). More importantly, our finding that Ca2+ release was faster but unchanged in strength with PKA may point to a general contrast between PKA and CaMKII phenomena (which may have a basis in the ability of CaMKII to phosphorylate sites on RyR not phosphorylated by PKA; Rodriguez et al. 2003). PKA and β-AR activation seem generally to hasten intact cardiac cellular responses (e.g. faster onset and relaxation of contraction, faster Ca2+ removal/uptake, faster pacemaker rate, action potential propagation and repolarization) while CaMKII activation may intensify them.
Conclusion – physiological implications
When ICa and SR Ca2+ load were controlled, we could detect no effect of ISO on amplitude-based measures of ECC efficacy (absolute or fractional SR Ca2+ release or ECC gain) over a broad range of ICa and load values. However, PKA activation increased the maximal rate of [Ca2+]i rise (and ECC gain based on that) by nearly 50%. This outcome, considered along with the contrasting effect of CaMKII activation to increase Ca2+ release strength but not necessarily kinetics, may be part of a general pattern of PKA responses, where fight or flight transient behaviour is crucial (Marks, 2003).
‘Coordinated control’ of ECC has been proposed, where interventions expected to modulate RyR function affected ECC only transiently, due to feedback autoregulation of Ca2+ influx and SR loading (Díaz et al. 2000; Eisner & Trafford, 2000). While coordinated control could stabilize ECC with PKA activation in the intact setting, we have disabled this feedback path by specifically controlling Ca2+ influx and loading.
Acknowledgments
We thank Dr E. G. Kranias for providing the transgenic mice expressing mutant phospholamban. This work was supported by grants from the NIH: HL-30077 and HL-64098.
References
- Bassani JWM, Bassani RA, Bers DM. Relaxation in rabbit and rat cardiac cells: species-dependent differences in cellular mechanisms. J Physiol. 1994;476:279–293. doi: 10.1113/jphysiol.1994.sp020130. [DOI] [PMC free article] [PubMed] [Google Scholar]
- Bassani JWM, Bassani RA, Bers DM. Calibration of indo-1 and resting intracellular [Ca]i in intact rabbit cardiac myocytes. Biophys J. 1995a;68:1453–1460. doi: 10.1016/S0006-3495(95)80318-8. [DOI] [PMC free article] [PubMed] [Google Scholar]
- Bassani JWM, Yuan W-L, Bers DM. Fractional SR Ca release is regulated by trigger Ca and SR Ca content in cardiac myocytes. Am J Physiol. 1995b;268:C1313–C1319. doi: 10.1152/ajpcell.1995.268.5.C1313. [DOI] [PubMed] [Google Scholar]
- Bean BP, Nowycky MC, Tsien RW. β-Adrenergic modulation of calcium channels in frog ventricular heart cells. Nature. 1984;307:371–375. doi: 10.1038/307371a0. [DOI] [PubMed] [Google Scholar]
- Bers DM. Excitation-Contraction Coupling and Cardiac Contractile Force. Dordrecht, The Netherlands: Kluwer; 2001. [Google Scholar]
- Bers DM, Berlin JR. Kinetics of [Ca]i decline in cardiac myocytes depend on peak [Ca]i. Am J Physiol. 1995;268:C271–C277. doi: 10.1152/ajpcell.1995.268.1.C271. [DOI] [PubMed] [Google Scholar]
- Bers DM, Stiffel VM. Ratio of ryanodine to dihydropyridine receptors in cardiac and skeletal muscle and implications for E-C coupling. Am J Physiol. 1993;264:C1587–C1593. doi: 10.1152/ajpcell.1993.264.6.C1587. [DOI] [PubMed] [Google Scholar]
- Brittsan AG, Ginsburg KS, Chu G, Yatani A, Wolska BM, Schmidt AG, Asahi M, MacLennan DH, Bers DM, Kranias EG. Chronic SR Ca2+-ATPase inhibition causes adaptive changes in cellular Ca2+ transport. Circ Res. 2003;92:769–776. doi: 10.1161/01.RES.0000066661.49920.59. [DOI] [PubMed] [Google Scholar]
- Callewaert G, Cleemann L, Morad M. Epinephrine enhances Ca2+ current-regulated Ca2+ release and Ca2+ reuptake in rat ventricular myocytes. Proc Natl Acad Sci U S A. 1988;85:2009–2013. doi: 10.1073/pnas.85.6.2009. [DOI] [PMC free article] [PubMed] [Google Scholar]
- Cannell MB, Cheng H, Lederer WJ. The control of calcium release in heart muscle. Science. 1995;268:1045–1049. doi: 10.1126/science.7754384. [DOI] [PubMed] [Google Scholar]
- Cheng H, Lederer WJ, Cannell MB. Calcium sparks: elementary events underlying excitation-contraction coupling in heart muscle. Science. 1993;262:740–744. doi: 10.1126/science.8235594. [DOI] [PubMed] [Google Scholar]
- Delbridge LM, Bassani JWM, Bers DM. Steady-state twitch Ca2+ fluxes and cytosolic Ca2+ buffering in rabbit ventricular myocytes. Am J Physiol. 1996;270:C192–C199. doi: 10.1152/ajpcell.1996.270.1.C192. [DOI] [PubMed] [Google Scholar]
- delPrincipe F, Egger M, Pignier C, Niggli E. Enhanced E-C coupling efficiency after Beta-stimulation of cardiac myocytes. Biophys J. 2001;80:64a. [Google Scholar]
- Díaz ME, Trafford AW, O'Neill SC, Eisner DA. Can changes of ryanodine receptor expression affect cardiac contractility? Cardiovasc Res. 2000;45:1068–1071. doi: 10.1016/s0008-6363(99)00412-5. [DOI] [PubMed] [Google Scholar]
- Eisner DA, Choi HS, Diaz ME, O'Neill SC, Trafford AW. Integrative analysis of calcium cycling in cardiac muscle. Circ Res. 2000;87:1087–1094. doi: 10.1161/01.res.87.12.1087. [DOI] [PubMed] [Google Scholar]
- Eisner DA, Trafford AW. No role for the ryanodine receptor in regulating cardiac contraction? News Physiol Sci. 2000;15:275–279. doi: 10.1152/physiologyonline.2000.15.5.275. [DOI] [PubMed] [Google Scholar]
- Elliott TR. The action of adrenalin. J Physiol. 1905;32:401–467. doi: 10.1113/jphysiol.1905.sp001093. [DOI] [PMC free article] [PubMed] [Google Scholar]
- Fabiato A. Calcium-induced release of calcium from the cardiac sarcoplasmic reticulum. Am J Physiol. 1983;245:C1–C14. doi: 10.1152/ajpcell.1983.245.1.C1. [DOI] [PubMed] [Google Scholar]
- Franzini-Armstrong C, Protasi F, Ramesh V. Shape size, and distribution of Ca2+ release units and couplons in skeletal and cardiac muscles. Biophys J. 1999;77:1528–1539. doi: 10.1016/S0006-3495(99)77000-1. [DOI] [PMC free article] [PubMed] [Google Scholar]
- Ginsburg KS, Weber CR, Bers DM. Control of maximum sarcoplasmic reticulum Ca load in intact ferret ventricular myocytes. Effects of thapsigargin and isoproterenol. J General Physiol. 1998;111:491–504. doi: 10.1085/jgp.111.4.491. [DOI] [PMC free article] [PubMed] [Google Scholar]
- Grynkiewicz G, Poenie M, Tsien RY. A new generation of Ca indicators with greatly improved fluorescence properties. J Biol Chem. 1985;260:3440–3450. [PubMed] [Google Scholar]
- Györke I, Györke S. Regulation of the cardiac ryanodine receptor channel by luminal Ca2+ involves luminal Ca2+ sensing sites. Biophys J. 1998;75:2801–2810. doi: 10.1016/S0006-3495(98)77723-9. [DOI] [PMC free article] [PubMed] [Google Scholar]
- Hain J, Onoue H, Mayrleitner M, Fleischer S, Schindler H. Phosphorylation modulates the function of the calcium release channel of sarcoplasmic reticulum from cardiac muscle. J Biol Chem. 1995;270:2074–2081. doi: 10.1074/jbc.270.5.2074. [DOI] [PubMed] [Google Scholar]
- Han S, Schiefer A, Isenberg G. Ca2+ load of guinea-pig ventricular myocytes determines efficacy of brief Ca2+ currents as trigger for Ca2+ release. J Physiol. 1994;480:411–421. doi: 10.1113/jphysiol.1994.sp020371. [DOI] [PMC free article] [PubMed] [Google Scholar]
- Hirano Y, Yoshinaga T, Murata M, Hiraoka M. Prepulse-induced mode 2 gating behavior with and without beta-adrenergic stimulation in cardiac L-type Ca channels. Am J Physiol. 1999;276:C1338–C1345. doi: 10.1152/ajpcell.1999.276.6.C1338. [DOI] [PubMed] [Google Scholar]
- Hove-Madsen L, Bers DM. Passive Ca buffering and SR Ca uptake in permeabilized rabbit ventricular myocytes. Am J Physiol. 1993;264:C677–C686. doi: 10.1152/ajpcell.1993.264.3.C677. [DOI] [PubMed] [Google Scholar]
- Hussain M, Orchard CH. Sarcoplasmic reticulum Ca2+ content, L-type Ca2+ current, and the Ca2+ transient in rat myocytes during β-adrenergic stimulation. J Physiol. 1997;505:385–402. doi: 10.1111/j.1469-7793.1997.385bb.x. [DOI] [PMC free article] [PubMed] [Google Scholar]
- Inoue M, Bridge JH. Ca2+ sparks in rabbit ventricular myocytes evoked by action potentials: involvement of clusters of L-type Ca2+ channels. Circ Res. 2003;92:532–538. doi: 10.1161/01.RES.0000064175.70693.EC. [DOI] [PubMed] [Google Scholar]
- Janczewski AM, Lakatta EG, Stern MD. Voltage-independent changes in L-type Ca2+ current uncoupled from SR Ca2+ release in cardiac myocytes. Am J Physiol. 2000;279:H2024–H2031. doi: 10.1152/ajpheart.2000.279.4.H2024. [DOI] [PubMed] [Google Scholar]
- Jiang MT, Lokuta AJ, Farrell EF, Wolff MR, Haworth RA, Valdivia HH. Abnormal Ca2+ release, but normal ryanodine receptors, in canine and human heart failure. Circ Res. 2002;91:1015–1022. doi: 10.1161/01.res.0000043663.08689.05. [DOI] [PubMed] [Google Scholar]
- Kaftan E, Marks AR, Ehrlich BE. Effects of rapamycin on ryanodine receptor Ca2+-release channels from cardiac muscle. Circ Res. 1996;78:990–997. doi: 10.1161/01.res.78.6.990. [DOI] [PubMed] [Google Scholar]
- Li Y, Kranias EG, Mignery GA, Bers DM. Protein kinase A phosphorylation of the ryanodine receptor does not affect calcium sparks in mouse ventricular myocytes. Circ Res. 2002;90:309–316. doi: 10.1161/hh0302.105660. [DOI] [PubMed] [Google Scholar]
- Li L, Satoh H, Ginsburg KS, Bers DM. The effects of CaMKII on cardiac excitation-contraction coupling in ferret ventricular myocytes. J Physiol. 1997;501:17–32. doi: 10.1111/j.1469-7793.1997.017bo.x. [DOI] [PMC free article] [PubMed] [Google Scholar]
- Lindemann JP, Jones LR, Hathaway DR, Henry BG, Watanabe AM. β-Adrenergic stimulation of phospholamban phosphorylation and Ca2+-ATPase activity in guinea pig ventricles. J Biol Chem. 1983;258:464–471. [PubMed] [Google Scholar]
- Litwin SE, Li J, Bridge JH. Na-Ca exchange and the trigger for sarcoplasmic reticulum Ca release: studies in adult rabbit ventricular myocytes. Biophys J. 1998;75:359–371. doi: 10.1016/S0006-3495(98)77520-4. [DOI] [PMC free article] [PubMed] [Google Scholar]
- Lokuta AJ, Rogers TB, Lederer WJ, Valdivia HH. Modulation of cardiac ryanodine receptors of swine and rabbit by a phosphorylation-dephosphorylation mechanism. J Physiol. 1995;487:609–622. doi: 10.1113/jphysiol.1995.sp020904. [DOI] [PMC free article] [PubMed] [Google Scholar]
- López-López JR, Shacklock PS, Balke CW, Wier WG. Local stochastic release of Ca2+ in voltage-clamped rat heart cells: Visualization with confocal microscopy. J Physiol. 1994;480:21–29. doi: 10.1113/jphysiol.1994.sp020337. [DOI] [PMC free article] [PubMed] [Google Scholar]
- Luo W, Grupp IL, Harrer J, Ponniah S, Grupp G, Duffy JJ, Doetschman T, Kranias EG. Targeted ablation of the phospholamban gene is associated with markedly enhanced myocardial contractility and loss of beta-agonist stimulation. Circ Res. 1994;75:401–409. doi: 10.1161/01.res.75.3.401. [DOI] [PubMed] [Google Scholar]
- McCall E, Bers DM. BAY K 8644 depresses excitation-contraction coupling in cardiac muscle. Am J Physiol. 1996;270:C878–C884. doi: 10.1152/ajpcell.1996.270.3.C878. [DOI] [PubMed] [Google Scholar]
- Maier LS, Zhang T, Chen L, DeSantiago J, Brown JH, Bers DM. Transgenic CaMKIIdeltaC overexpression uniquely alters cardiac myocyte Ca2+ handling: reduced SR Ca2+ load and activated SR Ca2+ release. Circ Res. 2003;92:904–911. doi: 10.1161/01.RES.0000069685.20258.F1. [DOI] [PubMed] [Google Scholar]
- Marks AR. A guide for the perplexed. Towards an understanding of the molecular basis of heart failure (Editorial) Circulation. 2003;107:1456–1459. doi: 10.1161/01.cir.0000059745.95643.83. [DOI] [PubMed] [Google Scholar]
- Marx SO, Gaburjakova J, Gaburjakova M, Henrikson C, Ondrias K, Marks AR. Coupled gating between cardiac calcium release channels (ryanodine receptors) Circ Res. 2001;88:1151–1158. doi: 10.1161/hh1101.091268. [DOI] [PubMed] [Google Scholar]
- Marx SO, Reiken S, Hisamatsu Y, Jayaraman T, Burkhof D, Rosemblit N, Marks AR. PKA phosphorylation dissociates FKBP12.6 from the calcium release channel (ryanodine receptor): defective regulation in failing hearts. Cell. 2000;101:365–376. doi: 10.1016/s0092-8674(00)80847-8. [DOI] [PubMed] [Google Scholar]
- Prestle J, Janssen PM, Janssen AP, Zeitz O, Lehnart SE, Bruce L, Smith GL, Hasenfuss G. Overexpression of FK506-binding protein FKBP12.6 in cardiomyocytes reduces ryanodine receptor-mediated Ca2+ leak from the sarcoplasmic reticulum and increases contractility. Circ Res. 2001;88:188–194. doi: 10.1161/01.res.88.2.188. [DOI] [PubMed] [Google Scholar]
- Rodriguez P, Bhogal MS, Colyer J. Stoichiometric phosphorylation of cardiac ryanodine receptor on serine-2809 by calmodulin-dependent kinase II and protein kinase A. J Biol Chem. 2003;278:38593–38600. doi: 10.1074/jbc.C301180200. [DOI] [PubMed] [Google Scholar]
- Rose WC, Balke CW, Wier WG, Marban E. Macroscopic and unitary properties of physiological ion flux through L-type Ca2+ channels in guinea-pig heart cells. J Physiol. 1992;456:267–284. doi: 10.1113/jphysiol.1992.sp019336. [DOI] [PMC free article] [PubMed] [Google Scholar]
- Santana LF, Cheng H, Gomez AM, Cannell MB, Lederer WJ. Relation between the sarcolemmal Ca2+ current and Ca2+ sparks and local control theories for cardiac excitation-contraction coupling. Circ Res. 1996;78:166–171. doi: 10.1161/01.res.78.1.166. [DOI] [PubMed] [Google Scholar]
- Sham JS. Reverse Na+-Ca2+ exchange triggers Ca2+ release through regurgitation of sarcoplasmic reticulum. Biophys J. 2000;78:374A. [Google Scholar]
- Shannon TR, Ginsburg KS, Bers DM. Potentiation of fractional sarcoplasmic reticulum calcium release by total and free intra-sarcoplasmic reticulum calcium concentration. Biophys J. 2000;78:334–343. doi: 10.1016/S0006-3495(00)76596-9. [DOI] [PMC free article] [PubMed] [Google Scholar]
- Shannon TR, Guo T, Bers DM. Ca scraps: local depletions of free [Ca] in cardiac sarcoplasmic reticulum during contractions leave substantial Ca reserve. Circ Res. 2003;93:40–45. doi: 10.1161/01.RES.0000079967.11815.19. [DOI] [PubMed] [Google Scholar]
- Sitsapesan R, Williams AJ. Regulation of the gating of the sheep cardiac sarcoplasmic reticulum Ca2+-release channel by luminal Ca2+ J Membr Biol. 1994;137:215–226. doi: 10.1007/BF00232590. [DOI] [PubMed] [Google Scholar]
- Song L-S, Wang S-Q, Xiao R-P, Spurgeon H, Lakatta EG, Cheng H. β-Adrenergic stimulation synchronizes intracellular Ca2+ release during excitation-contraction coupling in cardiac myocytes. Circ Res. 2001;88:794–801. doi: 10.1161/hh0801.090461. [DOI] [PubMed] [Google Scholar]
- Trafford AW, Díaz ME, Negretti N, Eisner DA. Enhanced calcium current and decreased calcium efflux restore sarcoplasmic reticulum Ca content following depletion. Circ Res. 1997;81:477–484. doi: 10.1161/01.res.81.4.477. [DOI] [PubMed] [Google Scholar]
- Tsien RW, Bean BP, Hess P, Lansman JB, Nilius B, Nowycky MC. Mechanisms of calcium channel modulation by beta-adrenergic agents and dihydropyridine calcium agonists. J Mol Cell Cardiol. 1986;18:691–710. doi: 10.1016/s0022-2828(86)80941-5. [DOI] [PubMed] [Google Scholar]
- Valdivia HH, Kaplan JH, Ellis-Davies GC, Lederer WJ. Rapid adaptation of cardiac ryanodine receptors: modulation by Mg2+ and phosphorylation. Science. 1995;5206:1997–2000. doi: 10.1126/science.7701323. [DOI] [PMC free article] [PubMed] [Google Scholar]
- Varro A, Negretti N, Eisner DA. An estimate of the calcium content of the sarcoplasmic reticulum in rat ventricular myocytes. Pflugers Arch. 1993;423:158–160. doi: 10.1007/BF00374975. [DOI] [PubMed] [Google Scholar]
- Viatchenko-Karpinski S, Györke S. Modulation of the Ca2+-induced Ca2+ release cascade by beta-adrenergic stimulation in rat ventricular myocytes. J Physiol. 2001;533:837–848. doi: 10.1111/j.1469-7793.2001.t01-1-00837.x. [DOI] [PMC free article] [PubMed] [Google Scholar]
- Wier WG, Egan TM, López-López JR, Balke CW. Local control of excitation-contraction coupling in rat heart cells. J Physiol. 1994;474:463–471. doi: 10.1113/jphysiol.1994.sp020037. [DOI] [PMC free article] [PubMed] [Google Scholar]
- Witcher DR, Kovacs RJ, Schulman H, Cefali DC, Jones LR. Unique phosphorylation site on the cardiac ryanodine receptor regulates calcium channel activity. J Biol Chem. 1991;266:11144–11152. [PubMed] [Google Scholar]
- Yoshida A, Takahashi M, Imagawa T, Shigekawa M, Takisawa H, Nakamura T. Phosphorylation of ryanodine receptors in rat myocytes during beta-adrenergic stimulation. J Biochem (Tokyo) 1992;111:186–190. doi: 10.1093/oxfordjournals.jbchem.a123735. [DOI] [PubMed] [Google Scholar]
- Yuan W-L, Ginsburg KS, Bers DM. Comparison of sarcolemmal calcium channel current in rabbit and rat ventricular myocytes. J Physiol. 1996;493:733–746. doi: 10.1113/jphysiol.1996.sp021418. [DOI] [PMC free article] [PubMed] [Google Scholar]
- Yue DT, Herzig S, Marban E. Beta-adrenergic stimulation of calcium channels occurs by potentiation of high-activity gating modes. Proc Natl Acad Sci U S A. 1990;87:753–757. doi: 10.1073/pnas.87.2.753. [DOI] [PMC free article] [PubMed] [Google Scholar]
- Zhang R, Zhao J, Mandveno A, Potter JD. Cardiac troponin I phosphorylation increases the rate of cardiac muscle relaxation. Circ Res. 1995;76:1028–1035. doi: 10.1161/01.res.76.6.1028. [DOI] [PubMed] [Google Scholar]


