Abstract
The human ether-á-go-go related gene (HERG) encodes the pore forming α-subunit of the rapid delayed rectifier K+ channel which is central to the repolarization phase of the cardiac action potential. HERG K+ channels have unusual kinetics characterized by slow activation and deactivation, yet rapid inactivation. The fourth transmembrane domain (S4) of HERG, like other voltage-gated K+ channels, contains multiple positive charges and is the voltage sensor for activation. In this study, we mutated each of the positively charged residues in this region to glutamine (Q), expressed the mutant and wild-type (WT) channels in Xenopus laevis oocytes and studied them using two-electrode voltage clamp methods. K525Q channels activated at more hyperpolarized potentials than WT, whereas all the other mutant channels activated at more depolarized potentials. All mutants except for R531Q also had a reduction in apparent gating charge associated with activation. Mutation of K525 to cysteine (C) resulted in a less dramatic phenotype than K525Q. The addition of the positively charged MTSET to K525C altered the phenotype to one more similar to K525Q than to WT. Therefore it is not charge per se, but the specific lysine side chain at position 525, that is crucial for stabilizing the closed state. When rates of activation and deactivation for WT and mutant channels were compared at equivalent total (chemical + electrostatic) driving forces, K525Q and R528Q accelerated activation but had no effect on deactivation, R531Q slowed activation and deactivation, R534Q accelerated activation but slowed deactivation and R537Q accelerated deactivation but had no effect on activation. The main conclusions we can draw from these data are that in WT channels K525 stabilizes the closed state, R531 stabilizes the open state and R534 participates in interactions that stabilize pre-open closed states.
The human ether-á-go-go related gene (HERG), encodes the pore-forming α-subunit of the rapid delayed rectifier K+ channel (Sanguinetti et al. 1995), which is an important contributor to the repolarization phase of the cardiac action potential (Spector et al. 1996; Tseng, 2001). Furthermore, mutations in HERG cause chromosome 7-associated congenital long QT syndrome (Curran et al. 1995), and blockade of HERG K+ channels by a wide range of prescription medications causes drug-induced long QT syndrome, the most common cause of drug-induced cardiac arrhythmia and sudden death (Vandenberg et al. 2001). Therefore, there is considerable interest in better understanding the structure–function relationship of HERG K+ channels.
HERG is a member of the family of voltage-gated K+ channels (VGKs) (Warmke & Ganetzky, 1994; Trudeau et al. 1995), in which gating is driven by changes in the membrane potential. The functional channel is composed of four identical subunits, each containing six transmembrane domains (denoted S1–S6). As is typical for VGKs, the S4 domain of HERG contains multiple positively charged residues (see Fig. 1). The kinetic behaviour of HERG, however, is very atypical, being characterized by slow activation and deactivation kinetics (with time constants ranging from hundreds of milliseconds to seconds) but very rapid and voltage-dependent inactivation kinetics (time constants range from milliseconds to tens of milliseconds) (Wang et al. 1997; Zhou et al. 1998; Vandenberg et al. 2004). Consequently, during the plateau phase of the cardiac action potential, HERG passes little outward current but during repolarization the channels rapidly recover from inactivation and pass a significantly larger outward current (Zhou et al. 1998; Hancox et al. 1998; Lu et al. 2001). These unusual kinetics allow HERG to play a critical role in normal cardiac repolarization (Spector et al. 1996; Viswanathan et al. 1999) as well as in protection against arrhythmias initiated by ectopic beats (Lu et al. 2001; Vandenberg et al. 2001).
Figure 1. Sequence alignment of HERG with Shaker and KvAP.
The voltage sensor paddle regions of HERG (residues 501–542), Shaker (residues 316–382) and KvAP (residues 93–137) were aligned with ClustalW (Thompson et al. 1994). Identical residues are highlighted in black (white text) and conserved residues highlighted in grey. The stippled boxes below the alignment indicate the S3b and S4 helices as defined in the KvAP crystal structure (Jiang et al. 2003). Asterisks denote residues that were mutated to glutamine in this study.
It is widely accepted that the S4 domain is the principal voltage sensor in VGKs (Papazian et al. 1991; Bezanilla, 2002), but that at least in some cases the S1–S3 domains may also play a contributory role (Papazian et al. 1995; Seoh et al. 1996). The voltage dependence of activation of VGKs has been most extensively studied in Shaker K+ channels (Bezanilla, 2000; Fedida & Hesketh, 2001). In Shaker, the first four positively charged residues in the S4 segment (R362, R365, R368 and R371) are responsible for the majority of the gating current associated with channel activation (Aggarwal & MacKinnon, 1996; Fedida & Hesketh, 2001). The corresponding region in HERG is G522–R534 (see Fig. 1). To date, however, there have been very few studies looking at the role that charged residues in S4 may play in the slow activation and deactivation kinetics of HERG (Nakajima et al. 1999). In this study we have mutated each of the charged residues in the S4 of HERG (K525, R528, R531, R534 and R537) in turn, to glutamine (Q), a polar but uncharged residue, and characterized the effects of each mutation on steady-state activation and kinetics of activation and deactivation. We also mutated K525 to cysteine (C) and investigated the effect of addition of the positively charged [2-(trimethylammonium)ethyl]methanethiosulphonate bromide (MTSET) (Karlin & Akabas, 1998) on the phenotype of K525C channels.
Methods
Molecular biology
HERG cDNA (a gift from Gail Robertson, University of Wisconsin) was subcloned into a pBluescript vector containing the 5′ untranslated region (UTR) and 3′ UTR of the Xenopus laevisβ-globin gene (a gift from Robert Vandenberg, University of Sydney). Mutagenesis was carried out on a BstEII/SphI fragment (bp 1119–2310) using the megaprimer method as previously described (Lu et al. 2003). Mutation constructs were confirmed by bi-directional sequencing. cRNA was synthesized, after linearizing the plasmid with BamH I, using the mMessage mMachine kit (Ambion) according to the manufacturer's protocols. Mutant channels are referred to using the single letter code for WT residue, the residue number and then the single letter code of the mutation. For example, mutation of lysine 525 to a glutamine is referred to as K525Q.
Oocyte preparation
Xenopus laevis oocytes were prepared as previously described (Mitrovic & et al. 1998). Briefly, female Xenopus laevis frogs were anaesthetized in 0.17% w/v tricaine and segments of the ovarian lobes were removed through a small abdominal incision. The incision was sutured closed and the frogs allowed to recover for approximately 4 weeks before a second batch of oocytes was harvested. Frogs were killed by pithing after anaesthetization with tricaine. The follicular layer was removed by digestion for 2–3 h with 2 mg ml−1 collagenase A (Boehringer Mannheim USA) in OR-2 buffer (containing, mm: 82.5 NaCl, 2.0 KCl, 1.0 MgCl and 5 Hepes, adjusted to pH 7.5 with NaOH, then rinsed with ND96 (containing, mm: 2.0 KCl, 96.0 NaCl, 1.8 CaCl2, 1.0 MgCl2, 5.0 Hepes, pH adjusted to 7.5 with NaOH). Stage V and VI oocytes were isolated, stored in tissue culture dishes containing ND96, 2.5 mm pyruvic acid sodium salt and 0.5 mm theophylline supplemented with 10 µg ml−1 gentamicin, adjusted to pH 7.5 with NaOH and incubated at 18°C. All experiments were approved by the Animal Ethics Committee of the University of Sydney.
Electrophysiology
Oocytes were injected with 5–10 ng cRNA and incubated at 18°C for 24–72 h prior to electrophysiological recordings. All experiments were undertaken at room temperature (21–22°C). Two-electrode voltage clamp experiments were performed using a Warner 725C oocyte clamp amplifier (Warner Instruments, Hamden, CT, USA) or a Geneclamp 500B amplifier (Axon Instruments, Union City, CA, USA). Glass microelectrodes had tip resistances of 0.3–1.0 MΩ when filled with 3 m KCl and oocytes were perfused with ND96 solution. Data acquisition and analysis were performed using pCLAMP (v. 9.0, Axon Instruments) and Microsoft Excel software. Batches of cells in which endogenous current was more than 200 nA at +40 mV were not used. In all experiments a step depolarization of +20 mV or −20 mV was included at the start of each sweep to enable leak correction off line. We assumed that the leak was linear in the range −150 to +50 mV.
Steady-state activation
The voltage dependence of current activation was assessed using standard tail current analysis (Sanguinetti et al. 1995). Cells were depolarized to potentials in the range −110 mV to +90 mV (depending on the mutant being studied) and tail currents recorded at −70 mV or at −150 mV if there was appreciable channel activation at potentials below −70 mV. For mutants with slow activation kinetics there will be a depolarized shift in the voltage dependence of steady-state activation if the depolarization steps are not of adequate length (Viloria et al. 2000). Therefore, we used 8 s depolarization steps to minimize this effect. Tail current data were normalized to the maximum current value (Imax) and fitted with a Boltzmann function:
| (1) |
where I/Imax is the relative tail current, V0.5 is the half-activation voltage, Vt is the test potential, and k is the slope factor.
The steady-state activation data were also fitted with a Boltzmann function of the form:
| (2) |
where ΔG0 is the work done at 0 mV; zg is the effective number of gating charges moving across the membrane electric field, E; F is Faraday's constant; R is the universal gas constant; and T is absolute temperature. Equations (1) and (2) are equivalent; however, from eqn (2) one can calculate the effect of each mutation on changes in the chemical potential (ΔG0) and electrostatic potential (−zgEF) that drives activation.
Rates of activation
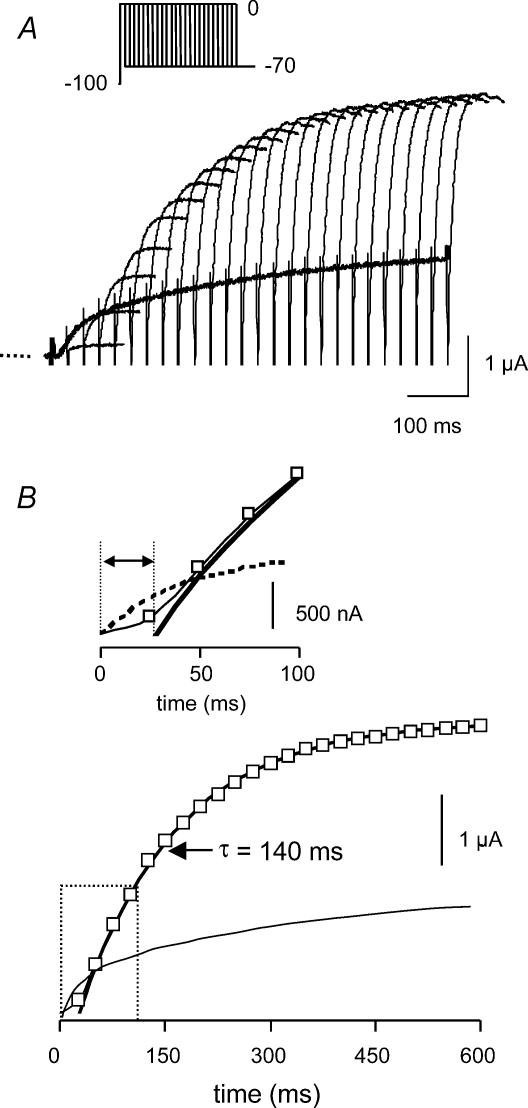
It is not possible to measure rates of activation directly from depolarizing steps for HERG K+ channels due to overlapping inactivation (Liu et al. 1996). We therefore used an envelope of tails protocol as previously described (Liu et al. 1996; Lu et al. 2001). Rates of activation were measured at 0 mV (i.e. in the absence of an electrostatic driving force) and then at potentials in the range +40 to +160 mV (depending on the mutant studied). HERG K+ channels, like Shaker K+ channels, undergo transitions through multiple pre-open closed states before finally opening (Wang et al. 1997). This can be seen from the sigmoidal shape of activation time courses (Trudeau et al. 1995; Wang et al. 1997; Gomez-Varela et al. 2002; also see Fig. 4). Therefore to obtain the rate constant of activation we fitted an equation of the form:
Figure 4. Rate of activation at 0 mV for WT HERG.
A, typical example of currents recorded using an envelope of tails protocol (inset) to measure the rates of activation at 0 mV for WT HERG channels. B, peak tail currents plotted against the duration of the preceding depolarization to 0 mV. The dotted line shows the current recorded during a simple depolarization to 0 mV which clearly has a different shape, due to the overlap of activation and inactivation. The time constant for the single exponential fitted to the latter half of the activation time course in this example was 140 ms. The inset shows an expanded view of the first 100 ms of the plot (dashed box). The amplified plot highlights the sigmoidal activation time course.
| (3) |
where δ is the latency and τ is the time constant of the activation time course.
Rates of deactivation
Deactivation of HERG is voltage dependent and has been reported to show either a single exponential (Wang et al. 1996; Kiehn et al. 1996; Wang et al. 1997; Jo et al. 1999; Johnson et al. 1999) or a bi-exponential time course (Zhou et al. 1998; Wang et al. 2000; Lu et al. 2001). We found that for WT HERG deactivation at −120 mV could be well fitted by a single exponential time course. However, at −80 mV fitting a bi-exponential time course resulted in a significantly smaller sum of squares of the residuals compared to a fit of a single exponential time course (see Supplementary material). Furthermore, for some of the mutants a bi-exponential time course was clearly needed to fit the data (see Supplementary material and Fig. 8C). For consistency, we have therefore used a bi-exponential function to fit the deactivation curves for all mutants as well as WT channels. Rates of deactivation were measured from tail currents recorded at voltages in the range 0 to −190 mV (depending on mutant studied) after a step to +40 mV (or +80 mV for the R531Q mutant) for 500 ms to activate the channels. The data were fitted with a bi-exponential function of the form:
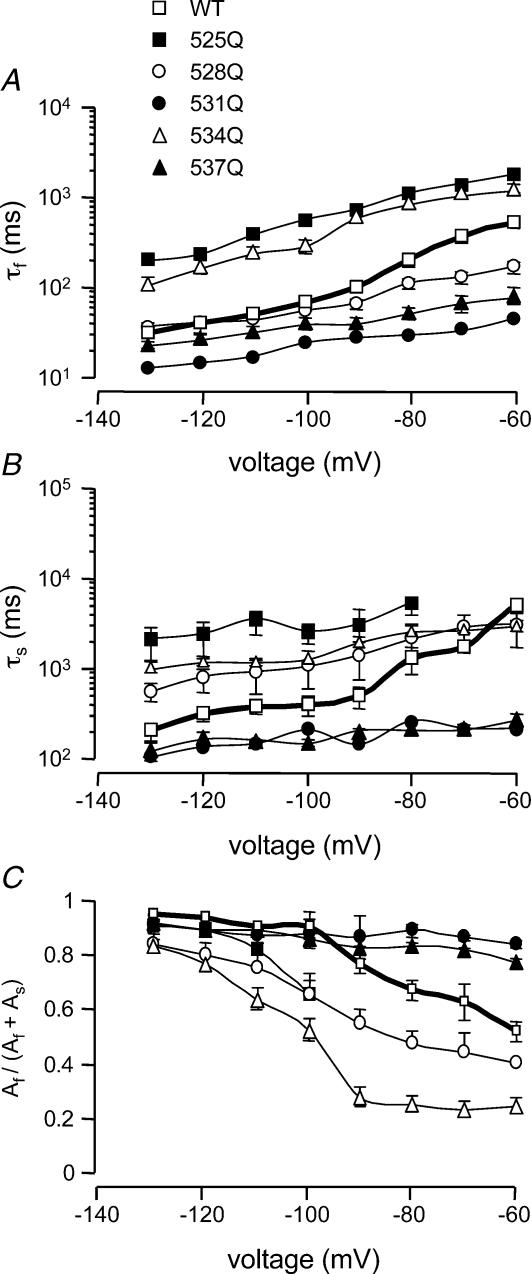
Figure 8. Summary of rates of deactivation.
The mean ± s.e.m. for τf (A), τs (B) and ratio Af/(Af+As) (C) for WT and all mutant channels. K525Q and R534Q mutants had significantly slower time constants (τf and τs) of deactivation (n = 6) than WT (P < 0.05, ANOVA, followed by Dunnett's method), whereas the R531Q and R537Q mutants had significantly faster time constants (τf and τs) of deactivation than WT (P < 0.05, ANOVA, followed by Dunnett's method). R528Q channels had a faster τf but a slower τs. The fast component of deactivation accounts for over 80% of deactivation for WT as well as all other mutant HERG channels at −130 mV. However, at more depolarized potentials (−80 to −60 mV) the fast component accounts for 50–70% of deactivation for WT compared to 80–90% for R528Q and R537Q, but only 20–30% for R534Q and R531Q.
| (4) |
where τf is the time constant of fast component, τs is the time constant of slow component, Af and As are the relative amplitudes of the fast and slow components, and C is a constant. All curve fitting was done in non-transformed data using the automated least squares fitting algorithm incorporated into the Clampfit 9 software (Axon Instruments).
Cysteine modifications
MTSET was prepared as a 100 mm stock solution in water, aliquoted in 200 µl lots and rapidly frozen. Individual aliquots were thawed and diluted in 20 ml ND96 (to give a final MTSET concentration of 1 mm) and used immediately to minimize breakdown of the reagents. MTSET was applied through a separate perfusion line and a new aliquot of MTSET was used for each oocyte.
All data are presented as the mean ± s.e.m. (n). Statistical comparisons (performed using ANOVA followed by Dunnett's method, except when we compared the addition of MTSET to K525C channels where we used Student's paired t test) were carried out using Microsoft Excel. A P value of < 0.05 was considered significant.
Results
Steady-state activation
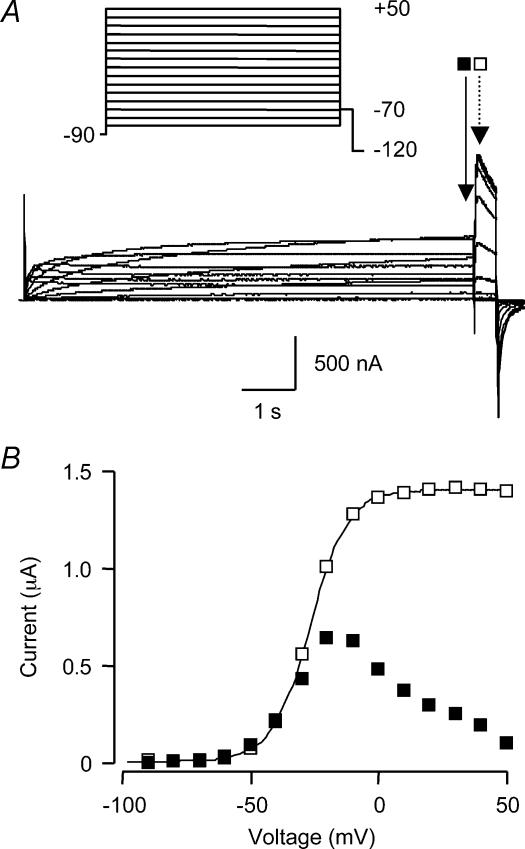
A typical example of a family of currents recorded from WT channels during a steady-state activation voltage protocol is shown in Fig. 2A. The unusual gating characteristics of HERG can be appreciated from the current–voltage (I–V) relationship for the current recorded at the end of the depolarization pulses (filled symbols, Fig. 2B). At more depolarized potentials there is a reduction in outward current due to inactivation of the channels, creating a dome-shaped I–V curve. Also shown in Fig. 2B is the I–V relationship for the peak tail currents plotted against the voltage of the preceding depolarization step (open symbols, Fig. 2B). The Boltzmann function (see Methods) fitted to the tail current I–V data had a V0.5 of activation of −28 mV, and the mean value for V0.5 for WT channels was −34.7 ± 1.6 mV (n = 8, see Table 1).
Figure 2. Steady-state activation of WT HERG.
A, typical example of currents recorded from WT HERG channels during an 8 s steady-state activation voltage protocol (see inset). Arrows indicate points at which current was measured for the depolarization step (continuous line) and for the tail currents (dashed line). B, the current–voltage (I–V) relationships for the current recorded at the end of the depolarization steps (filled symbols) and tail currents (open symbols) plotted against the voltage of the preceding voltage step. The reduction in outward current at positive potentials seen during the depolarization step results from inactivation of the channels. The curve fitted to the tail current data is a Boltzmann function (see Methods) with a V0.5 of activation of −28 mV.
Table 1.
Steady-state activation
| Cell type (n) | V0.5 (mV) | Slope (mV) | zg (e−) | ΔG0 (kJ mol−1) |
|---|---|---|---|---|
| WT (8) | −34.7 ± 1.6 | 6.8 ± 0.5 | 3.8 ± 0.2 | −13.2 ± 1.3 |
| K525Q (9) | −84.9 ± 1.4* | 11.9 ± 0.6* | 2.2 ± 0.1* | −17.8 ± 1.0* |
| R528Q (6) | −7.0 ± 2.4* | 9.0 ± 0.3* | 2.8 ± 0.1* | −1.9 ± 0.6* |
| R531Q (9) | 27.6 ± 1.5* | 6.5 ± 0.6 | 4.3 ± 0.5 | 11.7 ± 1.6* |
| R534Q (9) | −26.8 ± 2.8* | 8.6 ± 1.0* | 3.0 ± 0.2* | −4.3 ± 1.5* |
| R537Q (8) | −10.3 ± 0.4* | 9.8 ± 0.5* | 2.9 ± 0.3* | −3.6 ± 1.4* |
| K525C (6) | −54.4 ± 0.7* | 9.4 ± 0.5* | 2.8 ± 0.2* | −15.3 ± 1.6 |
| K525C + MTSET (6) | −66.2 ± 2.0*† | 8.7 ± 0.4* | 2.9 ± 0.2* | −18.7 ± 1.4*† |
The data are means ± s.e.m.
P < 0.05 compared to WT (ANOVA, followed by Dunnett's method).
P < 0.05 compared to K525C (paired t test).
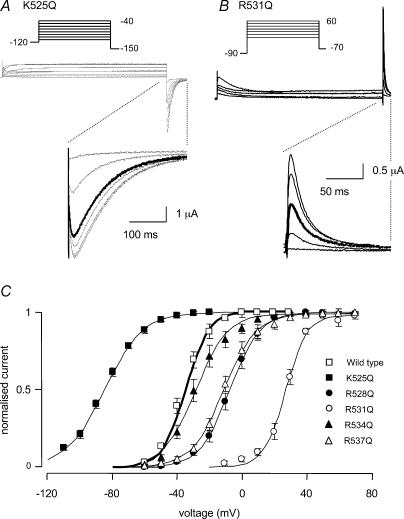
All the S4 glutamine mutants studied affected the steady-state activation of HERG. Typical examples of currents recorded from K525Q and R531Q channels during steady-state activation protocols are illustrated in Fig. 3A and Fig. 3B, respectively. For K525Q channels, activation first occurs at potentials < −100 mV, and therefore we used a holding potential of −120 mV and tail currents were recorded at −150 mV instead of −70 mV. For K525Q channels a depolarization to −80 mV resulted in over 50% activation (thick trace in Fig. 3A). For R531Q channels a depolarization to +30 mV was required to achieve 50% activation (thick trace in Fig. 3B). The mean steady-state activation curves for WT, K525Q, R528Q, R531Q, R534Q and R537Q are shown in Fig. 3C. The V0.5 of steady-state activation was significantly shifted in a negative direction from −34.7 ± 1.6 mV for WT (n = 8) to −84.9 ± 1.4 mV for K525Q (n = 9, P < 0.05, ANOVA followed by Dunnett's method). Conversely, the V0.5 of steady-state activation for all the other mutants was shifted in a positive direction (see Fig. 3C and Table 1).
Figure 3. Steady-state activation of HERG S4 mutant channels.
Typical examples of currents recorded from K525Q (A) and R531Q channels (B) during 8 s steady-state activation protocols (see insets). K525Q channels start to activate at potentials < −100 mV and a depolarization to −80 mV (thick trace) resulted in over 50% activation. A depolarization to +30 mV was required to achieve 50% activation for R531Q (thick trace). C, steady-state activation curves for WT, K525Q, R528Q, R531Q, R534Q and R537Q. The V0.5 of steady-state activation was significantly shifted in a negative direction from −34.7 ± 1.6 mV for WT (n = 8) to −84.9 ± 1.4 mV for K525Q (n = 9, P < 0.05). The V0.5 of steady-state activation for all the other mutants was shifted in a positive direction (see Table 1).
ΔG0 and zg
The effects of S4 mutants on the chemical (ΔG0) and electrostatic (−zgEF) potential for activation were calculated from steady-state activation data using eqn (2). The changes in ΔG0 for all S4 mutants compared to WT parallel the changes in V0.5 (see Table 1), i.e. a positive shift in V0.5 corresponds to a less negative ΔG0. Thus at 0 mV there is a smaller chemical potential driving the opening of R528Q, R531Q, R534Q and R537Q channels compared to WT channels whereas for K525Q there is a larger chemical potential driving the opening of these channels. There was a significant reduction in zg for all S4 mutants compared to WT HERG except for R531Q which was not different to WT (see Table 1). This suggests that in WT HERG, K525, R528, R534 and R537, but not R531, contribute to charge movement during activation of the channels.
Rates of activation
A typical example of a family of currents recorded using an envelope of tails protocol (see Methods) to measure the rates of activation at 0 mV for WT channels is shown in Fig. 4A and the peak tail current measured for each duration pulse is plotted in Fig. 4B. The inset to Fig. 4B highlights the initial phase of activation which is clearly sigmoidal. The sigmoidicity of the activation time course indicates that the channels must proceed through multiple pre-open closed states prior to opening (see also Trudeau et al. 1995; Wang et al. 1997; Gomez-Varela et al. 2002). In the example shown in Fig. 4 the time constant for the single exponential fit to the latter half of the peak tail current data points was 140 ms (Fig. 4B).
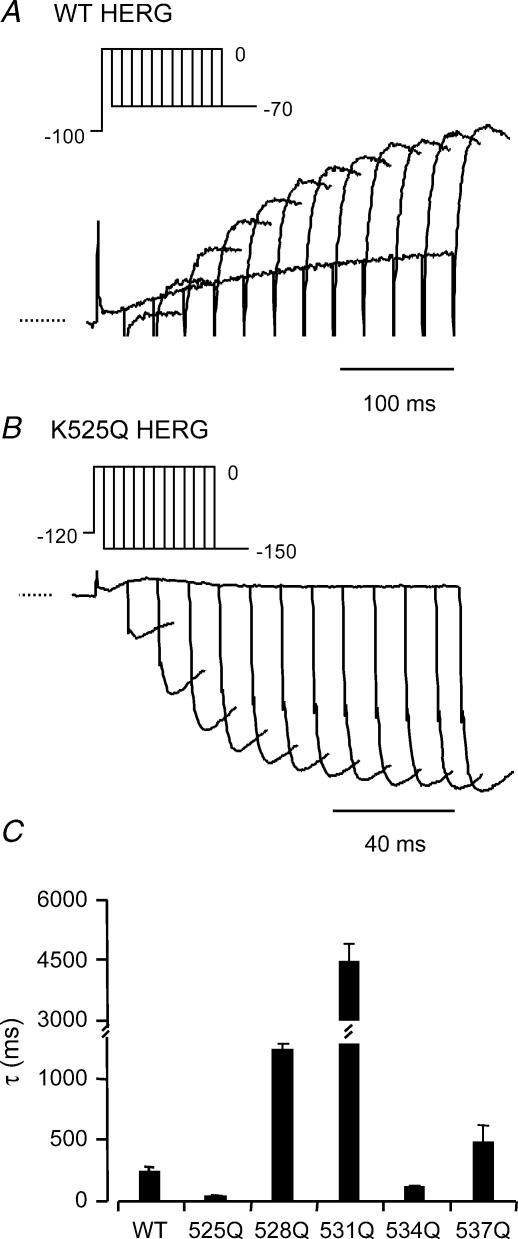
Typical examples of currents recorded from WT and K525Q during an envelope of tails protocol to measure the rate of activation at 0 mV are shown in Fig. 5A and Fig. 5B, respectively. Activation was considerably faster for K525Q than for WT (note different time scales for K525Q current traces in Fig. 5A and Fig. 5B). The values of the mean ± s.e.m. for the time constants of activation at 0 mV for all mutants are summarized in Fig. 5C. The rate of activation at 0 mV was fastest for K525Q (44 ± 9 ms) and slowest for R531Q (4382 ± 541 ms) (see Table 2).
Figure 5. Summary of rates of activation at 0 mV.
Typical examples of currents recorded from WT (A) and K525Q (B) during an envelope of tails protocol (see insets) to measure the rates of activation at 0 mV. Note different time scales for current traces in A and B. C, means ± s.e.m. for the time constants. The rate of activation at 0 mV was fastest for K525Q (44 ± 9 ms) and slowest for R531Q (4382 ± 541 ms) (see Table 2).
Table 2.
Rates of activation
| Cell Type | 0 mV τ (ms) (n) | Voltage (mV) | −(ΔG0 – zgEF)† (kJ mol−1) | τ (ms) (n) |
|---|---|---|---|---|
| WT | 240 ± 34 (6) | 100 | 49.8 | 27.6 ± 0.6 (3) |
| K525Q | 44 ± 9* (8) | 160 | 51.0 | 6.5 ± 0.5* (3) |
| R528Q | 1237 ± 54* (6) | 160 | 45.4 | 7.3 ± 3.4* (3) |
| R531Q | 4382 ± 541* (8) | 140 | 46.6 | 38.7 ± 2.4* (3) |
| R534Q | 113 ± 14* (7) | 140 | 50.0 | 3.9 ± 0.7* (3) |
| R537Q | 485 ± 133* (9) | 160 | 47.9 | 25.1 ± 5.4 (3) |
Total (chemical + electrostatic) potential energy was calculated from the ΔG0 and zgEF values derived from fitting eqn (2) to the steady-state activation data (see Table 1). Voltages shown in column 3 were chosen to give a total potential energy driving activation of ∼50 kJ mol−1 (shown in column four). The tau values shown in the fifth column were obtained at the corresponding voltages shown in column three. P < 0.05 compared to WT (ANOVA followed by Dunnett's method).
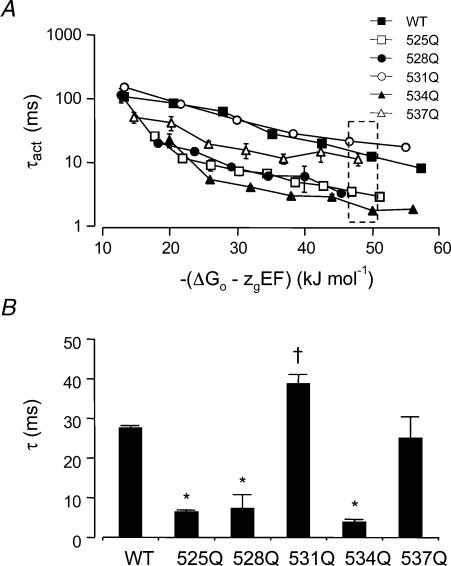
It is difficult to compare the effects of different mutants on the rates of activation at a given voltage as the driving force for activation (chemical plus electrostatic potential) will vary for each mutant compared to WT channels. In Fig. 6A we have therefore plotted rates of activation, for WT and S4 charge mutant channels, versus the total potential energy driving activation, i.e. −(ΔG0–zgEF). The highest total potential energy driving force for activation we were able to achieve for all mutants was ∼50 kJ mol−1 (see dashed box, Fig. 6A). At this driving force the rates of activation of K525Q, R528Q and R534Q were significantly faster than WT (P < 0.05, ANOVA followed by Dunnett's method), whereas R537Q was similar to WT and R531Q was significantly slower (see Fig. 6B and Table 2, P < 0.05, ANOVA followed by Dunnett's method). The rate of activation of HERG K+ channels at very positive driving forces reaches a limiting value (Wang et al. 1997; Gomez-Varela et al. 2002). It was not possible to measure rates of activation at sufficiently positive voltages to be able to measure the limiting value directly for all mutants investigated in this study. The limiting value for the time constant of activation of WT HERG was 15.5 ± 1.6 ms (n = 4, measured at +160 mV; driving force of 72 kJ mol−1). This result in combination with the data in Fig. 6 indicates that the limiting rate of activation for K525Q, R528Q and R534Q will be faster than WT. Conversely, the limiting rate of activation for R531Q and R537Q will be either similar to or slower than WT but we do not have sufficient data to be able to make definitive conclusions for either of these mutants.
Figure 6. Time constants of activation versus total potential driving force.
A, time constants of activation for WT and S4 charge mutant channels were obtained at voltages in the range +40 to +120 mV (WT), to +140 mV (R531Q) or to +160 mV (K525Q, R528Q, R534Q and R537Q) and are plotted versus the total potential driving force, i.e. −(ΔG0–zgEF). B, time constants of activation for WT and S4 charge mutants at a potential energy driving activation of ∼50 kJ mol−1 (see dashed box in A). τ values are significantly faster (*), or slower (†) than WT (P < 0.05, ANOVA followed by Dunnett's method).
Rates of deactivation
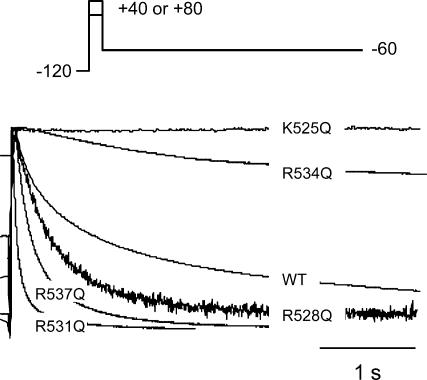
Typical examples of tail currents recorded at −60 mV for WT and all mutant HERG channels are shown in Fig. 7. Current traces have been normalized to the peak tail current to facilitate comparison of the rates of deactivation. In the traces shown in Fig. 7, K525Q and R534Q channels deactivate more slowly than WT, whereas R528Q, R537Q and R531Q deactivate more rapidly. The effect of the S4 charge mutants on the time constant of the fast component (τf), slow component (τs) and the relative proportions of the two components are summarized in Fig. 8. The K525Q (n = 6) and R534Q (n = 8) mutants had significantly slower time constants of deactivation than WT (n = 6, P < 0.05, ANOVA, followed by Dunnett's method), whereas the R531Q (n = 6) and R537Q (n = 9) mutants had significantly faster time constants of deactivation than WT (P < 0.05, ANOVA, followed by Dunnett's method). R528Q (n = 6) channels had a faster τf but a slower τs.
Figure 7. Rates of deactivation at −60 mV for WT HERG and all mutants.
Typical examples of tail currents recorded at −60 mV following a step to +40 or +80 mV (in case of R531Q) to activate the channels are illustrated. To facilitate comparison of the rates of deactivation, current traces have been normalized to the peak tail current. In the traces shown, the currents for K525Q and R534Q decay more slowly than for WT, which in turn is slower than for R528Q, R537Q and R531Q.
At −130 mV, the fast component of deactivation accounts for over 80% of deactivation for WT as well as all other mutant HERG channels. However, at more depolarized potentials (−80 to −60 mV) the fast component accounts for 50–70% of deactivation for WT compared to 80–90% for R531Q and R537Q, but only 20–30% for R534Q and 40–50% for R528Q (see Fig. 8C).
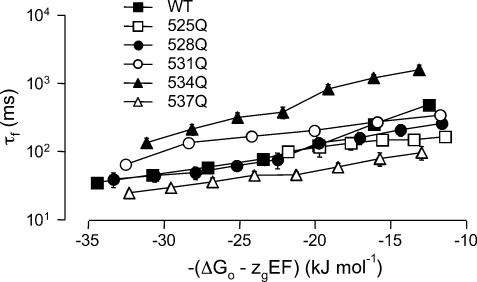
The problems associated with comparing rates of activation for WT and mutant channels for a given voltage (see above) are similarly applicable to comparing rates of deactivation between WT and mutant channels. To overcome this problem we measured rates of deactivation at voltages below the activation threshold (WT, R528Q, R534Q, R537Q: −90 to −160 mV; K525Q −120 to −190 mV; R531Q −10 to −130 mV) and have plotted the data versus the total potential energy −(ΔG0–zgEF) driving the deactivation process (see Fig. 9). For the purpose of this comparison we have only looked at the fast time constant of deactivation (see Discussion). The rates of deactivation of K525Q and R528Q are similar to those for WT channels at equivalent driving forces. The rates of deactivation for R534Q channels, however, are approximately 10-fold slower and R531Q 2- to 5-fold slower, than the rates of deactivation of WT channels at equivalent driving forces. The rates of deactivation of R537Q channels are approximately 2- to 3-fold faster than WT channels at equivalent driving forces.
Figure 9. Rates of deactivation versus total potential driving force.
The rates of deactivation were measured at voltages below the activation threshold (see Methods) and plotted against the total potential energy −(ΔG0–zgEF) driving the deactivation process. The rates of deactivation for R534Q channels are approximately 10-fold slower and R531Q 2- to 5-fold slower than the rates of deactivation of WT channels at equivalent driving forces. The rates of deactivation of R537Q channels are approximately 2- to 3-fold faster than WT channels at equivalent driving forces.
Role of K525 in stabilizing the closed state of HERG
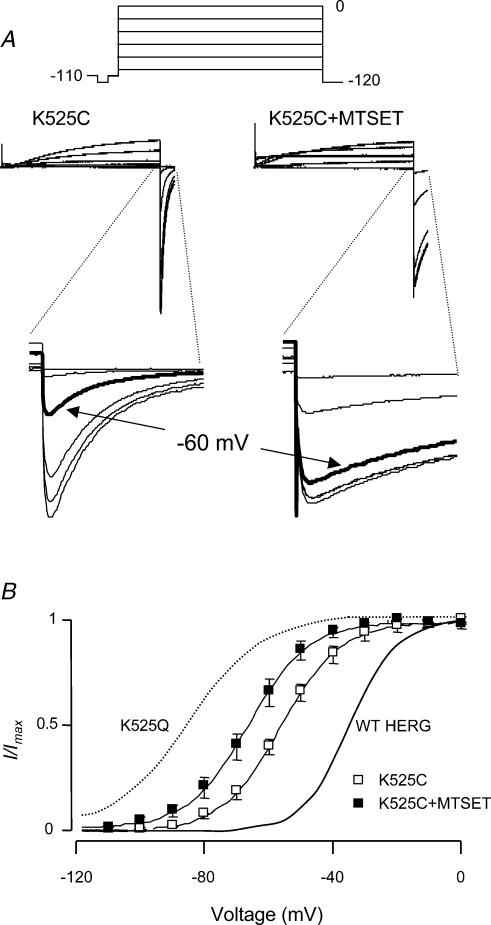
To further characterize the role of K525 we mutated K525 to cysteine and also investigated the effect of MTSET on the K525C mutant. Typical examples of currents recorded from K525C before and after modification with MTSET during step depolarizations to voltages in the range −100 to +40 mV followed by a step to −120 mV are shown in Fig. 10A. The insets in Fig. 10A highlight the tail currents. The K525C channels were less than 50% activated by a step depolarization to −60 mV (thick trace), whereas K525C + MTSET was greater than 50% activated (thick trace). The V0.5 for steady-state activation of K525C was −54.4 ± 0.7 mV, which was significantly different from WT (−34.7 ± 1.6 mV, n = 6, P < 0.05, ANOVA followed by Dunnett's method). Addition of MTSET to K525C caused a further leftward shift in the voltage dependence of steady-state activation from −54.4 ± 0.7 mV to −66.2 ± 2 mV (n= 6, P < 0.05, paired t test, see Fig. 10B).
Figure 10. Steady-state activation of K525C ± MTSET.
A, typical examples of currents recorded from K525C before and after modification with MTSET during a steady-state activation protocol (inset). The tail currents are highlighted in the insets. At −60 mV (bold traces), the K525C channels were less than 50% activated whereas K525C + MTSET was greater than 50% activated. B, mean steady-state activation curves for K525C before and after modification with MTSET. The mean value for V0.5 for K525C channels was −54.4 ± 0.7 mV; this was significantly different from WT (−34 ± 1.6 mV, continuous thick line). Addition of MTSET to K525C caused a further leftward shift in V0.5 of steady state activation (−66.2 ± 2 mV, n = 6, P < 0.05 compared to K525C, paired t test) but it was not as far shifted as K525Q (dotted line).
MTSET also caused an apparent acceleration of the rates of activation (e.g. see current traces during depolarization steps in Fig. 10A) and an apparent slowing of deactivation (see tail currents in insets to Fig. 10A). However, these changes were predominantly due to changes in total electrochemical driving force consequent to the shift in V0.5 of steady-state activation caused by addition of MTSET.
Discussion
HERG K+ channels play a crucial role in cardiac repolarization (Spector et al. 1996; Viswanathan et al. 1999; Tseng, 2001) and protection against arrhythmias initiated by ectopic beats (Lu et al. 2001). Central to both of these roles is the slow activation and deactivation kinetics of HERG K+ channels. In theory, the atypically slow activation of HERG could be due either to slow movement of the voltage sensor or to delayed coupling between movement of the voltage sensor and opening of the activation gate. Piper et al. (2003) have recently shown that the time constant of the major component of gating charge movement in HERG K+ channels is ∼70 ms, which is approximately two orders of magnitude slower than that for Shaker K+ channels (Bezanilla, 2000). Furthermore, studies using fluorophores attached to the extracellular linker between S3 and S4 have shown that while there are both rapid and slow voltage-dependent changes seen in fluorescence, the slow component correlates very closely with the voltage dependence of activation (Smith & Yellen, 2002). Thus two independent lines of evidence suggest that slow movement of the voltage sensor is likely to be the principal reason for the slow activation kinetics of HERG K+ channels.
Effect of mutating S4 charged residues to glutamine on steady-state activation
Mutating each of the positively charged residues of S4 to glutamine had a significant effect on the steady-state activation of HERG. The K525Q mutant had a negatively shifted V0.5 of steady-state activation compared to WT, whereas R528Q, R531Q, R534Q and R537Q mutants demonstrated a positively shifted V0.5 of steady-state activation compared to WT (see Figs 3 and 10, and Table 1). Fitting the steady-state activation data with a Boltzmann function (eqn (2)) also enables one to separate out the effects of each mutation on the chemical (ΔG0) and electrostatic (−zgEF) components of the free energy changes required to open the channels. The R528Q, R531Q, R534Q and R537Q mutants had less negative ΔG0 values compared to WT (see Table 1), i.e. in the absence of a transmembrane electric field these mutants shift the equilibrium towards the closed state. Conversely, K525Q had a significantly more negative ΔG0 than WT indicating that in K525Q channels the equilibrium is shifted towards the open state compared to WT channels.
All S4 glutamine mutants, except for R531Q, resulted in a significant reduction in the electrostatic component (−zgEF) driving activation (see Table 1). This suggests that in WT HERG, K525, R528, R534 and R537, but not R531, contribute to charge movement during activation of the channels. It is important to note however, that the values of zg derived from Boltzmann fits to steady-state activation data are necessarily underestimates of the total charge moved (see reviews by Almers, 1978; Sigworth, 1994). Furthermore, in the case of Shaker there are instances of mutants (e.g. L382V) where the reported values for gating charge moved as estimated by Boltzmann fits to steady-state activation data are significantly smaller than that for WT channels, yet when gating charge was measured directly in the same mutants it was found to be the same as that measured for WT channels (Schoppa et al. 1992). To be able to make definitive statements about the contributions of K525, R528, R531, R534 and R537 to gating charge movement in HERG will therefore require measurement of calibrated gating currents in these channels (i.e. measurement of gating current relative to the density of channel expression). The slow and hence small magnitude of gating currents in HERG K+ channels (Piper et al. 2003) will make such measurements very difficult and to date have not been reported.
Rates of activation
At present, there are only relatively simple kinetic models of the activation of HERG K+ channels (Wang et al. 1997; Kiehn et al. 1999; Lu et al. 2001; Piper et al. 2003; see below), which contrasts with the more sophisticated models for activation of Shaker K+ channels (Zagotta et al. 1994; Schoppa & Sigworth, 1998). This is primarily due to difficulties in measuring gating currents from HERG (Smith & Yellen, 2002; Piper et al. 2003). The small single channel conductance (Kiehn et al. 1999) and rapid inactivation (Smith et al. 1996; Spector et al. 1996) have also made it difficult to gather equivalent detailed kinetic information to that which is available for Shaker related channels.
It is widely accepted that activation of HERG K+ channels involves multiple pre-open closed state, viz:
With the minimal model required to fit the activation kinetics of WT HERG containing three pre-open closed states (C0, C1 and C2) and one open state (Wang et al. 1997; Kiehn et al. 1999; Lu et al. 2001). Furthermore, the transition between C1 and C2 is generally considered to be voltage independent (Wang et al. 1997). At very positive potentials the voltage-independent step (C1→ C2) will become rate limiting (see Fig. 6); however, at less positive potentials the final transition (C2→ O) is rate limiting (Wang et al. 1997). The presence of voltage-independent steps complicates the interpretation of the τ values estimated from fits to activation time courses at different potentials. Nevertheless, it is possible to obtain some important information about the activation pathway from the results presented here. In particular, the effects of mutations on rates of activation and deactivation can provide additional information to that obtained from steady-state activation data, regarding the stability of closed states versus the open state. An acceleration of the rate of activation indicates that the activation energy between the closed and open states has been reduced, and therefore the closed state has been destabilized. Conversely, an acceleration of the rate of deactivation suggests that there is a destabilization of the open state.
In general, the effect of S4 charge mutants on the rate of activation at 0 mV, i.e. in the absence of an electric field, paralleled the effects of the mutants on the chemical component of the free energy of activation. Thus those channels that had a more negative ΔG0 value, e.g. K525Q, had a faster rate of activation whereas those channels that had less negative ΔG0 values, e.g. R528Q, had a slower rate of activation (see Tables 1 and 2). There was, however, one notable exception to this trend. R534Q channels had a significantly less negative ΔG0 (−4.3 ± 1.5 kJ mol−1) compared to WT (−13.2 ± 1.3 kJ mol−1, see Table 1) but a faster rate of activation at 0 mV (113 ± 14 ms compared to 240 ± 34 ms for WT, see Table 2). This suggests that in WT channels R534 contributes to specific chemical interactions that raise the energy barrier for activation.
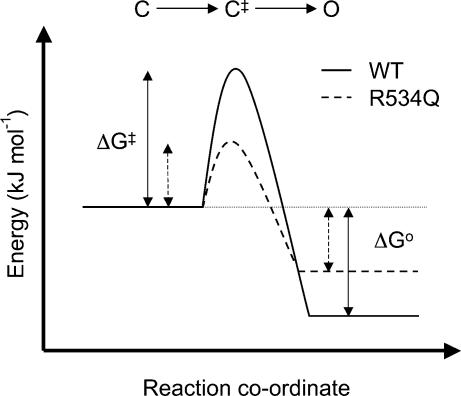
The electrochemical potential energy driving activation −(ΔG0 – zgEF) reflects the difference in energy between the open and closed states and therefore indicates whether the open–closed transition will take place or not, i.e. it is a thermodynamic property. The rate of activation, however, is a kinetic property and it will be primarily determined by the height of the energy barrier, i.e. the activation energy, ΔG‡, of the transition state complex between the closed and open state (see Fig. 11). Thus in the case of R534Q channels (dashed line in Fig. 11) the activation energy barrier is lower and therefore activation can proceed more rapidly, despite the fact that the energy difference between the closed and open state is significantly less than for the WT channel (continuous line, in Fig. 11).
Figure 11. Schematic diagram of activation energy profiles for WT and R534Q channels.
Changes in free energy for the closed (C) to open (O) state transition for WT (continuous line) and R534Q (dashed line) channels. The increase in energy required to reach the transition state complex (C‡), ΔG‡, is larger for WT compared to R534Q channels. Hence the rate of activation of WT channels will be slower than R534Q channels despite the larger difference in free energy, ΔG0, between the open and closed states for WT compared to R534Q channels.
The discrepancy between the rate of activation and apparent driving force for R534Q compared to WT channels was present throughout the voltage range studied (see Fig. 6). Furthermore, the limiting value for the time constant of activation at positive voltages was significantly faster for R534Q (4.1 ± 0.1 ms, n= 4) compared to WT channels (15.5 ± 1.6 ms, n= 4, P < 0.05 ANOVA followed by Dunnett's method). This suggests that R534 plays an important role in the voltage-independent C1→ C2 transition.
Interestingly, at very positive potentials the rates of activation of K525Q and R528Q were also faster than that of WT channels when they were compared at equivalent driving forces (see Fig. 6A), but R531Q was slower. This suggests that K525 and R528 residues in WT channels also contribute to interactions that stabilize one or more of the pre-open closed states. Conversely, the R531 residue is likely to contribute to interactions that destabilize one or more closed states.
Role of S4 in deactivation
Deactivation of WT HERG K+ channels is generally thought to occur with a bi-exponential time course (Zhou et al. 1998; Wang et al. 2000; Lu et al. 2001); however, others have argued that it can be well described by a single exponential time course (Wang et al. 1996; Kiehn et al. 1996; Wang et al. 1997; Jo et al. 1999; Johnson et al. 1999). In this study we found, at negative potentials, where there will be minimal contamination from reactivation of channels, the deactivation of WT channels occurs predominantly via a single exponential process (see Fig. 8 and Supplementary material). However, this is not the case for all the S4 charge mutants. For example, the deactivation time course for R528Q channels showed bi-exponential kinetics even at potentials well below the threshold for activation (see Fig. 8 and Supplementary material). In the activation scheme described above (Scheme 1) one would expect that if the rate limiting step for deactivation is the initial O → C2 step and this step is ≥ 2 orders of magnitude slower than the subsequent steps then the deactivation time course would be well described by a single exponential time course. Our results suggest that this is approximately the case for WT channels. This, however, may not be the case for R528Q or R534Q channels at moderately hyperpolarized potentials (−90 to −120 mV). As this voltage is well below the threshold for activation of these channels the most likely explanation for the bi-exponential deactivation is slowing of one of the later steps in the deactivation pathway (either C2→ C1 or C1→ C0).
Comparison of the rates of deactivation for WT and mutant channels at equivalent electrochemical driving forces and at potentials well below the activation threshold (i.e. where deactivation can be well described by a single exponential decay) showed that the rates of deactivation of K525Q and R528Q were very similar to WT channels (see Fig. 9). However, R534Q channels had ∼10-fold slower rates of deactivation, R531Q ∼3- to 4-fold slower rates of deactivation and R537Q ∼3-fold faster rates of deactivation. Thus R537Q appears to have lowered the activation energy for deactivation whereas R531Q and R534Q have increased the activation energy for deactivation.
The deactivation kinetics of HERG K+ channels are also influenced by the N-terminal domain (Schonherr & Heinemann, 1996; Spector et al. 1996; Wang et al. 1998; Morais Cabral et al. 1998) and this is thought to be mediated at least in part via an interaction between the N-terminus and the S4–S5 linker (Wang et al. 1998). Interestingly, the S4 charge mutants that have the most significant effect on deactivation are those nearest the S4–S5 linker. Thus it is possible that the different effects of the S4 mutants on deactivation reported in this study could be due to secondary effects on the S4–S5 linker. However, we cannot rule out the possibility that there may be additional interactions between the N-terminus and the transmembrane domains of the voltage-sensor region as has been suggested by Tseng and colleagues (Liu et al. 2003).
Positive charge at K525 is not essential for stabilizing the closed state
In WT channels K525 appears to stabilize the closed state, i.e. K525Q channels have a left-shifted V0.5 for steady-state activation as well as faster rates of activation compared to WT channels. Intriguingly, the less conservative mutation of K525 to a cysteine had a much milder phenotype than the K525Q mutation; V0.5 reduced from −34.7 mV (for WT) to −54.4 mV for K525C compared to −84.9 mV for K525Q. Addition of MTSET to K525C, which has the effect of restoring the positive charge at residue 525, however, accentuated the negative shift in V0.5 of steady-state activation (to −66.2 mV) (see Fig. 10). These data suggest that the lysine side chain rather than charge per se at residue 525 participates in specific interactions that stabilize the closed state and even moderate perturbations to the side chain interfere with these interactions.
Implications for mechanisms for voltage sensing in HERG K+ channels
The best characterized voltage-gated K+ channel is the Shaker K+ channel (see review by Bezanilla, 2000). Comparison of our data with those obtained for the equivalent mutations in Shaker K+ channels, however, reveals some interesting differences. For example, R531 in our experiments appears to play a very different role from that of R371 in Shaker. The R371Q mutant in Shaker causes a significant hyperpolarization shift in the voltage dependence of steady-state activation (Papazian et al. 1991), whereas the R531Q mutant in HERG results in a +64 mV depolarization shift in the voltage dependence of steady-state activation (see Fig. 3 and Table 1). Furthermore, R531 may not be a significant contributor to charge movement during activation (zg was not changed compared to WT HERG, see Table 1) whereas R371 is a major contributor to charge movement during activation (Aggarwal & MacKinnon, 1996; Seoh et al. 1996).
Another interesting difference between S4 charge mutants in HERG and Shaker is that in Shaker, the S4 neutralization mutations K374Q and R377Q are not functional (Papazian et al. 1991) as they result in channels that are not properly folded (Papazian et al. 1995). These mutations are thought to disrupt electrostatic interactions with acidic residues in S2 and S3 (Papazian et al. 1995; Tiwari-Woodruff et al. 1997). Salt bridges between residues in S4 and S2 are also seen in the KvAP structure (Jiang et al. 2003). The corresponding mutations in HERG, R534Q and R537Q are functional. This suggests that potential electrostatic interactions between the S4 charged residues and residues in S2 and/or S3 may not play as significant a role in protein folding or assembly of HERG K+ channels. However, we cannot exclude the possibility that salt bridges may only affect protein folding and stability of HERG K+ channels at the higher temperatures that the channels would experience in human cells, i.e. 37°C, but not under the less stringent conditions observed in the Xenopus oocyte system (Zhou et al. 1999).
Recently, there has been considerable debate regarding the mechanisms of voltage gating (Blaustein & Miller, 2004), following the unravelling of the structure of a bacterial voltage-gated K+ channel, KvAP (Jiang et al. 2003). Our data suggest there are differences in voltage sensing between HERG and Shaker channels, which in turn may be different from that of KvAP. In addition, data from HCN channels have suggested alternative mechanisms such as collapsing voltage gradients (Horn, 2004). To accurately define the mechanism of voltage sensing in HERG will require further studies, including hopefully atomic resolution structural studies.
Acknowledgments
We thank Camille Yip for expert technical assistance and Dr Robert Vandenberg for preparation of Xenopus oocytes. This work was supported by an NH & MRC Project Grant (no. 209547). R.N.S. is a recipient of an NH & MRC Medical Postgraduate Scholarship and J.I.V. is supported by an NH & MRC R. D. Wright Career Development Award.
Supplementary material
The online version of this paper can be accessed at:
DOI: 10.1113/jphysiol.2004.062588
http://jp.physoc.org/cgi/content/full/jphysiol.2004.062588v1/DC1 and contains supplementary material consisting of a figure entitled ‘Comparison of bi-exponential and single exponential fits to R528Q deactivation tail currents recorded at −80 mV’, and a table entitled ‘Ratio SSq double exp fit/single exp fit’.
This material is also available from:
http://blackwellpublishing.com/products/journals/suppmat/tjp/tjp366/tjp366sm.htm
References
- Aggarwal SK, MacKinnon R. Contribution of the S4 segment to gating charge in the Shaker K+ channel. Neuron. 1996;16:1169–1177. doi: 10.1016/s0896-6273(00)80143-9. [DOI] [PubMed] [Google Scholar]
- Almers W. Gating currents and charge movements in excitable membranes. Rev Physiol Biochem Pharmacol. 1978;82:96–190. doi: 10.1007/BFb0030498. [DOI] [PubMed] [Google Scholar]
- Bezanilla F. The voltage sensor in voltage-dependent ion channels. Physiol Rev. 2000;80:555–592. doi: 10.1152/physrev.2000.80.2.555. [DOI] [PubMed] [Google Scholar]
- Bezanilla F. Voltage sensor movements. J Gen Physiol. 2002;120:465–473. doi: 10.1085/jgp.20028660. [DOI] [PMC free article] [PubMed] [Google Scholar]
- Blaustein RO, Miller C. Ion channels: Shake, rattle or roll? Nature. 2004;427:499–500. doi: 10.1038/427499a. [DOI] [PubMed] [Google Scholar]
- Curran ME, Splawski I, Timothy KW, Vincent GM, Green ED, Keating MT. A molecular basis for cardiac arrhythmia: HERG mutations cause long QT syndrome. Cell. 1995;80:795–803. doi: 10.1016/0092-8674(95)90358-5. [DOI] [PubMed] [Google Scholar]
- Fedida D, Hesketh JC. Gating of voltage-dependent potassium channels. Prog Biophys Mol Biol. 2001;75:165–199. doi: 10.1016/s0079-6107(01)00006-2. [DOI] [PubMed] [Google Scholar]
- Gomez-Varela D, de la Pena P, Garcia J, Giraldez T, Barros F. Influence of amino-terminal structures on kinetic transitions between several closed and open states in human erg K+ channels. J Membr Biol. 2002;187:117–133. doi: 10.1007/s00232-001-0156-4. [DOI] [PubMed] [Google Scholar]
- Hancox JC, Levi AJ, Witchel HJ. Time course and voltage-dependence of expressed HERG current compared with native ‘rapid’ delayed rectifier K current during the cardiac ventricular action potential. Pflugers Arch. 1998;436:843–853. doi: 10.1007/s004240050713. [DOI] [PubMed] [Google Scholar]
- Horn R. How S4 segments move charge. Let me count the ways. J General Physiol. 2004;123:1–4. doi: 10.1085/jgp.200308975. [DOI] [PMC free article] [PubMed] [Google Scholar]
- Jiang Y, Lee A, Chen J, Ruta V, Cadene M, Chait BT, MacKinnon R. X-ray structure of a voltage-dependent K+ channel. Nature. 2003;423:33–41. doi: 10.1038/nature01580. [DOI] [PubMed] [Google Scholar]
- Jo SH, Youm JB, Kim I, Lee CO, Earm YE, Ho WK. Blockade of HERG channels expressed in Xenopus oocytes by external H+ Pflugers Arch. 1999;438:23–29. doi: 10.1007/s004240050875. [DOI] [PubMed] [Google Scholar]
- Johnson JP, Jr, Balser JR, Bennett PB. Enhancement of HERG K+ currents by Cd2+ destabilization of the inactivated state. Biophys J. 1999;77:2534–2541. doi: 10.1016/s0006-3495(99)77088-8. [DOI] [PMC free article] [PubMed] [Google Scholar]
- Karlin A, Akabas MH. Substituted-cysteine accessibility method. Meth Enzymol. 1998;293:123–145. doi: 10.1016/s0076-6879(98)93011-7. [DOI] [PubMed] [Google Scholar]
- Kiehn J, Lacerda AE, Brown AM. Pathways of HERG inactivation. Am J Physiol. 1999;277:H199–H210. doi: 10.1152/ajpheart.1999.277.1.H199. [DOI] [PubMed] [Google Scholar]
- Kiehn J, Lacerda AE, Wible B, Brown AM. Molecular physiology and pharmacology of HERG. Single-channel currents and block by dofetilide. Circulation. 1996;94:2572–2579. doi: 10.1161/01.cir.94.10.2572. [DOI] [PubMed] [Google Scholar]
- Liu S, Rasmusson RC, Campbell DC, Wang S, Strauss HC. Activation and inactivation kinetics of an E-4031-sensitive current from single ferret atrial myocytes. Biophys J. 1996;70:2704–2715. doi: 10.1016/S0006-3495(96)79840-5. [DOI] [PMC free article] [PubMed] [Google Scholar]
- Liu J, Zhang M, Jiang M, Tseng GN. Negative charges in the transmembrane domains of the HERG K channel are involved in the activation- and deactivation-gating processes. J General Physiol. 2003;121:599–614. doi: 10.1085/jgp.200308788. [DOI] [PMC free article] [PubMed] [Google Scholar]
- Lu Y, Mahaut-Smith MP, Huang CL, Vandenberg JI. Mutant MiRP1 subunits modulate HERG K+ channel gating: a mechanism for pro-arrhythmia in long QT syndrome type 6. J Physiol. 2003;551:253–262. doi: 10.1113/jphysiol.2003.046045. [DOI] [PMC free article] [PubMed] [Google Scholar]
- Lu Y, Mahaut-Smith MP, Varghese A, Huang CL, Kemp PR, Vandenberg JI. Effects of premature stimulation on HERG K+ channels. J Physiol. 2001;537:843–851. doi: 10.1111/j.1469-7793.2001.00843.x. [DOI] [PMC free article] [PubMed] [Google Scholar]
- Mitrovic AD, Amara SG, Johnston GA, Vandenberg RJ. Identification of functional domains of the human glutamate transporters EAAT1 and EAAT2. J Biol Chem. 1998;273:14698–14706. doi: 10.1074/jbc.273.24.14698. [DOI] [PubMed] [Google Scholar]
- Morais Cabral JH, Lee A, Cohen SL, Chait BT, Li M, Mackinnon R. Crystal structure and functional analysis of the HERG potassium channel N terminus: a eukaryotic PAS domain. Cell. 1998;95:649–655. doi: 10.1016/s0092-8674(00)81635-9. [DOI] [PubMed] [Google Scholar]
- Nakajima T, Furukawa T, Hirano Y, Tanaka T, Sakurada H, Takahashi T, Nagai R, Itoh T, Katayama Y, Nakamura Y, Hiraoka M. Voltage-shift of the current activation in HERG S4 mutation (R534C) in LQT2. Cardiovasc Res. 1999;44:283–293. doi: 10.1016/s0008-6363(99)00195-9. [DOI] [PubMed] [Google Scholar]
- Papazian DM, Shao XM, Seoh SA, Mock AF, Huang Y, Wainstock DH. Electrostatic interactions of S4 voltage sensor in Shaker K+ channel. Neuron. 1995;14:1293–1301. doi: 10.1016/0896-6273(95)90276-7. [DOI] [PubMed] [Google Scholar]
- Papazian DM, Timpe LC, Jan YN, Jan LY. Alteration of voltage-dependence of Shaker potassium channel by mutations in the S4 sequence. Nature. 1991;349:305–310. doi: 10.1038/349305a0. [DOI] [PubMed] [Google Scholar]
- Piper DR, Varghese A, Sanguinetti MC, Tristani-Firouzi M. Gating currents associated with intramembrane charge displacement in HERG potassium channels. Proc Natl Acad Sci U S A. 2003;100:10534–10539. doi: 10.1073/pnas.1832721100. [DOI] [PMC free article] [PubMed] [Google Scholar]
- Sanguinetti MC, Jiang C, Curran ME, Keating MT. A mechanistic link between an inherited and an acquired cardiac arrhythmia: HERG encodes the IKr potassium channel. Cell. 1995;81:299–307. doi: 10.1016/0092-8674(95)90340-2. [DOI] [PubMed] [Google Scholar]
- Schonherr R, Heinemann SH. Molecular determinants for activation and inactivation of HERG, a human inward rectifier potassium channel. J Physiol. 1996;493:635–642. doi: 10.1113/jphysiol.1996.sp021410. [DOI] [PMC free article] [PubMed] [Google Scholar]
- Schoppa NE, McCormack K, Tanuoye MA, Sigworth FJ. The size of gating charge in wild-type and mutant Shaker potassium channels. Science. 1992;255:1712–1715. doi: 10.1126/science.1553560. [DOI] [PubMed] [Google Scholar]
- Schoppa NE, Sigworth FJ. Activation of Shaker potassium channels. III. An activation gating model for wild-type and V2 mutant channels. J General Physiol. 1998;111:313–342. doi: 10.1085/jgp.111.2.313. [DOI] [PMC free article] [PubMed] [Google Scholar]
- Seoh SA, Sigg D, Papazian DM, Bezanilla F. Voltage-sensing residues in the S2 and S4 segments of the Shaker K+ channel. Neuron. 1996;16:1159–1167. doi: 10.1016/s0896-6273(00)80142-7. [DOI] [PubMed] [Google Scholar]
- Sigworth FJ. Voltage gating of ion channels. Q Rev Biophys Feb. 1994;27:1–40. doi: 10.1017/s0033583500002894. [DOI] [PubMed] [Google Scholar]
- Smith PL, Baukrowitz T, Yellen G. The inward rectification mechanism of the HERG cardiac potassium channel. Nature. 1996;379:833–836. doi: 10.1038/379833a0. [DOI] [PubMed] [Google Scholar]
- Smith PL, Yellen G. Fast and slow voltage sensor movements in HERG potassium channels. J General Physiol. 2002;119:275–293. doi: 10.1085/jgp.20028534. [DOI] [PMC free article] [PubMed] [Google Scholar]
- Spector PS, Curran ME, Zou A, Keating MT, Sanguinetti MC. Fast inactivation causes rectification of the IKr channel. J General Physiol. 1996;107:611–619. doi: 10.1085/jgp.107.5.611. [DOI] [PMC free article] [PubMed] [Google Scholar]
- Thompson JD, Higgins DG, Gibson TJ. CLUSTAL W: improving the sensitivity of progressive multiple sequence alignment through sequence weighting, position-specific gap penalties and weight matrix choice. Nucl Acids Res. 1994;22:4673–4680. doi: 10.1093/nar/22.22.4673. [DOI] [PMC free article] [PubMed] [Google Scholar]
- Tiwari-Woodruff SK, Schulteis CT, Mock AF, Papazian DM. Electrostatic interactions between transmembrane segments mediate folding of Shaker K+ channel subunits. Biophys J. 1997;72:1489–1500. doi: 10.1016/S0006-3495(97)78797-6. [DOI] [PMC free article] [PubMed] [Google Scholar]
- Trudeau MC, Warmke JW, Ganetzky B, Robertson GA. HERG, a human inward rectifier in the voltage-gated potassium channel family. Science. 1995;269:92–95. doi: 10.1126/science.7604285. [DOI] [PubMed] [Google Scholar]
- Tseng GN. IKr: the hERG channel. J Mol Cell Cardiol. 2001;33:835–849. doi: 10.1006/jmcc.2000.1317. [DOI] [PubMed] [Google Scholar]
- Vandenberg JI, Torres AM, Campbell TJ, Kuchel PW. The HERG K+ channel: progress in understanding the molecular basis of its unusual gating kinetics. Eur Biophys J. 2004;33:89–97. doi: 10.1007/s00249-003-0338-3. [DOI] [PubMed] [Google Scholar]
- Vandenberg JI, Walker BD, Campbell TJ. HERG K+ channels: friend and foe. Trends Pharmacol Sci. 2001;22:240–246. doi: 10.1016/s0165-6147(00)01662-x. [DOI] [PubMed] [Google Scholar]
- Viloria CG, Barros F, Giraldez T, Gomez-Varela D, de la Pena P. Differential effects of amino-terminal distal and proximal domains in the regulation of human erg K+ channel gating. Biophys J. 2000;79:231–246. doi: 10.1016/S0006-3495(00)76286-2. [DOI] [PMC free article] [PubMed] [Google Scholar]
- Viswanathan PC, Shaw RM, Rudy Y. Effects of IKr and IKs heterogeneity on action potential duration and its rate dependence: a simulation study. Circ. 1999;99:2466–2474. doi: 10.1161/01.cir.99.18.2466. [DOI] [PubMed] [Google Scholar]
- Wang S, Liu S, Morales MJ, Strauss HC, Rasmusson RL. A quantitative analysis of the activation and inactivation kinetics of HERG expressed in Xenopus oocytes. J Physiol. 1997;502:45–60. doi: 10.1111/j.1469-7793.1997.045bl.x. [DOI] [PMC free article] [PubMed] [Google Scholar]
- Wang S, Morales MJ, Liu S, Strauss HC, Rasmusson RL. Time, voltage and ionic concentration dependence of rectification of h-erg expressed in Xenopus oocytes. FEBS Lett. 1996;389:167–173. doi: 10.1016/0014-5793(96)00570-4. [DOI] [PubMed] [Google Scholar]
- Wang J, Myers CD, Robertson GA. Dynamic control of deactivation gating by a soluble amino-terminal domain in HERG K+ channels. J General Physiol. 2000;115:749–758. doi: 10.1085/jgp.115.6.749. [DOI] [PMC free article] [PubMed] [Google Scholar]
- Wang J, Trudeau MC, Zappia AM, Robertson GA. Regulation of deactivation by an amino terminal domain in human ether-a-go-go-related gene potassium channels. J General Physiol. 1998;112:637–647. doi: 10.1085/jgp.112.5.637. [DOI] [PMC free article] [PubMed] [Google Scholar]
- Warmke JW, Ganetzky B. A family of potassium channel genes related to eag in Drosophila and mammals. Proc Natl Acad Sci U S A. 1994;91:3438–3442. doi: 10.1073/pnas.91.8.3438. [DOI] [PMC free article] [PubMed] [Google Scholar]
- Zagotta WN, Hoshi T, Aldrich RW. Shaker potassium channel gating. III: Evaluation of kinetic models for activation. J General Physiol. 1994;103:321–362. doi: 10.1085/jgp.103.2.321. [DOI] [PMC free article] [PubMed] [Google Scholar]
- Zhou Z, Gong QYeB, Fan Z, Makielski JC, Robertson GA, January CT. Properties of HERG channels stably expressed in HEK 293 cells studied at physiological temperature. Biophys J. 1998;74:230–241. doi: 10.1016/S0006-3495(98)77782-3. [DOI] [PMC free article] [PubMed] [Google Scholar]
- Zhou Z, Gong Q, January CT. Correction of defective protein trafficking of a mutant HERG potassium channel in human long QT syndrome. Pharmacological and temperature effects. J Biol Chem. 1999;274:31123–31126. doi: 10.1074/jbc.274.44.31123. [DOI] [PubMed] [Google Scholar]
Associated Data
This section collects any data citations, data availability statements, or supplementary materials included in this article.
Supplementary Materials
The online version of this paper can be accessed at:
DOI: 10.1113/jphysiol.2004.062588
http://jp.physoc.org/cgi/content/full/jphysiol.2004.062588v1/DC1 and contains supplementary material consisting of a figure entitled ‘Comparison of bi-exponential and single exponential fits to R528Q deactivation tail currents recorded at −80 mV’, and a table entitled ‘Ratio SSq double exp fit/single exp fit’.
This material is also available from:
http://blackwellpublishing.com/products/journals/suppmat/tjp/tjp366/tjp366sm.htm


