Abstract
Capacitance measurements of exocytosis were applied to functionally identified α-, β- and δ-cells in intact mouse pancreatic islets. The maximum rate of capacitance increase in β-cells during a depolarization to 0 mV was equivalent to 14 granules s−1, <5% of that observed in isolated β-cells. β-Cell secretion exhibited bell-shaped voltage dependence and peaked at +20 mV. At physiological membrane potentials (up to ∼−20 mV) the maximum rate of release was ∼4 granules s−1. Both exocytosis (measured by capacitance measurements) and insulin release (detected by radioimmunoassay) were strongly inhibited by the L-type Ca2+ channel blocker nifedipine (25 μm) but only marginally (<20%) affected by the R-type Ca2+ channel blocker SNX482 (100 nm). Exocytosis in the glucagon-producing α-cells peaked at +20 mV. The capacitance increases elicited by pulses to 0 mV exhibited biphasic kinetics and consisted of an initial transient (150 granules s−1) and a sustained late component (30 granules s−1). Whereas addition of the N-type Ca2+ channel blocker ω-conotoxin GVIA (0.1 μm) inhibited glucagon secretion measured in the presence of 1 mm glucose to the same extent as an elevation of glucose to 20 mm, the L-type Ca2+ channel blocker nifedipine (25 μm) had no effect. Thus, glucagon release during hyperglycaemic conditions depends principally on Ca2+-influx through N-type rather than L-type Ca2+ channels. Exocytosis in the somatostatin-secreting δ-cells likewise exhibited two kinetically separable phases of capacitance increase and consisted of an early rapid (600 granules s−1) component followed by a sustained slower (60 granules s−1) component. We conclude that (1) capacitance measurements in intact pancreatic islets are feasible; (2) exocytosis measured in β-cells in situ is significantly slower than that of isolated cells; and (3) the different types of islet cells exhibit distinct exocytotic features.
The pancreatic islet cells are electrically excitable and utilize electrical signals to couple changes in the blood glucose concentration to stimulation or inhibition of islet hormone release (Ashcroft & Rorsman, 1995). Traditionally, hormone release is assayed by biochemical methods such as radioimmunoassay (RIA) and enzyme-linked immunosorbent assay (ELISA). The resolution of these assays has improved over the years and the detection limit is now as low as ∼100 amol (500 fg) of insulin (Westerlund & Bergsten, 2001). With such ultrasensitive immunoassays, it is possible to measure insulin release from individual islets, containing ∼1000 β-cells, with a temporal resolution as high as ∼10 s. Measurements of hormone release using these assays have enabled a thorough characterization of how metabolic fuels, neurotransmitters, hormones and pharmacological agents influence islet hormone release. However, understanding of the fundamental processes involved in hormone secretion requires even more sensitive measurements of exocytosis. The application of capacitance measurements (Neher, 1998) to pancreatic β-cells has allowed exocytosis to be monitored in individual cells with millisecond resolution. However, except for a single study (Speier & Rupnik, 2003), all capacitance measurements in islet cells have been carried out on individual cells (Gillis & Misler, 1992; Ammala et al. 1993b; Garcia-Barrado et al. 1996; Gromada et al. 1997; Mariot et al. 1998) maintained in tissue culture, whereas hormone release measurements are typically performed on intact islets. Ideally, capacitance measurements should, of course, be applied to islet cells in the intact tissue. The importance of performing such measurements is illustrated by three considerations. First, experiments on isolated β-cells have revealed that they have a low secretory capacity compared to the intact tissue (Pipeleers et al. 1982). Second, capacitance measurements on isolated β-cells indicate that exocytosis, at least for limited periods, can proceed at rates four order of magnitude higher than the maximum rate of secretion suggested by insulin release measurements (Ammala et al. 1993b; Barg et al. 2001; Bratanova-Tochkova et al. 2002) and this has raised concerns that they may not report secretion. Third, experiments in adrenal chromaffin cells suggest that there exists a closer spatial relationship between the Ca2+ channels and the exocytotic machinery in the intact tissue than indicated by experiments on dispersed cells (Moser & Neher, 1997).
In this study, we have applied standard whole-cell recordings to characterize exocytosis in islet cells in intact pancreatic islets. We demonstrate that exocytosis measured in β-cells in situ is 30-fold slower than previously suggested by studies on isolated cells. We also provide evidence that the exocytotic properties of the glucagon-producing α- and somatostatin-releasing δ-cells differ significantly from those of the β-cells.
Methods
Preparation of pancreatic islets
All experiments were carried out on cells in situ within intact pancreatic islets. NMRI mice were purchased from a commercial breeder (Möllegaard, Ry, Denmark). The experimental procedures have been approved by the ethical committee in Lund. The mice were stunned by a blow to the head and killed by cervical dislocation. Collagenase (0.7 units ml−1) was dissolved in Hanks' buffer and injected into the pancreatic duct immediately after killing the animal and opening of the abdominal cavity. The caudal portion of the pancreas was then excised and islets were isolated by gentle digestion for 25 min at +37°C. Islets thus obtained were washed extensively in collagenase-free solution and subsequently maintained in short-term tissue culture (<24 h) in RPMI 1640 containing 5 mm glucose and 10% (v/v) fetal calf serum and supplemented with 100 μg ml−1 streptomycin and 100 IU ml−1 penicillin (WWR International, Stockholm, Sweden).
Electrophysiology
Membrane currents and exocytosis were recorded from superficial cells in intact pancreatic islets essentially as described elsewhere (Gopel et al. 2000a) using the standard whole-cell technique. The measurements were performed using an EPC-9 patch-clamp amplifier (HEKA Electronics, Lambrecht/Pfalz, Germany) and Pulse (version 8.53) software. Currents were compensated for capacitive transients and linear leak using a –P/4 protocol. Patch pipettes were pulled from borosilicate or quartz glass (tip resistance: 1.5–2.5 MΩ when filled with the pipette solution).
Capacitance measurements
Exocytosis was detected as changes in cell capacitance, which was estimated by the Lindau-Neher technique (Gillis, 1995) implementing the ‘Sine + DC’ feature of the lock-in module. The amplitude of the sine wave was 20 mV and the frequency set as 1250 Hz. We have evaluated the feasibility of applying this technique to pancretic islet cells in situ (Kanno et al. 2004). Briefly, the β-cells are only weakly coupled to neighbouring cells (cell coupling between a pair of β-cells as low as 0.22 nS) and theoretical analyses indicates that only ∼1.5% of the current responses elicited by the sine wave originate in the neighbouring cells when the frequency of the sine wave was 1.2 kHz. Thus, capacitance measurements from β-cells in situ are feasible and reliable. We point out that α- and δ-cells are not electrically coupled (Gopel et al. 1999a) and measurements of cell capacitance in these cells within the intact islets should accordingly be straightforward. Endocytosis operates at much slower rates than exocytosis (cf. Fig. 5 and Eliasson et al. 1996) and no attempt was therefore made to compensate for it. All electrophysiological measurements were carried out at +32−34°C.
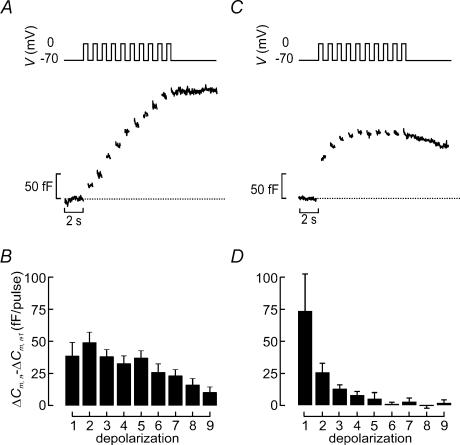
Figure 5. Distinct patterns of exocytosis during repetitive stimulation in α- and β-cells.
A, capacitance increases (bottom) elicited by a train of depolarizations from −70 mV to 0 mV (top) in a β-cell identified as described in Fig. 2.B, increase in cell capacitance per pulse (ΔCm,n−ΔCm,n−1) displayed against depolarization number (n). C and D, as in A and B but functionally identified α-cells were used. Data are presented as mean values ±s.e.m. of 31 β-cells (B) and 4 α-cells (D).
Solutions
The standard extracellular medium consisted of (mm): 118 NaCl, 20 tetraethylammonium-Cl (TEA-Cl), 5.6 KCl, 1.2 MgCl2, 5 Hepes (pH 7.4 with NaOH), 2.6 CaCl2 and 5 d-glucose. The pipette solution dialysing the cell interior contained (mm): 125 mm potassium glutamate, 10 mm KCl, 10 mm NaCl, 1 mm MgCl2, 0.05 mm EGTA, 3 mm Mg-ATP, 0.1 mm cAMP and 5 mm Hepes (pH 7.1 using KOH). The Ca2+ channel blockers SNX482 and ω-conotoxin GVIA were obtained from Peptides International (Louiseville, KY, USA) and Alomone Labs (Jerusalem, Israel) and were inlcuded as indicated in the legends to the figures and tables. All other reagents were of analytical grade and obtained from Sigma (St Louis, MO, USA).
Insulin and glucagon secretion assays
Insulin and glucagon secretion were measured as described elsewhere (Salehi et al. 1999). Briefly, batches of 10 islets were preincubated in 1 ml of Krebs–Ringer buffer (KRB) supplemented with 1 mm glucose for 30 min followed by 1 h incubation in 1 ml KRB containing 1 or 20 mm glucose.
Electron microscopy
Intact pancreatic islets were fixed in 2.5% glutaraldehyde for 1 h at 4°C, treated with 1% osmium tetroxide, dehydrated, and embedded in Durcupan before being cut into ∼70 nm ultrathin sections. The sections were contrasted with uranyl citrate and lead citrate before being examined in a JEM 1230 electron microscope (JEOL-USA, Inc., Peabody, MA, USA). Analysis of the granule diameter in α- and β-cell granules was performed as described elsewhere (Barg et al. 2000; Olofsson et al. 2002). The δ-cell granules were treated differently because of their non-spherical appearance. In these cells the long (a) and short (b) axes of the granular profiles were measured and plotted in separate histograms. The actual values of a and b were determined using methods similar to those employed to measure the granule diameters in the α- and β-cells. The area (A) of the spheroid δ-cell granule was then calculated using the formula:
| (1) |
Data analysis
The increase in cell capacitance was measured once a steady-state level had been attained ignoring any rapidly decaying capacitance increases relaxing within 1 s. The release kinetics was estimated by approximating eqn (5) of Barg et al. (2001) to the data points. We emphasize that the model does not necessarily have any mechanistic implications and we use it here simply to describe the time course of exocytosis in the different cell types. All data are quoted as mean values ±s.e.m. of indicated number of experiments. Statistical significances were evaluated using Student's t test or ANOVA followed by Tukey-Kramer's multiple comparisons test.
Results
Granule dimensions in β-, α- and δ-cells
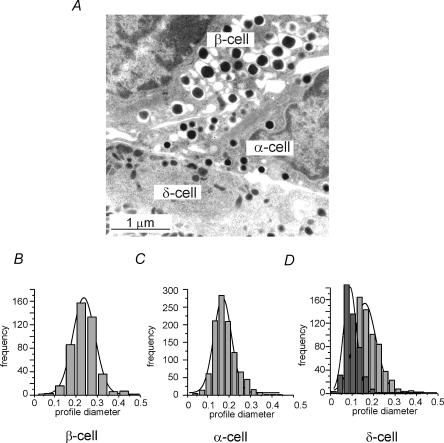
Capacitance measurements report changes in cell surface area, which principally reflect fusion of the secretory granules with the plasma membrane. In order to convert the observed increases in cell capacitance to number of granules released, it is necessary to know the diameter of the secretory granules in the different endocrine islet cells. Figure 1A shows an electron micrograph of mouse pancreatic α-, β- and δ-cells. Histograms of the profile diameters of the secretory granules in α- and β-cells are shown in Fig. 1B and C. The mean granule diameters, estimated as described elsewhere (Olofsson et al. 2002), were 236 ± 7 nm (n = 1050) and 305 ± 10 nm (n = 464) in the α- and β-cells, respectively. These values are similar to those reported previously (Barg et al. 2000; Olofsson et al. 2002). The δ-cells' granules were different from those in the α- and β-cells and appeared more elongated on the micrographs (Fig. 1D). The long and short axes of the δ-cells, average 216 ± 16 nm (n = 691) and 124 ± 10 nm (n = 465), respectively. The area of one granule could thus, approximating the δ-cell granules to spheroids (eqn (1)), be estimated to be 0.11 ± 0.02 μm2. Using a specific membrane capacitance of 10 fF μm−2 and assuming spherical geometry for the α- and β-cells, these surface areas predict that fusion of individual secretory granules will produce capacitance increases of 1.8, 2.9 and 1.1 fF in the α-, β- and δ-cells, respectively.
Figure 1. Ultrastructure of α-, β- and δ-cell granules.
A, electron micrograph of mouse α-, β- and δ-cell as indicated. B–D, histograms of the profile diameter of granules from β-cells (B) and α-cells (C) as well as the profiles of the long (a; light grey) and short (b; dark grey) axes of δ-cell granules D, the continuous curves represent Gaussian fits to the respective distribution needed to estimate the actual diameters (α- and β-cells) and long and short axes (δ-cells), respectively. Scale bars correspond to 1 μm.
Functional identification of α-, β- and δ-cells
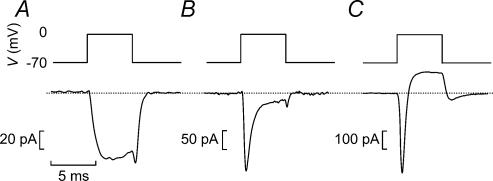
When recordings were carried out with K+-containing pipette solution and a TEA-containing extracellular solution (to block most types of voltage-gated K+ channels) and a holding potential of −70 mV, β-cells can be distinguished from the α- and δ-cells in not exhibiting a rapidly activating and inactivating TTX-sensitive Na+ current. Although mouse β-cells do in fact contain sizeable Na+ currents, these exhibit unusual inactivation properties and are fully inactivated when the membrane potential is held at −90 mV (Gopel et al. 1999a) and only a slowly inactivating Ca2+ current is observed (Fig. 2A). Cells fulfilling this criterion (140 out of the 203 cells included in this study) generate bursts of action potentials when exposed to intermediate glucose concentrations (Kanno et al. 2002). The remaining 63 cells contained a prominent Na+ current and were thus classified as non-β-cells. One subgroup of these cells exhibited a large TEA-resistant, rapidly activating K+ current when the membrane was stepped from −70 mV to 0 mV (Fig. 2C). This current inactivated spontaneously within ∼50 ms (see Fig. 10) and resembles the neuronal A current. We have previously established that glucagon-containing α-cells express Kv4.3 channels, voltage-gated K+ channels with pharmacological and electrophysiological characteristics very similar to those that can be recorded from α-cells (Conley, 1999). Cells containing Na+ and A currents have been found to generate action potentials in the absence of glucose, a feature also consistent with their identification as α-cells (Gopel et al. 2000a). Transient TEA-resistant A currents were seen in 15 of the 63 non-β-cells analysed but were never seen in β-cells.
Figure 2. Functional identification of mouse pancreatic α-, β- and δ-cells in intact mouse pancreatic islets.
A–C, membrane currents elicited by a 5-ms depolarization from −70 mV to 0 mV using a K+-containing intracellular solution and the standard extracellular solution supplemented with 20 mm TEA in a β-cell (A, only Ca2+ current), in a δ-cell (B, transient Na+ current and sustained Ca2+ current) and in an α-cell (C, transient inward current followed by TEA-resistant outward K+ current). The dotted line indicates the zero current level.
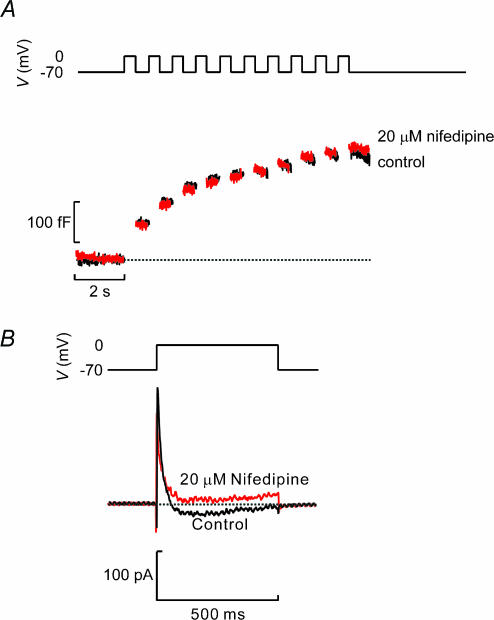
Figure 10. Glucagon secretion does not depend on Ca2+ influx through L-type Ca2+ channels.
A, capacitance increases (bottom) elicited by trains of 10 500-ms depolarizations (top) applied to β-cells in intact islets before and 2 min after addition of 25 μm nifedipine. B, voltage-gated membrane currents elicited by depolarization from −70 mV to 0 mV before and after inclusion of 25 μm nifedipine. Note that nifedipine blocked a sustained inward current whereas transient inward Na+ and outward A currents were unaffected.
The remaining 48 cells were classified as δ-cells because they had Na+ current but lacked the TEA-resistant K+ current and in these cells a sustained inward Ca2+ current persisted when the Na+ current had inactivated (Fig. 2B). Cells meeting these criteria are electrically silent in the absence of glucose but exhibit continuous action potential firing in the presence of 10 mm glucose (Gopel et al. 2000a). The tail current observed in the α-cells we attribute to the slow deactivation of the T-type Ca2+ and/or A-current present in glucagon-secreting cells (Gopel et al. 2000b). However, it is unlikely that the tail current seen in the α-cells (or in the β- and δ-cells) contributed to the exocytotic responses we describe here as any capacitance changes with rapid relaxation (<10 ms) were ignored.
Time course of depolarization-evoked exocytosis
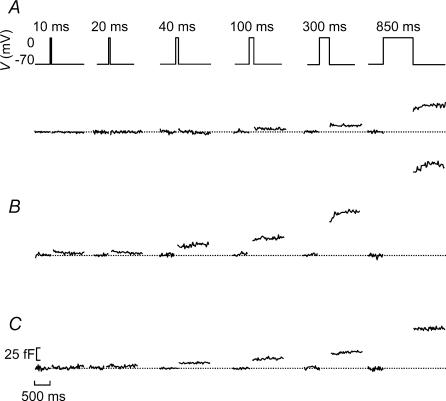
We next applied capacitance measurements to individual islet cells, functionally identified as outlined in Fig. 2, to determine their kinetics of exocytosis. It is not possible to monitor the time course of depolarization-evoked exocytosis during the actual pulses but it can be reconstructed by applying progressively longer depolarizations and measuring the resulting exocytotic responses. Figure 3 shows representative recordings of the increases in cell capacitance (ΔC) elicited by 10, 20, 40, 100, 300 and 850 ms depolarizations from −70 mV to 0 mV in insulin-producing β- (Fig. 3A), somatostatin-releasing δ- (Fig. 3B) and in glucagon-secreting α-cells (Fig. 3C). It can be seen that whereas depolarizations up to ≤ 40 ms failed to elicit exocytosis in the β-cells, such short depolarizations consistently evoked responses in both the α-cells and δ-cells.
Figure 3. Time course of exocytosis measured in intact pancreatic islets in functionally identified α-, β- and δ-cells.
A–C, capacitance increases elicited by progressively longer (duration indicated above schematic voltage trace) depolarizing commands from −70 mV to 0 mV in a β-cell (A), in a δ-cell (B) and in an α-cell (C). Cells were identified as outlined in Fig. 2 and traces are representative of 140 (A), 48 (B) and 15 (C) cells. The horizontal dotted lines show the prestimulatory capacitance level before each stimulus. The horizontal and vertical scale bars shown in C also apply to A and B.
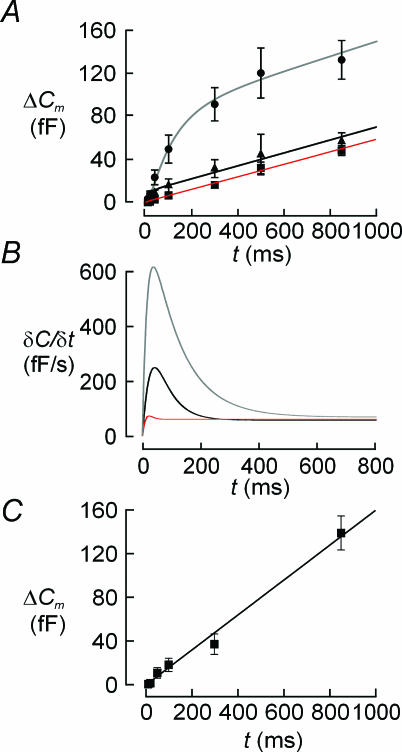
Figure 4A summarizes graphically the relationship between pulse duration (t) and the associated increase in cell capacitance (ΔCm) in 140 β-cells (▪), 48 δ-cells (•) and 15 α-cells (▴). Figure 4B depicts the time derivative of the functions approximated to the data points (see Methods). It is clear that exocytosis in glucagon-secreting α-cells followed a biphasic time course and that the early component lasts only ∼200 ms. The peak rate of exocytosis (measured 40 ms after the onset of the depolarization) amounted to ∼250 fF s−1 but the steady-state rate was only ∼60 fF s−1. Exocytosis in δ-cells was also biphasic and consisted of an early component lasting about 400 ms, peaking at > 600 fF s−1 after ∼40 ms. Once this component of secretion had been completed, exocytosis continued at a steady rate of 65 fF s−1.
Figure 4. Distinct release kinetics of α-, β-and δ-cells in intact islets.
A, relationships between pulse duration (t) and depolarization-evoked capacitance increases (ΔC) in pancreatic δ-cells (•), α-cells (▴) and β-cells (▪). Data are mean values ±s.e.m. recorded from 48 δ-cells, 15 α-cells and 140 β-cells. The curve superimposed on data points was derived by approximating eqn (3) in Barg et al. (2001) to the observed values. B, time course of exocytosis in δ-cells (top curve), α-cells (middle curve) and β-cells (lower curve) obtained by calculating the time derivative (δC/δt) of the continuous curves superimposed on data points in panel A. C, time course of exocytosis in the 14% of β-cells showing the largest exocytotic responses (n = 20).
Surprisingly, and in contrast to previous work on isolated β-cells (Barg et al. 2001), exocytosis in β-cells was monophasic and proceeded at a rate of ∼50 fF s−1 throughout the first 800 ms of depolarization. The β-cell data we now report are likely to be more representative of exocytosis in situ as the observed values include data from all cells that yielded technically acceptable recordings (high seal resistance and low series resistance), i.e. including also cells where depolarization failed to elicit significant exocytosis.
We considered the possibility that the discrepancy between the current data and the single-cell observations might be a consequence of a biased selection in the latter studies of cells with large exocytotic responses. We therefore selected the β-cells with the 14% largest exocytotic responses (20 out of 140 cells). However, as shown in Fig. 4C, the kinetics of exocytosis in these super-responsive cells was virtually identical to that obtained for the entire collection of β-cells. It is also conceivable that the large action potentials that might be elicited in the simultaneous presence of 5 mm glucose and TEA (Atwater et al. 1979; Henquin, 1990) with the resultant large cytoplasmic Ca2+ transients (Rorsman et al. 1992) could lead to depletion of the readily releasable pool prior to the commencement of the capacitance measurements. We tested this by inhibiting β-cell electrical activity using the KATP channel activator diazoxide (100 μm). In a series of 13 experiments, the kinetics of exocytosis measured in cells exposed to diazoxide was not different from that of untreated cells (not shown).
Exocytosis during repetitive stimulation
Electrical activity in β-cells consists of bursts of action potentials (Henquin & Meissner, 1984). Oscillatory electrical activity remains to be documented in α-cells but seems likely given that [Ca2+]i oscillates under experimental conditions associated with stimulated glucagon release (Berts et al. 1995; Nadal et al. 1999; Quesada et al. 1999). We next subjected α- and β-cells to repetitive stimulation consisting of 10 500-ms depolarizations going from −70 mV to 0 mV to determine how exocytosis may vary during such an oscillation. Figure 5A shows a representative response recorded from a β-cell. We calculated the increase per pulse in this and an additional 30 β-cells and the data are summarized in Fig. 5B. It can be seen that ΔCm peaked at a value of ∼50 fF during the second depolarization and subsequently decayed slowly towards lower values. The total increase in cell capacitance elicited by the train amounted to 270 ± 31 fF (n = 31).
In glucagon-secreting α-cells, the largest response was elicited by the first depolarization. In fact, only the initial three depolarizations were associated with any significant exocytotic responses and the second part of the train was largely ineffective (Fig. 5C and D). The total increase in cell capacitance elicited by the train amounted to 130 ± 36 fF (n = 4).
Exocytosis in β-cells during action potential-like stimulation
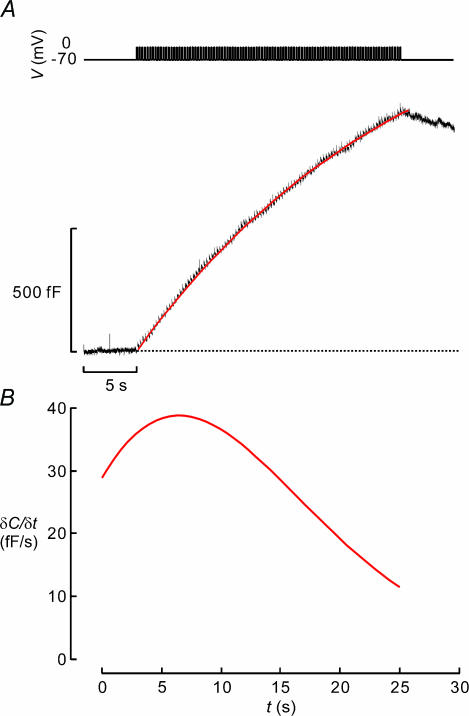
Exocytosis during individual pulses or trains of 500-ms depolarizations may have little to do with insulin secretion triggered by brief action potentials (50–100 ms) fired at a frequency of 4 Hz (Atwater et al. 1979). To monitor exocytosis during experimental conditions more similar to those occurring during electrical activity, β-cells in intact islets were stimulated with a train of 100 50-ms depolarizations from −70 mV to 0 mV applied at a frequency of 4 Hz (Fig. 6A, top). The capacitance trace shown in Fig. 6A (lower) is the averaged response of 16 cells. It can be seen that pulses as short as 50 ms were capable of eliciting exocytosis and that a substantial increase in cell capacitance (1100 ± 180 fF; n = 16) is produced by the entire train. Thus, the increase in membrane capacitance was 4-fold larger using this protocol than that observed in Fig. 5 although the total duration of the depolarizations was the same (5 s). This may suggest that action potential-like stimulation is a more effective stimulus of exocytosis in β-cells than long voltage-clamp depolarizations.
Figure 6. Exocytosis in β-cell elicited by action potential-like stimulation.
A, a β-cell was stimulated by a train of 50-ms depolarizations from −70 mV to 0 mV applied at a frequency of 4 Hz (top). Exocytosis was measured as a capacitance increases (ΔC, bottom). Data represent the average of 16 separate experiments. The continuous superimposed curve was derived by low-pass filtering the capacitance signal at 100 Hz and using the function of sigmoidal Weibull function (type-2). B, time derivative (δC/δt) of the continuous curve in A.
To illustrate how exocytosis varied with time during the train, a mathematical function was approximated to the data points (see legend to Fig. 6B for details). The time derivative of this function (δC/δt) is shown in Fig. 6B. It is clear that exocytosis reached a maximum of ∼40 fF s−1 and that the peak is attained ∼7 s after the onset of the train. The exocytotic rate then gradually declined towards 10 fF s−1. These values of δC/δt correspond to release rates of 14 granules s−1 and ∼3 granules s−1 using the conversion factor established by electron microscopy (∼3 fF per granule; Fig. 1).
Voltage dependence of exocytosis in the β-cell
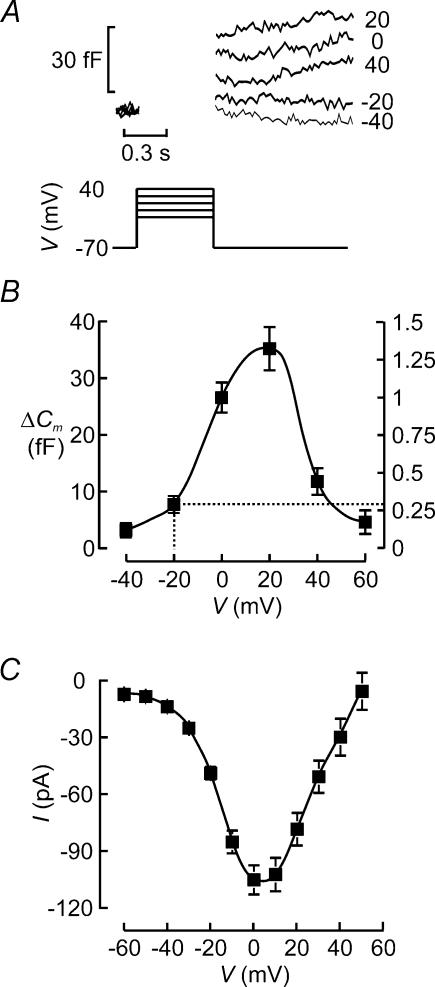
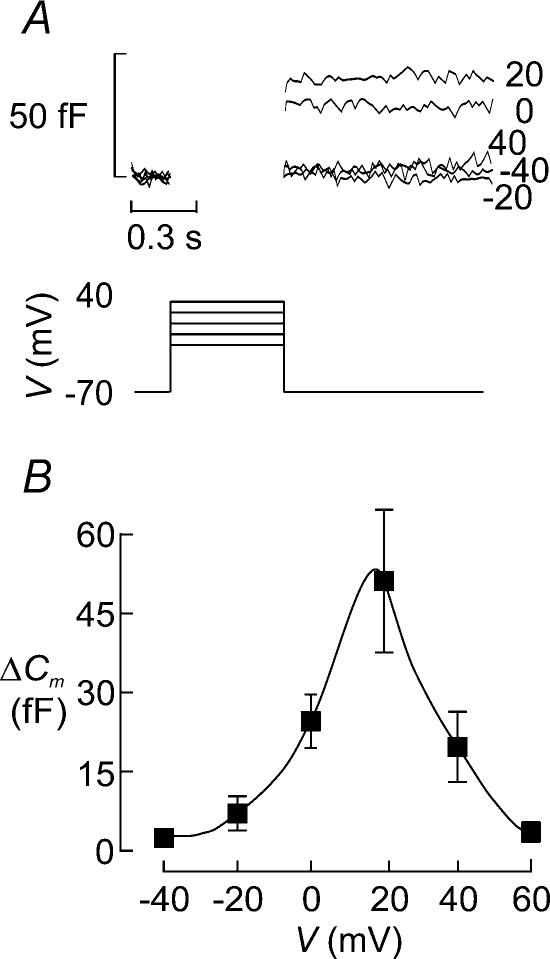
Insulin is released in a Ca2+-dependent fashion and exocytosis will therefore echo Ca2+ channel activity, which in turn is controlled by the membrane potential. Figure 7A shows changes in cell capacitance (ΔCm) elicited by 500-ms depolarizations from −70 mV to membrane potentials between −40 mV and +40 mV in a single β-cell within an intact mouse islets. The mean exocytotic responses in this and a further 31 cells are displayed against the voltage during the stimulus in Fig. 7B. It is clear that whereas depolarizations up to −20 mV elicited little exocytosis (<5 fF), depolarizations to 0 mV and +20 mV resulted in substantial increases in cell capacitance amounting to 25–35 fF. As expected, from the reduced driving force for Ca2+ into the β-cell, depolarizations to more positive voltages elicited smaller increases in cell capacitance. This voltage dependence of exocytosis in the β-cell is the same as that of the Ca2+ current (Fig. 7C) and is in close agreement with that observed previously in isolated cells (Ammala et al. 1993b). The latter finding reinforces the conclusion that cell coupling interferes little with the capacitance measurements from β-cells in intact islets (see Kanno et al. 2004).
Figure 7. Voltage dependence of exocytosis in β-cell.
A, capacitance increases (bottom) elicited by 500-ms depolarizations (top) from −70 mV to −40, −20, 0, +20 and +40 mV. The voltages during the depolarizations are indicated to the right of the respective capacitance traces. B, capacitance increase (ΔC) displayed against the voltage during the depolarizing pulses (V). Data are mean values ±s.e.m. of 32 experiments. The right hand axis indicates the exocytosis normalized to the response observed at 0 mV. The dotted lines indicate amplitude of exocytosis measured at −20 mV, which corresponds to the peak of the action potential (see Discussion). C, peak Ca2+ current amplitude (I) displayed against voltage during depolarization (V). Note that the current amplitude is maximal between 0 and +10 mV and that the current reverses at (+60 mV. Data are mean values ±s.e.m. of 20 experiments.
Voltage dependence of exocytosis in α-cells
We also analysed the voltage dependence of exocytosis in the glucagon-producing α-cells identified as described in Fig. 2. Figure 8A shows an experiment in which depolarizations went from −70 mV to voltages between −40 mV and +40 mV. The data obtained in a series of 10 experiments are summarized in Fig. 8B. It can be seen that the relationship between voltage and exocytosis is bell-shaped with a peak being observed during depolarizations to +20 mV. Because of the presence of an A current in the α-cell and the use of a K+-containing solution to allow the functional identification of the α-cell, it was not possible to directly correlate exocytosis to Ca2+-entry.
Figure 8. Membrane potential dependence of exocytosis in α-cells.
A, capacitance increases (bottom) elicited by 500-ms depolarizations (top) from −70 mV to −40, −20, 0, +20 and +40 mV. The voltages during the depolarizations are indicated to the right of the respective capacitance traces. B, capacitance increase (ΔC) displayed against the voltage during the depolarizing pulses (V). Data are mean values ±s.e.m. of 10 experiments.
L-type Ca2+ channels determine exocytosis in β-cells but not in α-cells
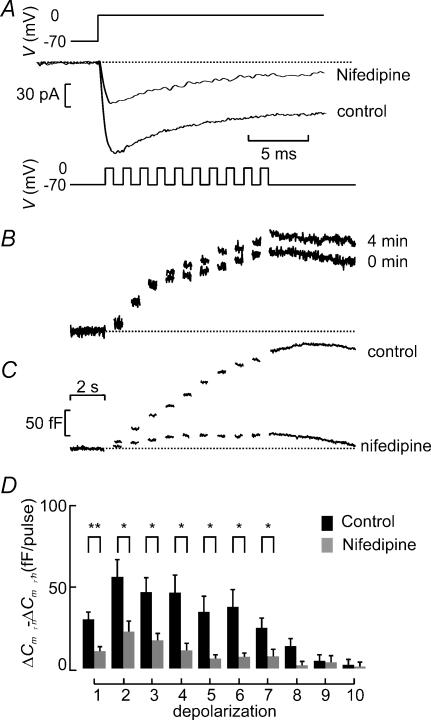
We next investigated the effects of Ca2+ channel blockade on exocytosis in β-cells. Figure 9A shows that 25 μm nifedipine blocks ∼50% of the whole-cell Ca2+ current elicited by a voltage-clamp depolarization from −70 mV to 0 mV. Under control conditions, the peak Ca2+ current averaged −160 ± 17 pA, which fell to −81 ± 10 pA (n = 10; P < 0.0005) after addition of nifedipine. The extent of inhibition is similar to that previously observed in single β-cells (Gilon et al. 1997). The failure of nifedipine to produce complete inhibition suggests, by analogy to what has previously demonstrated in isolated β-cells (Schulla et al. 2003), that L-type Ca2+ channels only account for about half the β-cell Ca2+ current. To analyse the effects of nifedipine on exocytosis, β-cells within intact islets were stimulated with three trains of 10 500-ms depolarizations (1 Hz). Under control conditions, exocytosis elicited by a train applied 4 min after the initial one was virtually identical to that evoked by the first train (Fig. 9B) and the increase in cell capacitance averaged 100 ± 19% (n = 16) of that observed initially. Thus, rundown of exocytosis is negligible over an observation period of 4 min despite intense and repetitive stimulation. Figure 9C compares the exocytotic responses in the absence and presence of 25 μm nifedipine. Figure 9D summarizes exocytosis in eight (control) and six (nifedipine) experiments. It is clear that nifedipine strongly inhibits exocytosis throughout the train of depolarizations. On average, nifedipine inhibited the capacitance increase elicited by the entire train by 61 ± 11% (n = 6; P < 0.01). The effects of the R-type Ca2+ channel blocker SNX482 (Newcomb et al. 1998) was tested in three cells but it did not detectably influence exocytosis; the total increase in cell capacitance elicited by the train in the presence of the blocker averaged 120 ± 24% of that observed prior to the addition of the blocker (not shown).
Figure 9. Suppression of β-cell exocytosis when Ca2+-entry following inhibition of L-type Ca2+ channels.
A, whole-cell Ca2+ currents (bottom) elicited by voltage-clamp depolarizations from −70 mV to 0 mV (top) in functionally identified β-cell under control conditions and after application of 25 μm nifedipine. B, capacitance increases (bottom) elicited by trains of 10 500-ms depolarizations (top) applied to the same β-cell in an intact islets shortly after establishment of the whole-cell configuration (0 min) and 4 min later. C, same as in B but records were obtained from a β-cell under control conditions (shortly after establishment of whole-cell mode) and 2 min after addition of 20 μm nifedipine. D, increase in cell capacitance per pulse (ΔCm,n−ΔCm,n−1) displayed against depolarization number under control conditions and in the presence of nifedipine. Data were obtained during second train applied to the cell both in the presence and absence of the antagonist and represent mean values ±s.e.m. of 8 (control) and 6 (nifedipine) experiments. *P < 0.05; **P < 0.01. Scale bars in C also apply to B.
We also analysed the role of L-type Ca2+ channels in α-cell exocytosis. As shown in Fig. 10A (lower), nifedipine (25 μm) had no effect on exocytosis in α-cells although the blocker abolished a sustained inward current (Fig. 10B).
Tonic inhibition of β-cell exocytosis in the intact islet?
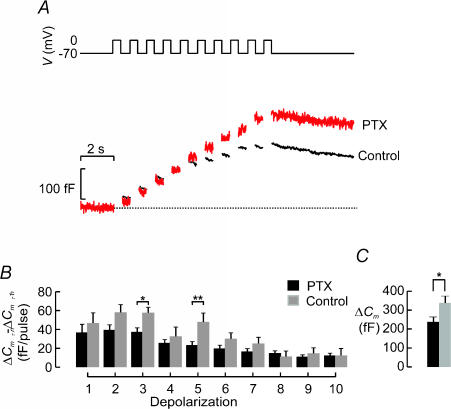
Exocytosis during the first 500 ms of depolarization to 0 mV is much smaller in the intact islet than we have previously observed in isolated cells. We considered the possibility that exocytosis in situ may be under tonic paracrine and autocrine inhibition by, for example, somatostatin released from δ-cells. The effects of somatostatin can be reversed by overnight pretreatment with pertussis toxin (formerly known as islet activating peptide) (Yajima et al. 1978). We therefore measured exocytosis in β-cells within intact islets, treated or not for >4 h with 100 ng ml−1 pertussis toxin. Figure 11A summarizes the capacitance increases elicited by a train of 10 500-ms depolarizations from −70 mV to 0 mV recorded in a control islet and an islet pretreated with PTX. The capacitance increase per pulse is shown in Fig. 11B. The responses elicited by the first five pulses were increased by 25–100% after pretreatment with pertussis toxin. However, the stimulation in response to pretreatment with pertussis toxin of the increase in cell capacitance evoked by the entire train was limited to 39% (Fig. 11C).
Figure 11. Tonic inhibition of exocytosis in β-cells in intact islets.
A, exocytosis (ΔCm) measured in response to a train consisting of 10 500-ms depolarizations (1 Hz) in functionally identified β-cells pretreated (PTX) or not (Control) for 12 h with 100 ng ml−1 pertussis toxin. B, increase in cell capacitance (ΔCm,n−ΔCm,n−1) per pulse displayed against depolarization number (n) under control conditions (black) and after pretreatment with pertussis toxin (grey). Data are mean values ±s.e.m. of 30 (control) and 12 (pertussis toxin) experiments. *P < 0.05.
Comparisons with biochemically determined hormone secretion
We compared β-cell exocytosis studied by recordings of cell capacitance with hormone release measurements (Table 1). An increase in glucose from a basal 1 mm to 20 mm stimulated insulin secretion 11-fold. This effect was inhibited by 80% after application of 20 μm nifedipine, in reasonable agreement with the suppression observed in the capacitance measurements (60%; Fig. 9C and D). The R-type Ca2+ channel blocker SNX482 only marginally affected glucose-stimulated insulin secretion. In accordance with previous observations and supporting the idea that the β-cells may be tonically inhibited in the intact islet, pretreatment of islets with pertussis toxin (100 ng ml−1 for ≥4 h) increased both basal and glucose-stimulated insulin secretion ∼2-fold.
Table 1.
Effects of pertussis toxin and Ca2+ channel blockers on insulin secretion
| Insulin secretion (ng islet−1h−1) | |||
|---|---|---|---|
| Line | Experimental condition | 1 mm glucose | 20 mm glucose |
| 1 | — | 0.22 ± 0.03 (8) | 2.59 ± 0.21 (10)* |
| 2 | 20 μm nifedipine | 0.24 ± 0.05 (8) | 0.70 ± 0.08 (10)*,a |
| 3 | 100 nm SNX482 | 0.26 ± 0.03 (8) | 2.33 ± 0.24 (10)* |
| 4 | Overnight culture | 0.39 ± 0.05 (10) | 2.12 ± 0.21 (12)* |
| 5 | Overnight pretreatment with 100 ng ml−1 pertussis toxin | 0.62 ± 0.08 (10)b | 5.28 ± 0.14(12)*,c |
Data are mean values ±s.e.m. of indicated number of experiments (n).
P < 0.001 versus 1 mm glucose under same experimental conditions (comparison within same line);
P < 0.001 versus 20 mm glucose (line 1);
P < 0.005 versus 1 mm glucose (line 4);
P < 0.001 versus 20 mm glucose (line 4).
Glucagon secretion from intact islets measured at 1 mm glucose was unaffected by nifedipine but was inhibited by ω-conotoxin to the same extent as that obtained in response to elevating glucose to 20 mm (Table 2). In the presence of 20 mm glucose, the effects of both Ca2+ channel blockers were marginal. Pretreatment of pertussis toxin increased glucagon secretion 2-fold at both low and high glucose.
Table 2.
Effects of pertussis toxin and Ca2+ channel blockers on glucagon secretion
| Glucagon secretion (pg islet−1 h−1) | |||
|---|---|---|---|
| Line | Experimental condition | 1 mm glucose | 20 mm glucose |
| 1 | — | 30.7 ± 1.2 (8) | 19.8 ± 1.8 (10)* |
| 2 | 20 μm nifedipine | 27.9 ± 1.4 (8) | 21.4 ± 2.1 (10)** |
| 3 | 100 nmω-conotoxin GVIA | 18.1 ± 2.2 (8)† | 16.7 ± 1.4 (10) |
| 4 | Overnight culture | 24.2 ± 2.4 (10) | 10.1 ± 0.60 (10)* |
| 5 | Overnight pretreatment with 100 ng ml−1 pertussis toxin | 55.0 ± 7.0 (10)‡ | 22.7 ± 2.4 (12)*,‡ |
Data are mean values ±s.e.m. of indicated number of experiments (n).
P < 0.005 versus 1 mm glucose under same experimental conditions (comparison within same line);
P < 0.05 versus 1 mm glucose + nifedipine (same line);
P < 0.005 versus 1 mm glucose (line 1);
P < 0.001 versus release measured in islets cultured overnight but not exposed to pertussis toxin.
Discussion
Capacitance measurements represent a versatile tool to study exocytosis down to the single-vesicle level at millisecond resolution (Neher, 1998). In general, exocytosis in β-cells monitored as increases in cell capacitance conforms to the properties of insulin secretion established by biochemical assays (Rorsman, 1997; Rorsman et al. 2000). Several features suggest that an increase in cell capacitance under most conditions can be equated to secretion: (1) both techniques indicate that exocytosis is a Ca2+-dependent process triggered by Ca2+ entry through the voltage-gated ion channels (Ammala et al. 1993b); (2) compounds that activate protein kinases A and C enhance secretion detected by either method (Ammala et al. 1993a 1994); (3) adrenaline, galanin and somatostatin inhibit exocytosis equally irrespective of whether it is detected as an increase in cell capacitance or as hormone release measured by biochemical assays (Renstrom et al. 1996a); (4) insulin secretion and exocytosis monitored as increases in cell capacitance are similarly affected by lowering the temperature (Renstrom et al. 1996b); and (5) increases in cell capacitance echo electrochemical (Smith et al. 1999) and fluorimetric detection of secretion (Bokvist et al. 1995; Barg et al. 2002). On the other hand, the amplitude of the capacitance changes are sometimes surprisingly large (up to 1 pF) and take place in a few hundred milliseconds, as if the cells were capable of releasing nearly all docked granules very rapidly (Ammala et al. 1993b; Barg et al. 2001). This has raised disquiet among investigators. Indeed, similarly large increases in cell capacitance can be elicited in cells that are generally believed to be non-secretory, such as Chinese hamster ovary (CHO) or 3T3 fibroblasts and were then not attributed to exocytosis but insertion of plasma membrane by fusion of a special organelle termed the enlargosome (Borgonovo et al. 2002).
Here we demonstrate that three types of exocytotic behaviour can be discerned in cells functionally characterized as insulin-secreting β-cells, glucagon-producing α-cells and somatostatin-releasing δ-cells. These represent the first measurements of exocytosis in α- and β-cells in freshly isolated intact islets and the first recordings of exocytosis in δ-cells altogether. We demonstrate that important differences exist between the exocytotic properties of individual β-cells maintained in tissue culture and those we now observe in freshly isolated intact islets. Finally, we attempt to correlate the capacitance measurements to the rate of insulin secretion established by biochemical measurements.
The somatostatin-secreting δ-cells are capable of rapid exocytosis
Of the three types of endocrine islet cell, the δ-cells were exceptional in exhibiting a prominent early component of capacitance increase that was completed within <350 ms. The secretory granules belonging to this pool underwent exocytosis with little latency (10–40 ms), thus giving rise to a rapid component of capacitance increase with ultrafast kinetics (600 fF s−1). The latter rate of capacitance increase corresponds to ∼550 granules s−1. The high speed of exocytosis (40 times higher than that observed in β-cells) and prompt initiation in δ-cells suggest that at least some of the granules must be situated in the immediate vicinity of the Ca2+ channels. However, it can be seen that exocytosis in δ-cells differs from that in α- and β-cells in continuing after the depolarization (Fig. 3B), raising the interesting possibility that exocytosis in δ-cells depends on processes other than just Ca2+ influx through plasmalemmal Ca2+ channels. The latter aspect will be considered in a subsequent paper (Q. Zhang, S. Göpel, E. Renström, A. Salehi, T. Schneider & P. Rorsman, in preparation).
Exocytosis in the glucagon-producing α-cell
The exocytotic properties of isolated rat and mouse glucagon-producing α-cells have previously been characterized in some detail (Gromada et al. 1997; Barg et al. 2000; Gromada et al. 2001). The protocols used in this study did not allow us to characterize the α-cell Ca2+ current as it was obscured by a rapidly developing transient outward K+ current (A current) but we have previously demonstrated that α-cells are equipped with both low voltage-activated (LVA or T-type) as well as high voltage-activated (HVA) Ca2+ channels (Gopel et al. 2000b). The finding that exocytosis at voltages below −20 mV is negligible argues that T-type Ca2+ channels are not responsible for the Ca2+-entry required for exocytosis. In the absence of glucose, the glucagon-producing α-cells generate Na+-dependent action potentials that extend to +20 mV. It is therefore of interest that exocytosis in the α-cells exhibits a distinct peak at membrane potentials around +20 mV. It is implicit from this that processes influencing spike height will have dramatic repercussions on glucagon release. This might contribute to the ability of glucose to suppress glucagon secretion. Glucose-induced inhibition of the α-cell KATP channels with resultant (partial) inactivation of the Na+ channels can accordingly be envisaged to result in action potentials that do not extend into the range of voltages required to trigger α-cell exocytosis (Gopel et al. 2000b).
The identity of the HVA Ca2+ channels underlying glucagon secretion from intact islets remains to be documented electrophysiologically. However, the ability of ω-conotoxin to block glucagon secretion and the lack of effects of nifedipine in the absence of agents increasing cyclic AMP suggest that Ca2+ entry through ω-conotoxin-sensitive N-type Ca2+ channels is particularly important for secretion under basal conditions (1 mm glucose). A similar picture has emanated from single-cell measurements (Gromada et al. 1997; Gromada et al. 2001). The importance of N-type Ca2+ channels for glucagon secretion is underscored by the finding that application of ω-conotoxin inhibits glucagon secretion to the same extent as elevating glucose from 1 to 20 mm (Table 2). It should be emphasized that the high sensitivity of glucagon secretion to ω-conotoxin and lack of effects of nifedipine are features of glucagon secretion in the absence of agents increasing intracellular cAMP levels. In rat α-cells, L-type Ca2+ channels are the principal conduit of Ca2+ entry in the presence of the adenylate cyclase activator forskolin (Gromada et al. 1997) and recent data suggest that this also applies to mouse α-cells (L. Eliasson & P. Rorsman, in preparation). The observation that nifedipine failed to affect both exocytosis in α-cells and glucagon secretion from intact islets therefore indicates that intracellular cAMP levels in α-cells are too low under basal conditions to activate the L-type Ca2+ channel-dependent pathway of exocytosis/glucagon secretion. Curiously, the experiment shown in Fig. 10 was performed with cAMP added to the pipette solution dialysing the cell interior. This suggests that the rearrangement of the islet architecture necessary to bring the L-type Ca2+ channels into action are disrupted following the establishment of the standard whole-cell configuration and only operate in the intact α-cell.
Unlike the β-cells, the α-cells exhibited strong depression of exocytosis during repetitive stimulation (Fig. 5C and D). This argues that exocytosis in the α-cell is designed to allow bouts of glucagon secretion for short periods of, for example, heavy exercise or stress but that it has limited capacity to maintain a high level of secretion for extended periods. This is fully in line with the notion that glucagon constitutes the first line defence against hypoglycaemia, whereas other hormones, such as adrenaline, become more important during long-term hypoglycaemia (Gerich, 1988). Conversely, the absence of depression in β-cells argues that they are designed to be tonically active and they are able to balance the depletion of the readily releasable pool by continuous supply of new granules from a large reserve pool of granules (Rorsman et al. 2000).
Low rate of exocytosis in β-cells in situ
Exocytosis in β-cells situated in intact islets is much slower than previously documented in isolated β-cells (compare Fig. 4B with Fig. 3 of Barg et al. 2001). Whereas exocytosis in single β-cells might attain rates as high as 1 pF s−1, the corresponding value measured in situ was only 40 fF s−1 (Fig. 6B). We acknowledge that our measurements for technical reasons were confined to superficial cells (top 1–2 cell layers) and it is possible that the low rate of exocytosis we observe in β-cells in the intact islets is a reflection of an abnormally strong paracrine inhibition by somatostatin released from neighbouring cells. We therefore considered the possibility that insulin secretion in the intact islet may be reduced due to tonic paracrine inhibition. However, although pretreatment with pertussis toxin (which abolishes the inhibitory action of many inhibitors including the islet hormone somatostatin; Renstrom et al. 1996a) did indeed stimulate exocytosis in the β-cell, the effect was moderate and did not restore exocytosis to the rates observed in isolated cells. The elucidation of the mechanisms leading to the suppression of exocytosis in the intact islet might provide valuable insights in factors modulating secretion in the islet. It is conceivable that the β-cell itself regulates its release via autocrine mechanisms, possibly mediated by insulin itself (Persaud et al. 2002) or other products released by the β-cell. In addition, the changes in β-cell architecture that are likely to result when the islet is disrupted and the cells adhere to an artificial surface (the glass of the coverslip or the plastic of the Petri dish) might affect β-cell exocytosis. Whatever the reason for the slow rate of capacitance increase in intact islets, it is the whole-islet data that should be used when attempting to correlate exocytosis (measured by capacitance measurements) to biochemically determined rates of insulin release.
Speed of exocytosis in β-cells in situ: comparison with insulin secretion
The access to information on the rate of exocytosis in β-cells in intact islets allows us to more directly correlate changes in cell capacitance to reported rates of insulin secretion. We report here that during a train of membrane depolarizations to 0 mV, β-cell exocytosis measured in intact islets reaches a peak rate of 14 granules s−1 (40 fF s−1). The latter value is ∼50-fold higher than the peak rate of secretion measured during 1st phase glucose-induced insulin release (0.3 granules s−1) (Bratanova-Tochkova et al. 2002). However, exocytosis is steeply voltage dependent (Fig. 7). This is significant because the β-cell action potential characteristically peaks at −20 mV (Atwater et al. 1979). The amplitude of the exocytotic responses measured at −20 mV is only <30% of that elicited by a pulse to 0 mV (see dotted line in Fig. 7B). We thereby estimate that the peak rate of capacitance increase during a β-cell action potential is ∼4 granules s−1. When allowance is made for the fact that the present experiments were done in the presence of intracellular cAMP, which is a strong stimulus of insulin secretion (Eddlestone et al. 1985) and stimulates exocytosis 10-fold (Eliasson et al. 2003), there is an even better match between the rates of secretion reported by electrophysiological and biochemical methods. Indeed, a recent study carried out on β-cells in thin slices of pancreatic tissue indicates that the rate of release in the absence of cAMP during a train of depolarizations to +10 mV is 3 granules s−1 (Speier & Rupnik, 2003). Given that exocytosis at +10 mV is 5-fold larger than at −20 mV (Fig. 7B), the above value corresponds to ∼0.6 granules s−1. Collectively, these consideration show that the exocytosis measured by capacitance measurements proceeds at velocities comparable to those determined by radioimmunosassays.
Functional pool of secretory granules in β-cells within intact islets
We and others have proposed that sequential release of distinct (functional) pools of granules may underlie the biphasic nature of glucose-induced insulin secretion (Rorsman et al. 2000; Bratanova et al. 2002). This concept is not new and was first formulated in the early 1970s (Grodsky et al. 1970; Grodsky, 1972) but the finding that the secretory granules in isolated β-cells (by analogy to the situation in nerve terminals as well as other neuroendocrine cells) belong to a limited (<1%) readily releasable pool (RRP) and a much larger (99%) reserve pool (Eliasson et al. 1997) taken together with the observation that in clonal insulin-secreting cells, first phase insulin secretion was associated with the depletion of a pool of granules biochemically docked with the plasma membrane (Daniel et al. 1999), led to renewed interest in this hypothesis that there is a relationship between functional pools of secretory granules and the different phases of insulin secretion. The observation that intense stimulation of β-cells in intact islets with high K+ resulted in 30% reduction of the number of docked granules (Olofsson et al. 2002) is consistent with this idea. In single cells, release of RRP and reserve granules give rise to two temporally resolved components of capacitance increase. Contrary to our expectations, the two exocytotic components were much less apparent in β-cells in situ than previously documented in isolated β-cells (compare Fig. 4 with Fig. 3 of Barg et al. 2001). In fact, exocytosis was linearly related to the duration of the stimulation for depolarizations ≤850 ms with little sign of depression (i.e. a reduction of the secretory capacity) even following intense and repetitive stimulation (Fig. 5). Some evidence for granule pools with variable release competence can be obtained from the experiments involving action potential-like stimulation protocols (Fig. 6) where the maximum rate of secretion was attained 7 s after the onset of the stimulation and subsequently decayed towards a lower rate. It is also conceivable that the in vivo situation is paradoxically more similar to the single-cell behaviour and that the loss of the normal nervous and hormonal regulation leads to artefactual depletion of the readily releasable pool of granules with resultant suppression of a fast component of secretion. Indeed, genetic ablation of the Cav1.2 L-type Ca2+ channel, which is coupled to rapid depolarization-evoked exocytosis (Barg et al. 2001), abolishes a rapid component of capacitance increase and results in the loss of first phase insulin secretion and impaired systemic glucose tolerance (Schulla et al. 2003). It is therefore premature to conclude that observations made in isolated β-cells are physiologically irrelevant but the relationship between different components of capacitance increase and phasic insulin secretion is more complex than suggested by the single-cell work.
Concluding remarks
We demonstrate here that it is feasible to apply capacitance measurements to islet cells in intact islets. Using this method it should be possible to dissect the molecular regulation of exocytosis in primary β-cells (including human β-cells) in intact islets. Such data should be more representative of the intact tissue as both the normal cell architecture as well as cell–cell interactions are maintained. Applying capacitance measurements to intact islets has the additional advantage that it is possible to exploit the existing knowledge base when designing new experiments and to correlate the data thus obtained to other functional parameters such as metabolism, electrical activity, secretion and ultrastructure.
We have previously demonstrated that electrical activity, ion channel densities and regulation differ significantly between isolated β-cells and β-cells within the intact tissue (Gopel et al. 1999b). The present observation that β-cell exocytosis in situ is likewise very different from that previously determined in isolated cells provides yet another illustration of the potential pitfalls associated with the application of single-cell measurements to explain the complex behaviour of intact tissues.
Acknowledgments
This study was supported by the Juvenile Diabetes Research Foundation, the Swedish Research Council (grants 8647, 12234 and 13147), the Swedish Diabetes Association, the Novo Nordisk Foundation and The Göran Gustafsson Foundation for Research in Natural Sciences and Medicine. S.G. was supported by a fellowship from the Swedish Society for Medical Research during the initial stages of the project. T.K.'s stay at Lund University was supported by Hirosaki University, Japan.
References
- Ammala C, Ashcroft FM, Rorsman P. Calcium-independent potentiation of insulin release by cyclic AMP in single β-cells. Nature. 1993a;363:356–358. doi: 10.1038/363356a0. [DOI] [PubMed] [Google Scholar]
- Ammala C, Eliasson L, Bokvist K, Berggren PO, Honkanen RE, Sjoholm A, et al. Activation of protein kinases and inhibition of protein phosphatases play a central role in the regulation of exocytosis in mouse pancreatic β cells. Proc Natl Acad Sci U S A. 1994;91:4343–4347. doi: 10.1073/pnas.91.10.4343. [DOI] [PMC free article] [PubMed] [Google Scholar]
- Ammala C, Eliasson L, Bokvist K, Larsson O, Ashcroft FM, Rorsman P. Exocytosis elicited by action potentials and voltage-clamp calcium currents in individual mouse pancreatic B-cells. J Physiol. 1993b;472:665–688. doi: 10.1113/jphysiol.1993.sp019966. [DOI] [PMC free article] [PubMed] [Google Scholar]
- Ashcroft FM, Rorsman P. Elecrophysiology of pancreatic islet cells. In: Scherübl HH, Hescheler J, editors. The Electrophysiology of Neuroendocrine Cells. Boca Raton, FL, USA: CRC Press; 1995. pp. 207–243. [Google Scholar]
- Atwater I, Ribalet B, Rojas E. Mouse pancreatic β-cells: tetraethylammonium blockage of the potassium permeability increase induced by depolarization. J Physiol. 1979;288:561–574. [PMC free article] [PubMed] [Google Scholar]
- Barg S, Galvanovskis J, Gopel SO, Rorsman P, Eliasson L. Tight coupling between electrical activity and exocytosis in mouse glucagon-secreting α-cells. Diabetes. 2000;49:1500–1510. doi: 10.2337/diabetes.49.9.1500. [DOI] [PubMed] [Google Scholar]
- Barg S, Ma X, Eliasson L, Galvanovskis J, Gopel SO, Obermuller S, et al. Fast exocytosis with few Ca2+ channels in insulin-secreting mouse pancreatic B cells. Biophys J. 2001;81:3308–3323. doi: 10.1016/S0006-3495(01)75964-4. [DOI] [PMC free article] [PubMed] [Google Scholar]
- Barg S, Olofsson CS, Schriever-Abeln J, Wendt A, Gebre-Medhin S, Renstrom E, et al. Delay between fusion pore opening and peptide release from large dense-core vesicles in neuroendocrine cells. Neuron. 2002;33:287–299. doi: 10.1016/s0896-6273(02)00563-9. [DOI] [PubMed] [Google Scholar]
- Berts A, Gylfe E, Hellman B. Ca2+ oscillations in pancreatic islet cells secreting glucagon and somatostatin. Biochem Biophys Res Commun. 1995;208:644–649. doi: 10.1006/bbrc.1995.1387. [DOI] [PubMed] [Google Scholar]
- Bokvist K, Eliasson L, Ammala C, Renstrom E, Rorsman P. Co-localization of L-type Ca2+ channels and insulin-containing secretory granules and its significance for the initiation of exocytosis in mouse pancreatic B-cells. EMBO J. 1995;14:50–57. doi: 10.1002/j.1460-2075.1995.tb06974.x. [DOI] [PMC free article] [PubMed] [Google Scholar]
- Borgonovo B, Cocucci E, Racchetti G, Podini P, Bachi A, Meldolesi J. Regulated exocytosis: a novel, widely expressed system. Nat Cell Biol. 2002;4:955–963. doi: 10.1038/ncb888. [DOI] [PubMed] [Google Scholar]
- Bratanova-Tochkova TK, Cheng H, Daniel S, Gunawardana S, Liu YJ, Mulvaney-Musa J, et al. Triggering and augmentation mechanisms, granule pools, and biphasic insulin secretion. Diabetes. 2002;51:S83–S90. doi: 10.2337/diabetes.51.2007.s83. [DOI] [PubMed] [Google Scholar]
- Conley EC. VLH Kv4-Shal. In: Conley EC, Brammar WJ, editors. The Ion Channels Facts Book: Voltage-Gated Channels. San Diego: Academic Press; 1999. pp. 617–646. [Google Scholar]
- Daniel S, Noda M, Straub SG, Sharp GW. Identification of the docked granule pool responsible for the first phase of glucose-stimulated insulin secretion. Diabetes. 1999;48:1686–1690. doi: 10.2337/diabetes.48.9.1686. [DOI] [PubMed] [Google Scholar]
- Eddlestone GT, Oldham SB, Lipson LG, Premdas FH, Beigelman PM. Electrical activity, cAMP concentration, and insulin release in mouse islets of Langerhans. Am J Physiol. 1985;248:C145–C153. doi: 10.1152/ajpcell.1985.248.1.C145. [DOI] [PubMed] [Google Scholar]
- Eliasson L, Ma X, Renstrom E, Barg S, Berggren PO, Galvanovskis J, et al. SUR1 regulates PKA-independent cAMP-induced granule priming in mouse pancreatic B-cells. J General Physiol. 2003;121:181–197. doi: 10.1085/jgp.20028707. [DOI] [PMC free article] [PubMed] [Google Scholar]
- Eliasson L, Proks P, Ammala C, Ashcroft FM, Bokvist K, Renstrom E, Rorsman P, Smith PA. Endocytosis of secretory granules in mouse pancreatic β-cells evoked by transient elevation of cytosolic calcium. J Physiol. 1996;493:755–767. doi: 10.1113/jphysiol.1996.sp021420. [DOI] [PMC free article] [PubMed] [Google Scholar]
- Garcia-Barrado MJ, Jonas JC, Gilon P, Henquin JC. Sulphonylureas do not increase insulin secretion by a mechanism other than a rise in cytoplasmic Ca2+ in pancreatic B-cells. Eur J Pharmacol. 1996;298:279–286. doi: 10.1016/0014-2999(95)00806-3. [DOI] [PubMed] [Google Scholar]
- Gerich JE. Lilly lecture 1988. Glucose counterregulation and its impact on diabetes mellitus. Diabetes. 1988;37:1608–1617. doi: 10.2337/diab.37.12.1608. [DOI] [PubMed] [Google Scholar]
- Gillis KD. Techniques for membrane capacitance measurements. In: Sakmann B, Neher E, editors. Single-Channel Recording. 2nd edn. New York and London: Plenum Press; 1995. pp. 155–198. [Google Scholar]
- Gillis KD, Misler S. Single cell assay of exocytosis from pancreatic islet B cells. Pflugers Arch. 1992;420:121–123. doi: 10.1007/BF00378654. [DOI] [PubMed] [Google Scholar]
- Gilon P, Yakel J, Gromada J, Zhu Y, Henquin JC, Rorsman P. G protein-dependent inhibition of L-type Ca2+ currents by acetylcholine in mouse pancreatic B-cells. J Physiol. 1997;499:65–76. doi: 10.1113/jphysiol.1997.sp021911. [DOI] [PMC free article] [PubMed] [Google Scholar]
- Gopel SO, Kanno T, Barg S, Eliasson L, Galvanovskis J, Renstrom E, et al. Activation of Ca2+-dependent K+ channels contributes to rhythmic firing of action potentials in mouse pancreatic β cells. J General Physiol. 1999b;114:759–770. doi: 10.1085/jgp.114.6.759. [DOI] [PMC free article] [PubMed] [Google Scholar]
- Gopel S, Kanno T, Barg S, Galvanovskis J, Rorsman P. Voltage-gated and resting membrane currents recorded from B-cells in intact mouse pancreatic islets. J Physiol. 1999a;521:717–728. doi: 10.1111/j.1469-7793.1999.00717.x. [DOI] [PMC free article] [PubMed] [Google Scholar]
- Gopel SO, Kanno T, Barg S, Rorsman P. Patch-clamp characterisation of somatostatin-secreting δ-cells in intact mouse pancreatic islets. J Physiol. 2000a;528:497–507. doi: 10.1111/j.1469-7793.2000.00497.x. [DOI] [PMC free article] [PubMed] [Google Scholar]
- Gopel SO, Kanno T, Barg S, Weng XG, Gromada J, Rorsman P. Regulation of glucagon release in mouse α-cells by KATP channels and inactivation of TTX-sensitive Na+ channels. J Physiol. 2000b;528:509–520. doi: 10.1111/j.1469-7793.2000.00509.x. [DOI] [PMC free article] [PubMed] [Google Scholar]
- Grodsky GM. A threshold distribution hypothesis for packet storage of insulin. II. Effect of calcium. Diabetes. 1972;21:584–593. doi: 10.2337/diab.21.2.s584. [DOI] [PubMed] [Google Scholar]
- Grodsky G, Landahl H, Curry D, Bennett L. A two-compartmental model for insulin secretion. Adv Metab Disord. 1970;1:45–50. [PubMed] [Google Scholar]
- Gromada J, Bokvist K, Ding WG, Barg S, Buschard K, Renstrom E, et al. Adrenaline stimulates glucagon secretion in pancreatic A-cells by increasing the Ca2+ current and the number of granules close to the L-type Ca2+ channels. J General Physiol. 1997;110:217–228. doi: 10.1085/jgp.110.3.217. [DOI] [PMC free article] [PubMed] [Google Scholar]
- Gromada J, Hoy M, Buschard K, Salehi A, Rorsman P. Somatostatin inhibits exocytosis in rat pancreatic alpha-cells by Gi2-dependent activation of calcineurin and depriming of secretory granules. J Physiol. 2001;535:519–532. doi: 10.1111/j.1469-7793.2001.00519.x. [DOI] [PMC free article] [PubMed] [Google Scholar]
- Henquin JC. Glucose-induced electrical activity in β-cells. Feedback control of ATP-sensitive K+ channels by Ca2+? Diabetes. 1990;39:1457–1460. doi: 10.2337/diab.39.11.1457. [DOI] [PubMed] [Google Scholar]
- Henquin JC, Meissner HP. Significance of ionic fluxes and changes in membrane potential for stimulus-secretion coupling in pancreatic B-cells. Experientia. 1984;40:1043–1052. doi: 10.1007/BF01971450. [DOI] [PubMed] [Google Scholar]
- Kanno T, Ma X, Barg S, Eliasson L, Galvanovskis J, Göpel S, et al. Large dense-core vesicle exocytosis in pancreatic β-cells monitored by capacitance measurements. Methods. 2004 doi: 10.1016/j.ymeth.2004.01.003. (in press) [DOI] [PubMed] [Google Scholar]
- Kanno T, Rorsman P, Gopel SO. Glucose-dependent regulation of rhythmic action potential firing in pancreatic β-cells by KATP-channel modulation. J Physiol. 2002;545:501–507. doi: 10.1113/jphysiol.2002.031344. [DOI] [PMC free article] [PubMed] [Google Scholar]
- Mariot P, Gilon P, Nenquin M, Henquin JC. Tolbutamide and diazoxide influence insulin secretion by changing the concentration but not the action of cytoplasmic Ca2+ in β-cells. Diabetes. 1998;47:365–373. doi: 10.2337/diabetes.47.3.365. [DOI] [PubMed] [Google Scholar]
- Moser T, Neher E. Rapid exocytosis in single chromaffin cells recorded from mouse adrenal slices. J Neurosci. 1997;17:2314–2323. doi: 10.1523/JNEUROSCI.17-07-02314.1997. [DOI] [PMC free article] [PubMed] [Google Scholar]
- Nadal A, Quesada I, Soria B. Homologous and heterologous asynchronicity between identified α-, β- and δ-cells within intact islets of Langerhans in the mouse. J Physiol. 1999;517:85–93. doi: 10.1111/j.1469-7793.1999.0085z.x. [DOI] [PMC free article] [PubMed] [Google Scholar]
- Neher E. Vesicle pools and Ca2+ microdomains: new tools for understanding their roles in neurotransmitter release. Neuron. 1998;20:389–399. doi: 10.1016/s0896-6273(00)80983-6. [DOI] [PubMed] [Google Scholar]
- Newcomb R, Szoke B, Palma A, Wang G, Chen X, Hopkins W, et al. Selective peptide antagonist of the class E calcium channel from the venom of the tarantula Hysterocrates gigas. Biochemistry. 1998;37:15353–15362. doi: 10.1021/bi981255g. [DOI] [PubMed] [Google Scholar]
- Olofsson CS, Gopel SO, Barg S, Galvanovskis J, Ma X, Salehi A, et al. Fast insulin secretion reflects exocytosis of docked granules in mouse pancreatic B-cells. Pflugers Arch. 2002;444:43–51. doi: 10.1007/s00424-002-0781-5. [DOI] [PubMed] [Google Scholar]
- Persaud SJ, Asare-Anane H, Jones PM. Insulin receptor activation inhibits insulin secretion from human islets of Langerhans. FEBS Lett. 2002;510:225–228. doi: 10.1016/s0014-5793(01)03268-9. [DOI] [PubMed] [Google Scholar]
- Pipeleers D, in't Veld PI, Maes E, Van De Winkel M. Glucose-induced insulin release depends on functional cooperation between islet cells. Proc Natl Acad Sci U S A. 1982;79:7322–7325. doi: 10.1073/pnas.79.23.7322. [DOI] [PMC free article] [PubMed] [Google Scholar]
- Quesada I, Nadal A, Soria B. Different effects of tolbutamide and diazoxide in α-, β-, and δ-cells within intact islets of Langerhans. Diabetes. 1999;48:2390–2397. doi: 10.2337/diabetes.48.12.2390. [DOI] [PubMed] [Google Scholar]
- Renstrom E, Ding WG, Bokvist K, Rorsman P. Neurotransmitter-induced inhibition of exocytosis in insulin-secreting β cells by activation of calcineurin. Neuron. 1996a;17:513–522. doi: 10.1016/s0896-6273(00)80183-x. [DOI] [PubMed] [Google Scholar]
- Renstrom E, Eliasson L, Bokvist K, Rorsman P. Cooling inhibits exocytosis in single mouse pancreatic B-cells by suppression of granule mobilization. J Physiol. 1996b;494:41–52. doi: 10.1113/jphysiol.1996.sp021474. [DOI] [PMC free article] [PubMed] [Google Scholar]
- Rorsman P. The pancreatic β-cell as a fuel sensor: an electrophysiologist's viewpoint. Diabetologia. 1997;40:487–495. doi: 10.1007/s001250050706. [DOI] [PubMed] [Google Scholar]
- Rorsman P, Ammala C, Berggren PO, Bokvist K, Larsson O. Cytoplasmic calcium transients due to single action potentials and voltage-clamp depolarizations in mouse pancreatic B-cells. EMBO J. 1992;11:2877–2884. doi: 10.1002/j.1460-2075.1992.tb05356.x. [DOI] [PMC free article] [PubMed] [Google Scholar]
- Rorsman P, Eliasson L, Renstrom E, Gromada J, Barg S, Gopel S. The cell physiology of biphasic insulin secretion. News Physiol Sci. 2000;15:72–77. doi: 10.1152/physiologyonline.2000.15.2.72. [DOI] [PubMed] [Google Scholar]
- Salehi A, Chen D, Hakanson R, Nordin G, Lundquist I. Gastrectomy induces impaired insulin and glucagon secretion: evidence for a gastro-insular axis in mice. J Physiol. 1999;514:579–591. doi: 10.1111/j.1469-7793.1999.579ae.x. [DOI] [PMC free article] [PubMed] [Google Scholar]
- Schulla V, Renstrom E, Feil R, Feil S, Franklin I, Gjinovci A, et al. Impaired insulin secretion and glucose tolerance in β cell-selective Cav1.2 Ca2+ channel null mice. EMBO J. 2003;22:3844–3854. doi: 10.1093/emboj/cdg389. [DOI] [PMC free article] [PubMed] [Google Scholar]
- Smith PA, Proks P, Ashcroft FM. Quantal analysis of 5-hydroxytryptamine release from mouse pancreatic β-cells. J Physiol. 1999;521:651–664. doi: 10.1111/j.1469-7793.1999.00651.x. [DOI] [PMC free article] [PubMed] [Google Scholar]
- Speier S, Rupnik M. A novel approach to in situ characterization of pancreatic β-cells. Pflugers Arch. 2003;446:553–558. doi: 10.1007/s00424-003-1097-9. [DOI] [PubMed] [Google Scholar]
- Westerlund J, Bergsten P. Glucose metabolism and pulsatile insulin release from isolated islets. Diabetes. 2001;50:1785–1790. doi: 10.2337/diabetes.50.8.1785. [DOI] [PubMed] [Google Scholar]
- Yajima M, Hosoda K, Kanbayashi Y, Nakamura T, Nogimori K, Mizushima Y, et al. Islets-activating protein (IAP) in Bordetella pertussis that potentiates insulin secretory responses of rats. Purification and characterization. J Biochem. 1978;83:295–303. doi: 10.1093/oxfordjournals.jbchem.a131904. [DOI] [PubMed] [Google Scholar]


