Abstract
The aim of this study was to investigate the modulation of satellite cell content and myonuclear number following 30 and 90 days of resistance training and 3, 10, 30, 60 and 90 days of detraining. Muscle biopsies were obtained from the vastus lateralis of 15 young men (mean age: 24 years; range: 20–32 years). Satellite cells and myonuclei were studied on muscle cross-sections stained with a monoclonal antibody against CD56 and counterstained with Mayer's haematoxylin. Cell cycle markers CyclinD1 and p21 mRNA levels were determined by Northern blotting. Satellite cell content increased by 19% (P = 0.02) at 30 days and by 31% (P = 0.0003) at 90 days of training. Compared to pre-training values, the number of satellite cells remained significantly elevated at 3, 10 and 60 days but not at 90 days of detraining. The two cell cycle markers CyclinD1 and p21 mRNA significantly increased at 30 days of training. At 90 days of training, p21 was still elevated whereas CyclinD1 returned to pre-training values. In the detraining period, p21 and CyclinD1 levels were similar to the pre-training values. There were no significant alterations in the number of myonuclei following the training and the detraining periods. The fibre area controlled by each myonucleus gradually increased throughout the training period and returned to pre-training values during detraining. In conclusion, these results demonstrate the high plasticity of satellite cells in response to training and detraining stimuli and clearly show that moderate changes in the size of skeletal muscle fibres can be achieved without the addition of new myonuclei.
Satellite cells are mononucleated cells located between the sarcolemma and the basal lamina of muscle fibres (Mauro, 1961). Satellite cells represent muscle precursor cells; their activation and subsequent proliferation give rise to daughter cells that can undergo the following fates: (1) generate new muscle fibres, (2) provide additional myonuclei to the parent fibre or (3) return to a quiescent status. In response to resistance training, it has been shown that satellite cells can either generate new muscle fibres, or provide new myonuclei to the parent fibres or produce daughter cells that become stem cells themselves (for review see Allen et al. 1999). Thus, satellite cells might undergo any of these three pathways in response to resistance exercise in humans. At present, it is unclear how the fate of daughter cells is determined. It is well established that a period of resistance training enhances protein synthesis in human skeletal muscles (Adams, 1998; Booth et al. 1998; Tipton & Wolfe, 1998; Rennie et al. 2004). The enhancement of protein synthesis might be mediated by pre-translational (alteration in the abundance of mRNA), translational (alteration in protein synthesis per unit of mRNA) or post-translational (transformation of the protein such as phosphorylation) events (Booth et al. 1998; Tipton & Wolfe, 1998). It is suggested that changes in the translational efficiency are responsible for the early stages of protein synthesis enhancement (Laurent et al. 1978). Later in the time course of protein synthesis enhancement, it appears that pre-translational events become critical (abundance of mRNA) (Adams, 1998). In this respect, adult skeletal muscle fibres are multinucleated cells where each myonucleus controls the production of mRNA and protein synthesis over a finite volume of cytoplasm, a concept known as the DNA unit or myonuclear domain (Cheek, 1985; Hall & Ralston, 1989). For mRNA content to increase, two possible pathways have been described: (1) each myonucleus has to increase the transcription rate of given genes (Carson et al. 1996); (2) satellite cell nuclei have to be incorporated into the parent fibre providing additional myonuclei (Allen et al. 1999). There is evidence supporting the hypothesis that in normal skeletal muscles, the transcriptional activity of individual myonuclei is not maximal (Newlands et al. 1998). This suggests that the transcriptional capacity of existing myonuclei can sustain increased protein synthesis following resistance training. In this case, the size of each myonuclear domain would increase, i.e. each myonucleus would control a greater amount of cytoplasm (Giddings & Gonyea, 1992). Once the transcriptional activity of existing myonuclei reaches a maximum level, additional myonuclei provided by satellite cell proliferation and fusion to the myofibre become required to support a greater cytoplasmic volume (Allen et al. 1995; Hikida et al. 1998; Kadi & Thornell, 2000). At the present time, there is a paucity of literature on the possible modulation of satellite cells and myonuclear number to accommodate exercise-induced hypertrophy in normal human muscles. Moreover, none of the studies has gathered a complete set of information on the time course of the modulation of satellite cells and myonuclear number in response to resistance training in human skeletal muscles. In addition, the effects of detraining on these muscular parameters have not been previously addressed. Given the above discussion, the aim of the present investigation was to study the modulation of satellite cell content and myonuclear number following 30 and 90 days of resistance training and following 3, 10, 30, 60 and 90 days of detraining.
Methods
Subjects
Fifteen young healthy men (age: 24 ± 1 years (mean ±s.e.m.), height: 181 ± 2 cm, body weight: 75.4 ± 2.4 kg pre-training, 76.9 ± 2.1 kg post training, 75.9 ± 2.1 kg post detraining) gave their informed consent to participate in the study, which was approved by the ethical committee of Copenhagen and Frederiksberg (KF01-010/01) and conformed with the standards set by the Declaration of Helsinki. All subjects were not engaged in any organized sports activities and had not performed any heavy resistance training at least 1 year prior to entering the study.
Training
The subjects performed a heavy resistance-training programme for 3 months. The training programme was progressive; that is, loading levels were monitored continuously and adjusted throughout the entire training period to maintain muscle loading as muscle strength increased (Andersen et al. 2003). In short, the subjects conducted the training programme 3 times a week (38 training sessions within a 90 day period). Four different resistance-training exercises for the legs were performed: hack squat, incline leg press, knee extensions and hamstring curl. The exercises were performed in 4–5 series of 6–12 repetitions, corresponding to 6–12 RM (repetition maximum). Additionally, a number of upper body exercises were performed. All training sessions were surveyed and supervised. After the training period the subjects entered a 3 month detraining period, in which they returned to their everyday life with an activity level as prior to entering the study, meaning that the subjects did not perform any resistance (or endurance) exercises during the detraining period.
Muscle sampling
Needle muscle biopsies were obtained from the mid-portion of the vastus lateralis muscle. A total of eight biopsies were obtained from each subject; prior to resistance training, after 30 and 90 days of resistance training and after 3, 10, 30, 60 and 90 days of detraining. In the trained state, biopsies were obtained 24 h after the last training session. All biopsies were obtained in the right leg. After obtaining the muscle biopsies, these were quickly freed from visible blood and mounted in an embedding medium and frozen in isopentane cooled by liquid nitrogen and stored at −80°C for analysis.
Immunohistochemical analysis
Five micrometre thick cross-sections were cut at −20°C using a cryostat microtome (Zeiss, HM560), mounted on glass slides, and air-dried at room temperature. Satellite cells were visualized using a monoclonal antibody against CD56 (dilution 1: 100, cat. no. 347740, Becton Dickinson) (Schubert et al. 1989; Kadi et al. 1999a,b; Kadi et al. 2004). The anti-CD56, which is similar to the anti-leu19 antigen, recognizes the neural cell adhesion molecule (NCAM), a cell–cell recognition glycoprotein expressed during the early stages of myogenesis and in satellite cells. Muscle cross-sections were air dried, rinsed for 20 min in phosphate-buffered saline (PBS), and incubated for 20 min with diluted normal blocking goat serum. Sections are then incubated for 2 h at 37° with primary mouse antibody diluted in bovine serum albumin. Slides are washed in PBS for 15 min and incubated for 30 min with diluted biotinylated goat anti-mouse secondary antibody (dilution 1: 200 in normal serum, Vector Laboratories, BA-9200). The slides are then washed for 20 min in PBS and incubated for 30 min with Vectastain ABC reagent (Vector Laboratories, PK-6100). For the visualization of primary antibody binding, the diaminobenzidine (DAB) substrate kit for peroxidase (Vector Laboratories, SK-4100) was used. Sections are then rinsed, counterstained with Mayer's haematoxylin, cleared and mounted using mountex.
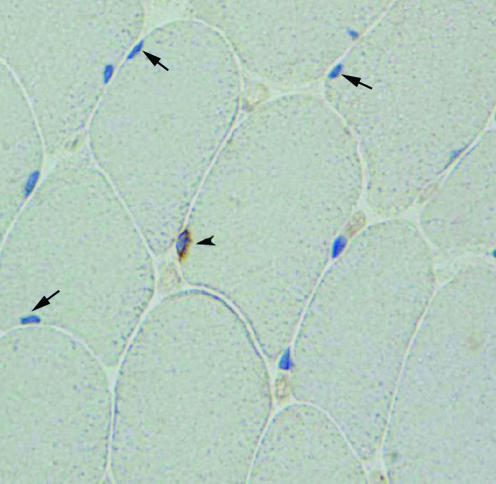
The visualization of myonuclei was done at high magnification (objective × 40 or × 60). In few cases, the determination of the position of some nuclei whether outside or inside the fibre can be difficult to achieve. Theoretically, this problem can be solved by labelling the basal lamina with an antibody against laminin. However, in practice, the few nuclei that are difficult to assess without the use of laminin staining are also difficult to assess using the laminin staining (in this case the nuclear staining is localized on both sides of the laminin staining). We have assessed this issue by comparing the number of myonuclei counted on sections stained with the anti-CD56 and counterstained with haematoxylin with that counted on sections where laminin staining is added. We did not observe any differences between the two counts. Therefore, the use of CD56 antibody and a counterstaining with haematoxylin allows a reliable distinction between myonuclei inside the fibres and nuclei outside the fibres. Moreover, we have noted that the immunohistochemical staining using DAB gives the fibre cytoplasm a slight tint that allows the distinction between the fibres and the surrounding connective tissue. Satellite cells were identified as brown rims that contained a nucleus (Fig. 1). The sections were visualized using light microscopy. Images were acquired with a digital camera (SPOT Insight, Diagnostic Instruments, Inc.) connected to the microscope (Nikon EclipseE400).
Figure 1. Identification of satellite cells and myonuclei.
Muscle cross-section stained with the antibody against CD56 (brown colour) and counterstained with Mayer's haematoxylin. Myonuclei are blue, and satellite cells are surrounded by a brown rim. The arrowhead indicates a satellite cell and arrows show myonuclei.
Myonuclei and satellite cells were counted on each fibre. In each muscle cross-section, f fibres, m myonuclei and s satellite cells were counted. The number of myonuclei per muscle fibre (m/f) and the number of satellite cells per fibre (s/f) were calculated.
Analysis of mRNA
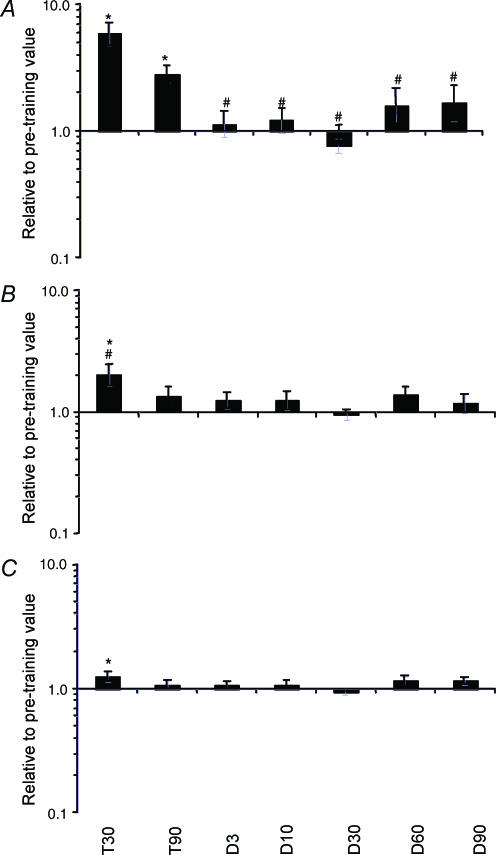
mRNA levels were determined by Northern blotting using cloned PCR products as previously described (Jonsdottir et al. 2000). The primers for PCR on human skeletal muscle cDNA were; p21 (TCA AAG GCC CGC TCT ACA TC, GTA CCA CCC AGC GGA CAA GT), CyclinD1 (GTG GGG TTC TAG GCA TCT CT, ATC GTA GGA GTG GGA CAG GT), GAPDH (GAA CAT CAT CCC TGC CTC TAC T, GTC TAC ATG GCA ACT GTG AGG A). Two different unrelated ‘constitutive’ RNA, 28S rRNA and GAPDH mRNA, were measured and the 28S rRNA normalized for the GAPDH mRNA (Schjerling, 2001). 28S rRNA increased significantly at the 30 training day time point only (Fig. 4). Whether this is due to more 28S rRNA or less GAPDH mRNA cannot be determined. However, it is more likely that 28S rRNA increases than that GAPDH mRNA decreases during resistance training, which increases protein synthesis and metabolic demand. Therefore, we have chosen to use GAPDH mRNA as internal control. The interpretation of the normalized data should take this choice into account.
Figure 4. Quantification of p21 and CyclinD1 mRNA.
mRNA for the cell-cycle markers p21 (A) and CyclinD1 (B) and the 28S rRNA (C) after 30 (T30) and 90 (T90) days of training and following 3 (D3), 10 (D10), 30 (D30), 60 (D60) and 90 (D90) days of detraining. The RNA levels are normalized to GAPDH mRNA and are relative to the pre-training value for each subject. * Significantly different from pre-training value (pre-training value = 1); # significantly different from T90.
Statistical analysis
Data are presented as mean ± standard error except for mRNA data, which were log-transformed before statistical calculations and presented as back-transformed means ± geometric standard error. The statistical significance of the differences between groups was analysed by one-way repeated measures ANOVA. When a significant F ratio was found, the Bonferroni post hoc test was used to compare mean values. Results were considered significant at P < 0.05.
Results
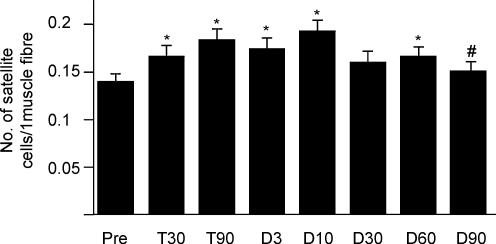
The number of satellite cells increased gradually during the training period (Fig. 2). By 30 days of resistance training, the number of satellite cells was significantly enhanced (P = 0.02). At 90 days, the number of satellite cells was further enhanced (P = 0.0003) as compared with the increase observed at 30 days of resistance training. Satellite cell content increased by 19.3% at 30 days of training and by 31.4% at 90 days of training. When pre-training satellite cell values are taken as a reference, the number of satellite cells remained statistically elevated at 3 (P = 0.003), 10 (P = 0.0001) and 60 (P = 0.02) days of detraining. The difference in satellite cell frequency between pre-training values and the 30 days of detraining time point approached the significance level (P = 0.07). Compared to the values observed at the end of the resistance-training period, the number of satellite cells per fibre decreased gradually in the detraining period.
Figure 2. Satellite cell number.
The number of satellite cells per muscle fibre before training (Pre), after 30 (T30) and 90 (T90) days of training and following 3 (D3), 10 (D10), 30 (D30), 60 (D60) and 90 (D90) days of detraining. * Significantly different from Pre; # significantly different from T90.
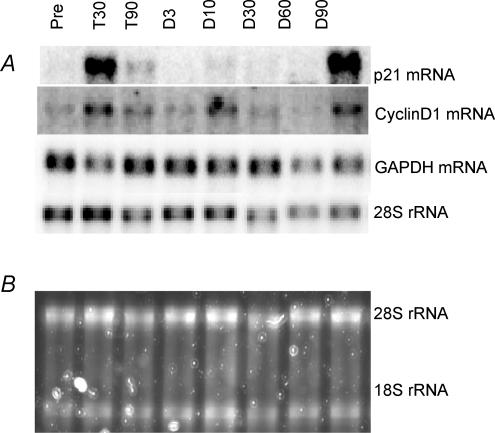
The two cell cycle markers CyclinD1 and p21 mRNA both increased after the first 30 days of training, 2- and 6-fold, respectively. At the end of the training period (90 days), p21 mRNA was still 3-fold elevated whereas CyclinD1 mRNA had almost returned to pre-training values (30% increase, P = 0.094). Throughout the detraining period the levels of p21 and CyclinD1 mRNA were both similar to the pre-training values (Figs 3 and 4).
Figure 3. Northern blot of p21 and CyclinD1.
A, Northern example for one subject before training (Pre), after 30 (T30) and 90 (T90) days of training and following 3 (D3), 10 (D10), 30 (D30), 60 (D60) and 90 (D90) days of detraining. B, staining of the ribosomal RNA with SYBR green before blotting is shown below.
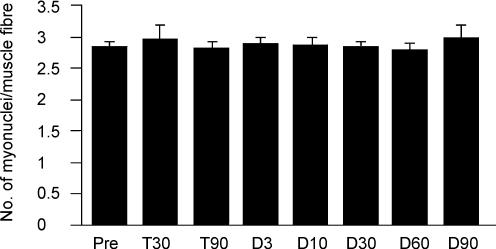
This study showed that there were no significant alterations in the number of myonuclei following the resistance and the detraining periods. The mean number of myonuclei per cross-sectional area of myofibre averaged 2.85 before training and 2.82 by the end of the third month of resistance training (Fig. 5). The myonuclear number remained constant throughout the entire detraining period. We noted that both the mean value and the standard deviation for myonuclei at the end of the detraining period (2.99 ± 0.19) were higher than pre-training values (2.85 ± 0.08).
Figure 5. Myonuclear number.
The mean number of myonuclei per muscle fibre before training (Pre), after 30 (T30) and 90 (T90) days of training and following 3 (D3), 10 (D10), 30 (D30), 60 (D60) and 90 (D90) days of detraining.
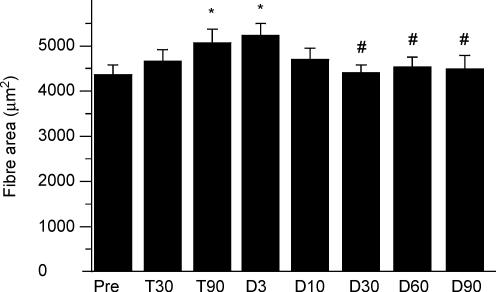
The training period induced a gradual increase in the cross-sectional area of muscle fibres (Fig. 6). The increase in fibre area reached 6% at 30 days and 17% at 90 days. The enhancement of the area of muscle fibres reached the significance level at 90 days of training. During the detraining period, the area of muscle fibres gradually decreased.
Figure 6. Fibre area.
Mean cross-sectional area of muscle fibres before training (Pre), after 30 (T30) and 90 (T90) days of training and following 3 (D3), 10 (D10), 30 (D30), 60 (D60) and 90 (D90) days of detraining. * Significantly different from Pre; # significantly different from T90.
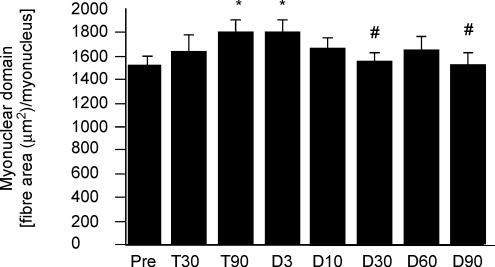
In the present study, we investigated changes in the area controlled by each myonucleus, i.e. changes in the size of the myonuclear domain. Before the training period, the area controlled by each myonucleus averaged 1522 μm2. The myonuclear domain gradually increased throughout the resistance-training period (Fig. 7). Compared to pre-training values, the myonuclear domain was significantly increased at 90 days of training and remained elevated 3 days following the end of the training period. After the third day of detraining, the myonuclear domain gradually decreased. At 30 days of detraining, the myonuclear domain had returned to pre-training values.
Figure 7. Myonuclear domain.
Myonuclear domain before training (Pre), after 30 (T30) and 90 (T90) days of training and following 3 (D3), 10 (D10), 30 (D30), 60 (D60) and 90 (D90) days of detraining. * Significantly different from Pre; # significantly different from T90.
Discussion
The possibility of enhancing satellite cell pool in human skeletal muscles has important clinical implications, as satellite cells are undifferentiated quiescent precursors able to divide and differentiate to accommodate the demands of growth. In this respect, a main outcome from the present investigation was the elevation of satellite cell number following 30 and 90 days of resistance training. Our results are in agreement with previous studies showing an increase in satellite cell frequency following resistance training (Kadi, 2000; Roth et al. 2001). Our study shows that 30 days of resistance training are sufficient to induce an increase in satellite cell pool and that an additional 60 days of training further enhances satellite cell frequency. It is also shown, for the first time, that the increase in satellite cell numbers following the training period is maintained for a long time after the cessation of training.
Although satellite cell proliferation occurs in response to growth/hypertrophy or following necrosis/regeneration, there are major differences between these two conditions (Grounds, 1998). Resistance training causes minor fibre damage and results mainly in hypertrophy compared to the classical regeneration response of skeletal muscles where there is clear evidence of myofibre necrosis stimulating an inflammatory response and repair of the damaged area by new sarcolemmal formation (Grounds, 1998). Although resistance training causes minor injury to myofibres, it has been shown that satellite cells may become activated and replicate even on fibres where overt necrosis is not detectable at light microscopical level (Darr & Schultz, 1987; Grounds, 1998).
The enhancement of satellite cell frequency has been previously observed in overloaded animal models (Schiaffino et al. 1972; Snow, 1990) and during chronic low-frequency stimulation (Putman et al. 1998). More recently, we reported a significant increase in the frequency of satellite cells (29% increase) in 11 men, between 70 and 80 years, in response to 14 weeks endurance training at a work load corresponding to 65–95% of peak oxygen consumption (Charifi et al. 2003). The enhancement of muscle size following the usage of anabolic steroids in humans is also accompanied by an enhancement of the number of satellite cells (Kadi et al. 1999a; Sinha-Hikim et al. 2003).
It is suggested that the activation of satellite cells in skeletal muscles following various stimuli would provide additional satellite cells (Bischoff, 1994; Schultz & McCormick, 1994). As observed in the present study, an enhancement of the satellite cell pool occurs in response to resistance training indicating that training is an efficient means to improve the growth capacity of skeletal muscles. In contrast to the cellular response observed following resistance training, proliferating satellite cells in denervated muscles do not appear to fuse to the parent myofibre and are lost from the muscle either by emigration or cell death (McGeachie & Grounds, 1989). For this reason, there is a decrease in the number of satellite cells following long-term denervation (Rodrigues-Ade & Schmalbruch, 1995).
The present study also shows an increase in CyclinD1 mRNA during training (day 30), which indicates the activation and proliferation of satellite cells (Adams et al. 1999). Furthermore, the even more pronounced up-regulation in p21 mRNA at 30 and 90 days of training but not at 3 days of detraining indicates that the proliferating satellite cells exit the cell cycle to form new quiescent satellite cells (Adams et al. 1999; Zhang et al. 1999; Hawke et al. 2003). Taken together, the increase in CyclinD1 and p21 mRNA levels indicates that during the resistance-training period, extensive cell divisions occurred and resulted in the increase in the number of satellite cells. Presumably, alterations in cyclinD1 and p21 mRNA reflect division and differentiation of satellite cells, although other cell types such as fibroblasts might also contribute to the changes observed at the level of these two cell cycle markers.
A common outcome from resistance training is an increase in the cross-sectional area of muscle fibres. In the present study, the hypertrophy of individual muscle fibres was not accompanied by an enhancement of the myonuclear number indicating that existing myonuclei supported the enlargement of muscle fibres. Thus, each myonucleus was able to support a larger cytoplasmic area. The theoretical amount of cytoplasm supported by a single myonucleus in a muscle fibre has been termed the DNA unit or the myonuclear domain (Cheek, 1985). Muscle hypertrophy could give rise to an increase in the number of domains (by increasing the number of myonuclei) or an increase in the size of existing domains (Edgerton & Roy, 1991). In the present study, the significant increase in the size of nuclear domains indicates that existing myonuclei were able to control a greater volume of cytoplasm. In fact, significant increases in myonuclear number have been reported in studies where muscle fibres had hypertrophied by more than 26% (Cabric & James, 1983; Allen et al. 1995; Hikida et al. 1998; Roy et al. 1999; Kadi & Thornell, 2000) but not by 6.8–15.5% (Giddings & Gonyea, 1992). In the present study, the area of muscle fibres increased by 6.7% at 30 days and by 17% at 90 days of resistance training. Altogether, these results suggest that until a certain limit of hypertrophy is reached, an increase in the area of muscle fibres can occur without the addition of new myonuclei. Existing myonuclei are able to increase their protein synthesis and support a moderate enhancement of the cytoplasmic area.
It is well established that resistance training enhances protein synthesis following a single exercise session and that protein synthesis remains elevated for ∼24 h (Rennie et al. 2004). Increased protein synthesis at this time range indicates that existing myonuclei in muscle fibres have the ability to respond quickly to resistance training by enhancing their translational capacity. Repeated bouts of resistance exercises under a long-term training period would lead to a greater increase in the size of muscle fibres and would put existing myonuclei under a greater strain. This would result in the addition of new myonuclei to allow further hypertrophy of muscle fibres.
The fact that resistance training increased satellite cell content but did not enhance the myonuclear number relates to previous observations in denervated muscles (McGeachie, 1985). Indeed, in experimental denervation, the proliferation of satellite cells does not lead to an increase in the number of myonuclei (McGeachie, 1985). In this respect, previous studies (Enesco & Puddy, 1964; Moss & Leblond, 1971) suggested that only a subpopulation of satellite cells could provide myonuclei to the muscle fibre. In vitro experiments showed that satellite cells are not a homogenous population. When plated and grown at clonal density, colonies derived from single satellite cells showed a wide range of sizes (Schultz & Lipton, 1982; Zammit & Beauchamp, 2001). This colony size diversity suggests that satellite cells in a mature muscle may have different fates and thus do not contribute equally to the formation of new myonuclei (Schultz & Lipton, 1982; Zammit & Beauchamp, 2001). Thus, different satellite cell populations would preferentially provide new myonuclei, participate in the formation of new muscle fibres or generate new satellite cells. The exact nature of the signalling pathways determining whether satellite cells continue to divide to form new muscle fibres or give rise to new satellite cells or fuse with the parent fibre to increase the myonuclear number are currently undefined.
Detraining was associated with a gradual decrease in the area of muscle fibres. Thus, the size of the myonuclear domain returned to pre-training values. This indicates that existing myonuclei were able to control a larger cytoplasmic area for a period of 90 days of training and returned to their initial workload by 30 days of detraining.
The number of satellite cells per fibre remained significantly elevated at 3, 10 and 60 days of detraining. Thus, the increase in satellite cell numbers is maintained for a long time after the cessation of training. At 90 days of detraining, the number of satellite cells per fibre had returned to pre-training values. The gradual decrease in satellite cell number during the detraining period might indicate that resistance training caused minor myofibre damage (necrosis being not detectable at the light microscopic level), resulting in the fusion of satellite cells with the parent myofibre or in the formation of new myofibres (Grounds, 1998).
At 90 days of training only p21 mRNA had increased significantly whereas CyclinD1 mRNA only demonstrated a trend towards an increase (P = 0.094). As discussed earlier, although changes in CyclinD1 and p21 mRNA might reflect the activation status of cell types other than satellite cells, our result supports the concept that at the end of the training period satellite cell proliferation is reduced. The rapid decrease in p21 mRNA at 3 days of detraining indicates that the arrest of training was associated with a termination of satellite cell activation.
In conclusion, the present results clearly demonstrate the high plasticity of satellite cells in response to exercise training and provide new insights into the long-term effects of training followed by detraining. Moderate changes in the size of skeletal muscle fibres can be achieved without the addition of new myonuclei, which indicates that existing myonuclei are able to support a certain level of muscle fibre hypertrophy.
Acknowledgments
This study was supported in part by The Danish Elite Sports Association, Team Denmark, the Danish National Research Foundation (Grant 504-14) and the Swedish National Center for Research in Sports. The authors are grateful for the skilful technical assistance of Vigdis H. Christie and Ann-Christina Henriksen.
References
- Adams GR. Role of insulin-like growth factor-I in the regulation of skeletal muscle adaptation to increased loading. In: Holloszy JO, editor. Exercise and Sport Sciences Reviews. Baltimore: Williams & Wilkins; 1998. [PubMed] [Google Scholar]
- Adams GR, Haddad F, Baldwin KM. Time course of changes in markers of myogenesis in overloaded rat skeletal muscles. J Appl Physiol. 1999;87:1705–1712. doi: 10.1152/jappl.1999.87.5.1705. [DOI] [PubMed] [Google Scholar]
- Allen DL, Monke SR, Talmadge RJ, Roy RR, Edgerton VR. Plasticity of myonuclear number in hypertrophied and atrophied mammalian skeletal muscle fibers. J Appl Physiol. 1995;78:1969–1976. doi: 10.1152/jappl.1995.78.5.1969. [DOI] [PubMed] [Google Scholar]
- Allen DL, Roy RR, Edgerton VR. Myonuclear domains in muscle adaptation and disease. Muscle Nerve. 1999;22:1350–1360. doi: 10.1002/(sici)1097-4598(199910)22:10<1350::aid-mus3>3.0.co;2-8. [DOI] [PubMed] [Google Scholar]
- Andersen JL, Schjerling P, Andersen LL, Dela F. Resistance training and insulin action in humans: effects of de-training. J Physiol. 2003;551:1049–1058. doi: 10.1113/jphysiol.2003.043554. [DOI] [PMC free article] [PubMed] [Google Scholar]
- Bischoff R. The satellite cell and muscle regeneration. In: Engel AG, Franzini-Armstrong C, editors. Myology. 2. New York: McGraw-Hill; 1994. pp. 97–117. [Google Scholar]
- Booth FW, Tseng BS, Fluck M, Carson JA. Molecular and cellular adaptation of muscle in response to physical training. Acta Physiol Scand. 1998;162:343–350. doi: 10.1046/j.1365-201X.1998.0326e.x. [DOI] [PubMed] [Google Scholar]
- Cabric M, James NT. Morphometric analyses on the muscles of exercise trained and untrained dogs. Am J Anat. 1983;166:359–368. doi: 10.1002/aja.1001660309. [DOI] [PubMed] [Google Scholar]
- Carson JA, Schwartz R, Booth FW. SRF and TEF-1 control of chicken skeletal α-actinin promoter in young chickens during hypertrophy caused by strech overload. Am J Physiol. 1996;268:C918–C924. doi: 10.1152/ajpcell.1995.268.4.C918. [DOI] [PubMed] [Google Scholar]
- Charifi N, Kadi F, Feasson L, Denis C. Effects of endurance training on satellite cell frequency in skeletal muscle of old men. Muscle Nerve. 2003;28:87–92. doi: 10.1002/mus.10394. [DOI] [PubMed] [Google Scholar]
- Cheek DB. The control of cell mass and replication. The DNA unit- a personal 20-year study. Early Hum Dev. 1985;12:211–239. doi: 10.1016/0378-3782(85)90144-6. [DOI] [PubMed] [Google Scholar]
- Darr KC, Schultz E. Exercise-induced satellite cell activation in growing and mature skeletal muscle. J Appl Physiol. 1987;63:1816–1821. doi: 10.1152/jappl.1987.63.5.1816. [DOI] [PubMed] [Google Scholar]
- Edgerton VR, Roy RR. Regulation of skeletal muscle fiber size, shape and function. J Biomech. 1991;24(suppl. 1):123–133. doi: 10.1016/0021-9290(91)90383-x. [DOI] [PubMed] [Google Scholar]
- Enesco M, Puddy D. Increase in the number of nuclei and weight in skeletal muscle of rats of various ages. Am J Anat. 1964;114:235–244. doi: 10.1002/aja.1001140204. [DOI] [PubMed] [Google Scholar]
- Giddings CJ, Gonyea WJ. Morphological observations supporting muscle fiber hyperplasia following weight-lifting exercise in cats. Anat Rec. 1992;233:178–195. doi: 10.1002/ar.1092330203. [DOI] [PubMed] [Google Scholar]
- Grounds MD. Age-associated changes in the response of skeletal muscle cells to exercise and regeneration. Ann N Y Acad Sci. 1998;854:78–91. doi: 10.1111/j.1749-6632.1998.tb09894.x. [DOI] [PubMed] [Google Scholar]
- Hall ZW, Ralston E. Nuclear domains in muscle cells. Cell. 1989;59:771–772. doi: 10.1016/0092-8674(89)90597-7. [DOI] [PubMed] [Google Scholar]
- Hawke TJ, Meeson AP, Jiang N, Graham S, Hutcheson K, DiMaio JM, Garry DJ. p21 is essential for normal myogenic progenitor cell function in regenerating skeletal muscle. Am J Physiol. 2003;285:1019–1027. doi: 10.1152/ajpcell.00055.2003. [DOI] [PubMed] [Google Scholar]
- Hikida RS, Walsh S, Barylski N, Campos G, Hagerman FC, Staron RS. Is hypertrophy limited in elderly muscle fibers? A comparison of elderly and young strength-trained men. Basic Appl Myol. 1998;8:419–427. [Google Scholar]
- Jonsdottir IH, Schjerling P, Ostrowski K, Asp S, Richter EA, Pedersen BK. Muscle contractions induce interleukin-6 mRNA production in rat skeletal muscles. J Physiol. 2000;528:157–163. doi: 10.1111/j.1469-7793.2000.00157.x. [DOI] [PMC free article] [PubMed] [Google Scholar]
- Kadi F. Adaptation of human skeletal muscle to training and anabolic steroids. Acta Physiol Scand. 2000;646:1–52. [PubMed] [Google Scholar]
- Kadi F, Charifi N, Denis C, Lexell J. Satellite cells and myonuclei in young and elderly women and men. Muscle Nerve. 2004;29:120–127. doi: 10.1002/mus.10510. [DOI] [PubMed] [Google Scholar]
- Kadi F, Eriksson A, Holmner S, Butler-Browne GS, Thornell LE. Cellular adaptation of the trapezius muscle in strength-trained athletes. Histochem Cell Biol. 1999b;111:189–195. doi: 10.1007/s004180050348. [DOI] [PubMed] [Google Scholar]
- Kadi F, Eriksson A, Holmner S, Thornell L-E. Effects of anabolic steroids on the muscle cells of strength-trained athletes. Med Sci Sports Exerc. 1999a;31:1528–1534. doi: 10.1097/00005768-199911000-00006. [DOI] [PubMed] [Google Scholar]
- Kadi F, Thornell LE. Concomitant increases in myonuclear and satellite cell content in female trapezius muscle following strength training. Histochem Cell Biol. 2000;113:99–103. doi: 10.1007/s004180050012. [DOI] [PubMed] [Google Scholar]
- Laurent G, Sparrow M, Millward D. Turnover of muscle protein in the fowl. Changes in rates of protein synthesis and beackdown during hypertrophy of the anterior and posterior latissimus dorsi muscle. Biochem J. 1978;176:407–417. doi: 10.1042/bj1760407. [DOI] [PMC free article] [PubMed] [Google Scholar]
- McGeachie JK. The fate of proliferating cells in skeletal muscle after denervation or tenotomy: an autoradiographic study. Neuroscience. 1985;15:499–506. doi: 10.1016/0306-4522(85)90228-3. [DOI] [PubMed] [Google Scholar]
- McGeachie JK, Grounds MD. The onset of myogenesis in denervated mouse skeletal muscle regenerating after injury. Neuroscience. 1989;28:509–514. doi: 10.1016/0306-4522(89)90196-6. [DOI] [PubMed] [Google Scholar]
- Mauro A. Satellite cell of skeletal muscle fibers. J Biophys Biochem Cytol. 1961;9:493–495. doi: 10.1083/jcb.9.2.493. [DOI] [PMC free article] [PubMed] [Google Scholar]
- Moss FP, Leblond CP. Satellite cells as the source of nuclei in muscles of growing rats. Anat Rec. 1971;170:421–435. doi: 10.1002/ar.1091700405. [DOI] [PubMed] [Google Scholar]
- Newlands S, Levitt LK, Robinson CS, Karpf AB, Hodgson VR, Wade RP, Hardeman EC. Transcription occurs in pulses in muscle fibers. Genes Dev. 1998;12:2748–2758. doi: 10.1101/gad.12.17.2748. [DOI] [PMC free article] [PubMed] [Google Scholar]
- Putman C, Dusterhoft S, Pette D. Changes in satellite cell content and myosin isoforms in low frequency stimulated fast muscle of hypothyroid rat. J Appl Physiol. 1998;86:40–51. doi: 10.1152/jappl.1999.86.1.40. [DOI] [PubMed] [Google Scholar]
- Rennie MJ, Wackerhage H, Spangenburg EE, Booth FW. Control of the size of the human muscle mass. Annu Rev Physiol. 2004;66:799–828. doi: 10.1146/annurev.physiol.66.052102.134444. [DOI] [PubMed] [Google Scholar]
- Rodrigues-Ade C, Schmalbruch H. Satellite cells and myonuclei in long-term denervated rat muscles. Anat Rec. 1995;243:430–437. doi: 10.1002/ar.1092430405. [DOI] [PubMed] [Google Scholar]
- Roth SM, Martel GF, Ivey FM, Lemmer JT, Tracy BL, Metter EJ, Hurley BF, Rogers MA. Skeletal muscle satellite cell characteristics in young and older men and women after heavy resistance strength training. J Gerontol a Biol Sci Med Sci. 2001;56:240–247. doi: 10.1093/gerona/56.6.b240. [DOI] [PubMed] [Google Scholar]
- Roy R, Monke S, Allen D, Edgerton V. Modulation of myonuclear number in functionally overloaded and exercised rat plantaris fibers. J Appl Physiol. 1999;87:634–642. doi: 10.1152/jappl.1999.87.2.634. [DOI] [PubMed] [Google Scholar]
- Schiaffino S, Bormioli SP, Aloisi M. Cell proliferation in rat skeletal muscle during early stages of compensatory hypertrophy. Virchows Arch B Cell Pathol. 1972;11:268–273. doi: 10.1007/BF02889406. [DOI] [PubMed] [Google Scholar]
- Schjerling P. The importance of internal controls in mRNA quantification. J Appl Physiol. 2001;90:401–402. doi: 10.1152/jappl.2001.90.1.401. [DOI] [PubMed] [Google Scholar]
- Schubert W, Zimmermann K, Cramer M, Starzinski-Powitz A. Lymphocyte antigen Leu-19 as a molecular marker of regeneration in human skeletal muscle. Proc Natl Acad Sci U S A. 1989;86:307–311. doi: 10.1073/pnas.86.1.307. [DOI] [PMC free article] [PubMed] [Google Scholar]
- Schultz E, Lipton BH. Skeletal muscle satellite cells: changes in proliferation potential as a function of age. Mech Ageing Dev. 1982;20:377–383. doi: 10.1016/0047-6374(82)90105-1. [DOI] [PubMed] [Google Scholar]
- Schultz E, McCormick KM. Skeletal muscle satellite cells. Rev Physiol Biochem Pharmacol. 1994;123:213–257. doi: 10.1007/BFb0030904. [DOI] [PubMed] [Google Scholar]
- Sinha-Hikim I, Roth SM, Lee MI, Bhasin S. Testosterone-induced muscle hypertrophy is associated with an increase in satellite cell number in healthy, young men. Am J Physiol. 2003;285:197–205. doi: 10.1152/ajpendo.00370.2002. [DOI] [PubMed] [Google Scholar]
- Snow MH. Satellite cell response in rat soleus muscle undergoing hypertrophy due to surgical ablation of synergists. Anat Rec. 1990;227:437–446. doi: 10.1002/ar.1092270407. [DOI] [PubMed] [Google Scholar]
- Tipton KD, Wolfe RR. Exercise-induced changes in protein metabolism. Acta Physiol Scand. 1998;162:377–387. doi: 10.1046/j.1365-201X.1998.00306.x. [DOI] [PubMed] [Google Scholar]
- Zammit P, Beauchamp J. The skeletal muscle satellite cell: stem cell or son of stem cell? Differentiation. 2001;68:193–204. doi: 10.1046/j.1432-0436.2001.680407.x. [DOI] [PubMed] [Google Scholar]
- Zhang P, Wong C, Liu D, Finegold M, Harper JW, Elledge SJ. p21 (CIP1) and p57 (KIP2) control muscle differentiation at the myogenin step. Genes Dev. 1999;13:213–224. doi: 10.1101/gad.13.2.213. [DOI] [PMC free article] [PubMed] [Google Scholar]


