

Abstract
Up to four link types are found between the stereocilia of chick vestibular hair bundles: tip links, horizontal top connectors, shaft connectors and ankle links. A fifth type, the kinocilial link, couples the hair bundle to the kinocilium. Brownian-motion microinterferometry was used to study the mechanical properties of the hair bundle and investigate changes caused by removing different links with the calcium chelator BAPTA or the protease subtilisin. Immunofluorescence with an antibody to the hair-cell antigen (HCA) and electron microscopy were used to verify destruction of the links. The root mean square displacement and the corresponding absolute stiffness of untreated hair bundles were 4.3 nm and 0.9 mN m−1, respectively. The ratio of Brownian-motion spectra before and after treatment was calculated and processed using a single oscillator model to obtain relative stiffness. Treatment with BAPTA, which cleaves tip, kinocilial and ankle links, reduces hair-bundle stiffness by 43%, whilst subtilisin treatment, which breaks ankle links and shaft connectors, reduces stiffness by 48%. No changes were detected in viscous damping following either treatment. The time course of the subtilisin-induced stiffness change was close to that of HCA loss, but not to the disappearance of the ankle links, suggesting that shaft connectors make a more significant contribution to hair-bundle stiffness. Sequential treatments of the hair bundles with BAPTA and subtilisin show that the effects are additive. The implication of complete additivity is that structures resistant to both agents (e.g. top connectors and stereocilia pivots) are responsible for approximately 9% of the overall bundle stiffness.
Stereocilia within hair bundles are interconnected by lateral links of several types (Osborne et al. 1984; Pickles et al. 1984). Five types of links have been identified on chick vestibular hair bundles (Fig. 1) using immunofluorescence and immunoelectron microscopy (Goodyear & Richardson, 1992, 1999, 2003). Tip links (Pickles et al. 1984) are thin filaments that run from the tip of each stereocilium to the side of an adjacent taller stereocilium and transmit forces, caused by hair-bundle deflection, between stereocilia. Kinocilial links connect the kinocilium to the tallest stereocilia. Horizontal top links connect the top of a shorter stereocilium to an adjacent longer stereocilium at a short distance below the tip links (Nagel et al. 1991; Goodyear & Richardson, 1992). Shaft connectors and ankle links connect the shafts and basal regions, respectively, of neighbouring stereocilia (Hirokawa & Tilney, 1982; Goodyear & Richardson, 1999, 2003). The roles of these different hair-bundle links are not fully understood. It has been suggested that lateral links probably preserve hair bundle integrity (Pickles et al. 1989) and transmit interstereociliary forces (Langer et al. 2001), but the contribution of different link types to the overall stiffness of hair bundles remains unknown. These contributions can be measured if link types are removed selectively from a bundle containing all of the known links. Although not absolutely selective, treatments with the calcium chelator BAPTA or protease subtilisin can destroy particular types of links. Exposure of hair bundles to solutions of calcium chelators, including BAPTA, cleaves tip links, abolishes mechanotransduction (Assad et al. 1991; Crawford et al. 1991) and causes a decrease in hair-bundle stiffness (Pae & Saunders, 1994; Marquis & Hudspeth, 1997). The relative angular deflection of the tallest and the shortest stereocilia (Duncan et al. 1995) is increased (Duncan et al. 1998) and becomes less asymmetrical (Eisen et al. 1999) in low Ca2+. Kinocilial links and ankle links are also removed by BAPTA (Goodyear & Richardson, 2003). In chick hair bundles, ankle links and shaft connectors can be removed by treatment with 50 mg l−1 subtilisin, leaving tip links, kinocilial links and horizontal top links intact (Goodyear & Richardson, 1999, 2003). Deletion of the links was shown with transmission electron microscopy (TEM) as well as immunofluorescence with antibodies to the hair-cell antigen (HCA; Goodyear & Richardson, 1992) or the ankle-link antigen (ALA; Goodyear & Richardson, 1999, 2003), reactive to shaft connectors and ankle links, respectively. Every type of link that has been distinguished so far is present on hair cells in the striolar region of the chick utricle. We have therefore chosen these hair bundles to study the contribution of the different link types to the mechanical properties of the hair bundle.
Figure 1. A schematic drawing of a vestibular hair bundle.

Kinocilium (k) is connected to the tallest stereocilia by kinocilial links (kl). Stereocilia are interconnected on the top by tip links (t) and horizontal top links (h) below them. Shaft connectors (s) connect shafts of stereocilia. The stereocilia adjacent to their insertion into the cuticular plate are interconnected by ankle links (a).
Hair-bundle stiffness has previously been measured from deflections of calibrated fibres in the bullfrog sacculus (Flock & Strelioff, 1984; Strelioff & Flock, 1984; Howard & Ashmore, 1986; Howard & Hudspeth, 1988), turtle basilar papilla (Crawford & Fettiplace, 1985) and mouse cochlea (Kössl et al. 1990; Russell et al. 1992). Stiffness measurements on chick hair bundles have been performed without direct mechanical contact using a fluid jet and video imaging (Szymko et al. 1992; Pae & Saunders, 1994). Differential interference contrast (DIC) interferometry of Brownian motion is another technique used for measuring hair-bundle compliance (Denk et al. 1989; Denk & Webb, 1992; Frank et al. 2002). With this technique, the bundle is not mechanically contacted and external forces are not applied to it. Thus the bundle is kept under resting conditions and the bandwidth of the measurements is limited only by that of the DIC interferometer and not by those of imposed mechanical forces (Saunders & Szymko, 1989). In the present study, DIC interferometry was employed to measure the Brownian motion of hair bundles in the chick utricle. Brownian motion spectra were used to calculate changes in hair-bundle stiffness caused by removal of link types with the calcium chelator BAPTA and the protease subtilisin.
Methods
Tissue preparation and treatment
Three- to 14-day-old chicks (ISA Brown breed, Hubbard ISA, Peterborough, Northants, UK) were used in this study. Animals were killed with CO2 and decapitated. Pieces of skull containing the inner ear were placed in cold (+4°C) Hank's balanced salt solution without Phenol Red (HBSS, mm: CaCl2, 1.26; KCl, 5.36; KH2PO4, 0.44; MgCl2, 0.49; NaCl, 136.9; NaHCO3, 4.17; Na2HPO4, 3.38; and glucose, 5.56; Invitrogen, Paisley, UK) buffered with 10 mm Hepes, pH 7.3. Utricular maculae were dissected and otolitic membranes carefully removed with fine forceps. Maculae were transferred into a recording chamber, folded in half and fixed under a fine nylon strand on the bottom of the chamber so that the hair bundles protruded horizontally from the folded edge. The line of folding of the macula was orientated in the mediolateral direction in the middle one-third of the sensory epithelium.
Particulate debris was removed from the tissue by perfusing the preparation with filtered (0.22 μm pores) HBSS at a rate of 500–1000 μl min−1 before data collection. Perfusion was maintained throughout the entire experiment, except during the recording periods that lasted for approximately 20 s. A stock solution of subtilisin (Protease type XXIV, Sigma, UK) in HBSS (1 g l−1) was prepared on the day of the experiment and diluted to obtain a final concentration of 50 mg l−1. A 5 mm solution of BAPTA (Sigma) was prepared from calcium- and magnesium-free Hank's balanced salt solution without Phenol Red (mm: KCl, 5.33; KH2PO4, 0.44; NaHCO3, 4.00; NaCl, 137.93, Na2HPO4, 0.30 and glucose, 5.60; Invitrogen, Paisley, UK), adding 0.9 mm MgCl2 and 10 mm Hepes, and adjusting the pH to 7.3 with NaOH. BAPTA application and consequent wash out of the preparation with HBSS were undertaken using the same perfusion system. Concanavalin A (Calbiochem, Nottingham, UK) was used as a 0.3 or 0.6 μm solution in HBSS.
To assess viability of the hair cells during experiments, a 5 μm solution of vital dye FM1-43 (Molecular Probes, Eugene, OR, USA) in HBSS was injected through the tip of a 40 μm diameter glass pipette over the apical surface of the epithelium for 1 s. Fluorescence of cell bodies after the dye application indicates permeation of the dye into hair cells by fast endocytosis (Meyer et al. 2001) or through transduction channels (Gale et al. 2001). FM1-43 staining was still observed after up to 45 min of treatment with 50 mg l−1 subtilisin (Fig. 2), but was not detected after a 10 min treatment with BAPTA. To check that cells that had loaded with FM1-43 did not have damaged membranes, we applied a 500 μm solution of the nucleic acid stain SYTOX® Green (Molecular Probes) in the bath. By use of an FITC filter set with a long-pass 515 nm emission filter (Zeiss 488009, Welwyn Garden City, Herts, UK) we were able to observe the fluorescence of both dyes. Different distribution patterns, colour and intensity of the dyes’ fluorescence allowed sequential use of the dyes on the same preparation. Fluorescence of SYTOX-stained cell nuclei was observed only on the periphery of the macula in a small number of cells, presumably damaged during dissection, in swollen cells, or in hair cells with clearly visible broken hair bundles.
Figure 2. FM1-43 stains hair cells of control (A) and subtilisin-(B) but not BAPTA-treated utricles (C).

The control sample was maintained under HBSS perfusion for 45 min. Subtilisin was applied as a 50 mg l−1 solution for 45 min.
All procedures involving animals were performed in accordance with UK Home Office regulations.
Interferometry and data processing
The interferometer employed in this study (Fig. 3A) shares the same methodology and is similar in design to that used by Denk & Webb (1990). In essence, a laser beam was split in two and the separation width controlled by a DIC slider on the condenser. The beams formed 0.5 μm spots in the focal plane of the microscope. The upper quadrant of a hair bundle (viewed in profile, Fig. 3B) was positioned, by moving the tissue stage, so that the spots were on either side of the bundle. As the hair bundle moved, the difference of refraction indices in the spots changed, producing a differential signal between the beams that was detected by the photodiodes in the system. In detail, the beam of a 633 nm, 5 mW helium–neon laser was circularly polarized using a rotating polariser and a quarterwave plate, spatially filtered using a ×10 microscope objective with 6 μm pinhole, and collimated with a single lens of 35 mm focal length. The beam was then combined with the conventional illumination of a Zeiss Axioskop microscope using a 20 mm beam splitter cube (BS1 on Fig. 3A, Coherent, Ely, Cambs, UK). A water immersion 40 × 0.75 NA objective equipped with a DIC slider (Zeiss, Welwyn Garden City, Herts, UK) replaced the condenser lens. The objective and the slider focused the laser light and split it into two partly overlapping 0.5 μm points with perpendicular polarization. At the same time, the objective worked as a condenser and provided DIC illumination of the specimen. Adjustments were made to provide simultaneous Köhler illumination of the specimen and focusing of the laser light into a diffraction-limited point in the focal plane of the microscope. The specimen was fixed in a 0.4 ml volume, glass-bottomed Perspex chamber and viewed through an identical 40 × 0.75 NA objective with a DIC slider. The second slider combined the images of the perpendicularly polarized points. The resulting image and the conventional microscopic image were separated with a beamsplitter BS2 (Coherent) situated inside the custom-built microscope camera port. The laser light was directed into an additional perpendicular flange of the camera port, where a polarizing beam splitter BS3 (Coherent) and two photodiodes with integrated preamplifiers (Burr-Brown OPT-210) were mounted. The photodiodes provided intensity signals for two perpendicularly polarized components of the laser beam. Green illumination was used to obtain the conventional microscope image. Four green filters (Zeiss 467803 or Hoya 533) were used to filter the incandescent illumination, and to protect the experimenter's eyes and the CCD camera (Retiga 1300) from the laser light. A polariser and two separate analysers produced conventional DIC images for the camera and eyepieces. The microscope binocular tube was switched to the camera position during measurements, and a DIC image of the specimen was projected on the camera chip using a ×4 adapter (452985, Zeiss). The final magnification on the PC screen was ×4500 with an object resolution of 42 nm per pixel. At the same time, the photodiodes on the camera port provided the interferometric signal.
Figure 3. Arrangement and employment of the interferometer.

A, optical scheme of the interferometer. See Methods for detailed description. B, utricular hair bundles on the folded edge of a macula. A striolar hair bundle is positioned between the beams of the interferometer for measurements. Arrow indicates the line of hair-bundle polarity reversal. Scale bar = 10 μm.
The specimen chamber was mounted on an X–Y stage made of two flexure piezo positioners (280.10, Physik Instrumente, Harpenden, Herts, UK). The X- and Y-piezo DC voltages were controlled by potentiometers for fine manual adjustment of specimen position. Two in-phase sinusoidal signals were added to the DC voltages to provide linear calibration movements of known amplitude in a chosen direction.
Displacement of a small object (e.g. a stereocilium) results in the interferometer voltage output signal V, which is proportional to the displacement and can be found according to the equation of Denk & Webb (1990):
 |
where v+ and v− are voltages on the two photodiodes. The signal was calculated using either the amplified photodiode voltages or the electronically calculated sum and difference signals.
The apical quarter of the bundle was positioned in the focused beam of the interferometer so that the long axis of the bundle was perpendicular to the direction of the DIC shadow. In order to maximize the signal-to-noise ratio of the hair bundle Brownian motion, measurements reported in this paper were made from the tallest rows of stereocilia. These findings are likely to be representative also of the movements due to Brownian motion of the shortest rows of stereocilia, because the linkages are present between all stereocilia in any given hair bundle type. Maximum oscilloscope signal was obtained by small variations of the calibration movement direction and the bundle position when using 15–80 nm, peak-to-peak movements in a direction parallel to that of the DIC shadow. Recording duration was about 8 s or 220 samples at a sampling rate of 125 kHz. Eight-pole Bessel anti-aliasing filters with −3 dB at 50 kHz were the only signal filters used in the data acquisition and processing. A computer programme written in C controlled data acquisition and generated signals for the calibration movement. The time series obtained were converted to the frequency domain by direct application of FFT and scaled to displacement units using the peak of the calibration movement of known amplitude. The resulting spectrum, after deletion of the calibration peak and zero-frequency component, was filtered with a 128-point binomial filter and every 64th point kept. All data processing was carried out using procedures in Igor software (Wavemetrics, Lake Oswego, OR, USA). Usually three or four consecutive recordings were made with a minimum interval of 1–2 min required for data saving and preview.
To test the instrument, glass fibres of 4 μm diameter, which were reduced to 0.3 μm in diameter within 1 μm of their tips, were pulled using a P-2000 puller (Sutter Instruments, Novato, CA, USA). The combined beams of the interferometer were focused on the tip of the glass fibre and the Brownian motion spectrum of the fibre was recorded. As expected, the spectra had typical Lorentzian characteristics within the 10 Hz to 30 kHz frequency range.
The data were processed in the framework of a single oscillator model of the hair bundle. The displacement power spectral density (PSD,  ) of the hair bundles is given by
where 〈x2〉 is the mean square displacement and f is frequency. For the single oscillator model, the hair-bundle spectrum  resembles (Denk et al. 1989) a Lorentzian overdamped oscillator spectrum (S):
 |
where f is frequency, K is spring stiffness of the oscillator, γ is viscous damping, kB is the Boltzmann constant and T is the absolute temperature. To reveal changes in the mechanical properties of the hair bundles, the ratio  of the experimentally obtained displacement density spectra after,
  , and before,
  , treatment was calculated as:
 |
where  and
and  are the corresponding experimental displacement PSD. Assuming that treatment of the overdamped oscillator changed only its stiffness from value K1 to a new value K2 and that the viscous damping, γ, of the medium was constant, the theoretical frequency-dependent ratio of displacement spectral densities is
 |
where X1, S1 and f1 = K1/(2πγ) are the displacement density, displacement PSD and the roll-off frequency before the treatment; and X2, S2 and f2 = K2/(2πγ) are the same quantities after the treatment, respectively. An additional scaling parameter, a, constrained to 0.7 < a < 1.3, was used during fitting of the experimental data to accommodate small calibration errors.
 |
The limit of R(f) for f→∞ is 1 and for f→0 is
where ξ ≡ K2/K1 is relative stiffness. Therefore, to obtain a rough estimate of relative stiffness ξ we averaged the experimentally obtained  in the frequency regions from 2 to 8 kHz and from 20 to 80 Hz and took the quotient of the average values. Then we performed a direct fit of the experimental data to eqn (6) that led to similar values of ξ.
The absolute stiffness of the hair bundle was calculated using the equipartition theorem for a single spring with stiffness K:
where kB is the Boltzmann constant, T is the absolute temperature and 〈x2〉 is the mean square displacement. 〈x2〉 was calculated as a numeric integral of the experimental squared displacement spectra  over F1 = 20 Hz to F2 = 10 kHz frequency range.
 |
Then the absolute stiffness is:
Immunofluorescence and transmission electron microscopy
Utricular maculae were dissected as described above for the stiffness measurements and treated with 5 mm BAPTA and/or 50 mg l−1 subtilisin for periods ranging from 5 to 40 min. Control maculae were incubated in HBSS for the same amount of time. Immunofluorescence samples were prepared as described by Goodyear & Richardson (1999). Each macula was treated for a particular time period, then washed in HBSS and fixed in ice-cold 3.7% formaldehyde buffered with 0.1 m sodium phosphate, pH 7.2. After fixation, the maculae were washed in 150 mm NaCl and 10 mm sodium phosphate (PBS) solution, pH 7.2, preblocked with 10% (v/v) heat-inactivated horse serum (HS) in TBS (150 mm NaCl, 10 mm Tris-HCl, pH 7.4) for 40 min and incubated for 3 h with monoclonal anti-hair cell antigen (HCA) tissue culture supernatant diluted 1:100 in 10% HS/TBS (Goodyear & Richardson, 1992). Maculae were washed with PBS again, stained with FITC-conjugated rabbit anti-mouse Ig (Dako, High Wycombe, Bucks, UK) or with two layers of FITC-conjugated antibodies (rabbit anti-mouse and swine anti-rabbit Ig, Dako). Maculae were finally washed and mounted in Vectashield (Vector Laboratories, Peterborough, Cambs, UK). The sample images were acquired using a fluorescent microscope equipped with a CCD camera (Photometric SPOT) and processed with Matlab Image Processing Toolbox (Mathworks, Natick MA, USA). Background intensity was obtained using the morphological opening function of the Matlab toolbox, with a disk-shaped structuring element 32 pixels in diameter. Bundles were detected as bright objects on a manually selected region of the striola. Immunofluorescence intensity was obtained as an average of the maximum intensity of individual bundles in the selected region using the original image with the background subtracted. The intensity in three manually selected rectangular regions, covering more than 80% of striola, was averaged for each macula.
For transmission electron microscopy (TEM), the maculae were prepared as described for fluorescence measurements, treated with BAPTA or subtilisin for 10 or 25 min, respectively, washed three times with HBSS, and fixed with 2.5% (v/v) gluteraldehyde in 0.1 m sodium cacodylate with 1% (w/v) tannic acid, pH 7.2. The maculae were then washed three times in 0.1 m cacodylate buffer, fixed for 1 h in 1% (w/v) osmium tetroxide in 0.1 m sodium cacodylate, dehydrated through an ethanol series, equilibrated in propylene oxide and embedded in Taab 812 resin (Taab Laboratories, Reading, Berks, UK). Blocks were polymerized at 60°C for 24 h. Sections of 100 nm thickness were cut on a Reichert Ultracut E microtome and examined using a Hitachi 7100 transmission electron microscope.
Results
Mechanical measurements
The hair bundles can be clearly seen in profile protruding from the folded edge of the maculae (Fig. 3B). A significant number of them usually lie within the focal plane of the microscope. The striolar region can be recognized by a change in the predominant direction of hair-bundle polarization. For the measurements, we chose type I or II hair bundles situated within 60 μm of the point of polarity change. Bundles with irregular profiles or those that were inclined, bent or split were rejected. The plane of polarity of the hair bundles in this region was close to the focal plane of the microscope. The choice of long bundles with high contrast and sampling of bundles situated within 60 μm of the line of polarity change may have introduced a statistical bias in the data. An additional requirement for the successful observation of a particular bundle was the absence of any obstruction (e.g. other hair bundles or tissue debris) in the path of the laser light. The only indication of cell viability during an experiment was the appearance of the tissue. Throughout the experiment the cells looked healthy, with intact hair bundles. If a bundle moved, inclined or split due to tissue deterioration, data acquisition was stopped and the data were excluded from the subsequent analysis. At the end of each measurement session the preparation was checked using fluorescence microscopy with SYTOX to confirm that the hair cells were still viable.
Control experiments
The interferometer signal, V (eqn (1)), proportional to hair-bundle displacement was calculated and stored for all hair bundles. The distribution of bundle position was estimated for seven of the bundles. The calibration movement was either switched off during these experiments, or the sinusoidal component at the calibration frequency was filtered out during later analysis using the software. The distributions were almost ideally Gaussian after high-pass filtering at 10 Hz for all seven bundles. Hence, the force versus displacement curve is linear in the range of displacements used.
A set of control experiments with glass fibres of 0.5–20 μm diameter was performed to eliminate the possibility that the hair-bundle spectra were influenced through the movement of the cuticular plate or fluid flow associated with spontaneous cell membrane fluctuations. The fibres were positioned along the long axis of the bundle and within 1 μm of the bundle so as to block possible fluid flow. In the second type of experiment the fibres were pushed against the cuticular plate close to the base of the hair bundle. Although we observed changes in the bundle position in the latter case, no changes in the bundle spectra were detected in either type of experiment of this set.
Brownian motion of untreated bundles
At the beginning of each experiment, after the initial washout, two sets of spectra were recorded with an interval of 10–15 min between the sets to ensure the stability of the preparation. Brownian-motion spectra (Fig. 4) were similar in shape to those described earlier (Denk et al. 1989) for hair bundles of the bullfrog sacculus. The main components of the noise (Fig. 4, trace 4) emanate from off-focus bundles and tissue in the cone of laser light. The spectra recorded in HBSS varied from bundle to bundle in shape and amplitude but for any one bundle they remained stable during recording for up to 2½ h (Fig. 4, inset). The slope of the spectra on a double-logarithmic plot and the magnitude of the Brownian motion at frequencies above 2–4 kHz did not change with time or after the application of BAPTA, subtilisin or concanavalin A. This frequency region of the spectra is controlled by viscous damping (Denk et al. 1989), thus in our experiments the viscous damping remained unchanged.
Figure 4. Brownian motion displacement spectra of hair bundles.

Curves 1, 2 and 3 were obtained from 3 different hair bundles. Signals were scaled to displacement units using a 15 nm peak-to-peak calibration movement (the peak is not shown). Curve 2 has been multiplied by 2 for clarity. Curve 4 (background noise) was obtained from a point 2 μm adjacent to the bundle and scaled to the displacement using the coefficient of curve 1. The inset shows the ratio of displacement spectra obtained from the same hair bundle after and before 150 min of HBSS perfusion and inllustrates the stability of the preparation.
The distribution of square displacements, calculated according to eqn (9) for 102 bundles, was fitted with a Gaussian function (Fig. 5). The obtained distribution probably reflects the distribution of hair-bundle stiffness across bundles in the studied region of macula. The average r.m.s. displacement value of 4.3 ± 2.6 nm (mean ± s.d.) is close to the value of 3.5 nm reported for the tips of the longest stereocilia in the bullfrog sacculus (Denk et al. 1989). The corresponding absolute stiffness calculated from our data using eqn (10) is 0.9 ± 0.5 mN m−1 (mean ± s.d.), and rotational stiffness is 0.8 N rad−1. We attempted to fit the squared displacement spectra using the sum of two Lorentzian functions (Denk & Webb, 1992), or various empirical functions involving a single Lorentzian function and rational powers of the frequency. Although the latter usually provided a better fit compared to the two-Lorentzian function, we could not find a universal function with a sensible number of parameters that describes all the observed spectra and their change after the application of BAPTA or subtilisin. Hence, we used the ratio of the displacement density spectra after and before application to describe changes in the mechanical properties of the hair bundles.
Figure 5. Distribution of mean-square displacement for 102 hair bundles.

The displacement was calculated according to eqn (9) as an integral of the power spectral density over the frequency range 20 Hz to 10 kHz. The continuous curve is a Gaussian function with mean 18.5 nm2 and s.d. 14 nm2.
The effects of various agents on hair-bundle stiffness
After application of one or more of the agents, the Brownian-motion spectra changed. The ratio of spectra after and before the treatment (eqn (4)) was usually fitted well by the ratio of two Lorentzian functions. Taken over each set of experiments, coefficient a in eqn (6) was statistically close to 1, and ranged between 0.7 and 1.3 in individual experiments, thereby indicating that viscous damping had not been changed.
Concanavalin A
Previous experiments have shown that concanavalin A increases bundle stiffness by cross-linking glycoproteins on the stereocilia surfaces (Kössl et al. 1990). In our experiments, application of concanavalin A did not change the general shape of the spectrum, but reduced its amplitude (Fig. 6). Application of 0.3 μm of concanavalin A for 10 min resulted in a 1.8 ± 0.4-fold (mean ± s.d.) increase in stiffness (n = 19).
Figure 6. Displacement spectral density before (thick line) and after (thin line) application of 0.3 μm concanavalin A.

Inset shows the ratio of the spectra and fit to eqn (5).
BAPTA
After application of BAPTA, Brownian motion of the bundle increased and the spectra changed within the time interval (2–3 min) required for changing the solutions within the experimental chamber (Fig. 7). After a 10 min treatment, the stiffness reached 0.57 ± 0.18 (mean ± s.d., n = 27) of the original stiffness (Fig. 8). Subsequent recordings after up to 30 min of BAPTA perfusion (n = 12) or up to 20 min of HBSS washout (n = 5) did not show statistically significant changes in the spectra and the corresponding stiffness. As is discussed below, the BAPTA-induced reduction in hair-bundle stiffness is attributed to disruption of the tip links.
Figure 7. Ratio of spectra of hair bundles before (thick line) and after (thin line) 10 min of treatment with 5 mm BAPTA.

Inset shows the ratio of the spectra and fit to eqn (6).
Figure 8. Distributions of stiffness changes following BAPTA (▪) or subtilisin (□) application.

The relative stiffness was obtained according to eqn (7) from the fit of displacement ratio curves to eqn (6).
Subtilisin
Treatment with 50 mg l−1 subtilisin also caused an increase in the amplitude of hair-bundle Brownian motion. The spectra ratio curve differs in shape from that for BAPTA, particularly for frequencies below 50 Hz (Fig. 9). During the first 7–12 min following subtilisin application, Brownian motion was often stable or decreased by no more than 10–20% for frequencies below 50 Hz. After about 12 min the motion began to increase in the frequency range from 40 to 3000 Hz. The kinetics of the stiffness change was similar for different bundles. The stiffness decreased to 0.52 ± 0.14 (mean ± s.d., n = 35) of the initial stiffness value 40 min after the onset of the application (Fig. 8). Maintaining the tissue for up to 50 min in subtilisin or HBSS after the 40 min time point (n = 3) did not decrease the stiffness by more than a further 25%. The average rate of stiffness change in the first 40 min of application is equal to −0.012 ± 0.002 min−1, corresponding to −0.024 ± 0.004 if normalized to the maximum stiffness change (Fig. 10). However, the kinetics of the stiffness change is not linear. Possibly (see Discussion), the disruption or a major change in the stiffness of a link is a result of the independent cleavage of several chemical bonds. Power-function kinetics would then describe the change in the bundle stiffness. Fitting the initial part of the kinetic curve ξ(t) to a power function
Figure 9. Ratio of spectra before and after 12 (1), 30 (2) or 40 min (3) of subtilisin application.

Trace 4 was obtained after 20 min of HBSS washout following the 40 min subtilisin treatment. Each trace is an average of 3 to 4 individual measurements and is slightly smoothed. Continuous curves are fits of original data to eqn (6). The frequency range was restricted to 100 Hz to 6 kHz for the fitting of trace 1.
Figure 10. Kinetic curve for subtilisin-induced change of stiffness (•, ± s.d.) and intensity of immunofluorescence (see also Fig. 10) of utriculi labelled with anti-HCA (▵).

The stiffness curve is fitted according to eqn (11) (thick curve) and scaled error function (thin curve). The dotted line is a linear fit of the fluorescence kinetics. Time point 0 corresponds to the start of the subtilisin treatment. For the stiffness curve, each point is an average of 3 or more stiffness points of 5 or more hair bundles of different maculae. Y-axes are scaled so that saturating stiffness loss corresponds to zero fluorescence intensity.
where t is time after subtilisin application and p is the bond cleavage rate, we obtained α = 4.4 (Fig. 10). This value is an average number of the bonds that should be cleaved in a link to significantly change the link's stiffness. Here we assume the kinetics of the bond cleavage to be linear with the rate, p, equal to that of HCA loss.
Another possible explanation for the shape of the kinetic curve is that bonds in a link can be cleaved only in a particular order, or that subtilisin has access only to some restricted regions of a link. In both cases the time subtilisin treatment takes to break a link is likely to have a Gaussian distribution. We fitted a scaled error function with offset to the stiffness curve (Fig. 10) and estimated the time of a link breakage to be 24 ± 8 min (mean ± s.d.).
It is worth noting that there was no statistically significant stiffness change in the first 15 min of application, a period during which all of the ankle links disappear (Goodyear & Richardson, 1999).
Application of BAPTA after subtilisin or subtilisin after BAPTA
When BAPTA was applied after subtilisin or subtilisin was applied after BAPTA, the stiffness further decreased as a result of the application of the second solution (Fig. 11). Application of BAPTA after subtilisin caused the bundle to split into two or three parts in the first minute of the second treatment in seven out of nine preparations. In the two cases when the bundles remained intact, the stiffness reduction due to the BAPTA treatment was 38 ± 6% (n = 2), close to the value of 43% obtained with BAPTA alone. The subtilisin exposure time for BAPTA-treated bundles had to be reduced to 25 min to prevent bundle splitting. The stiffness decrease due to subtilisin was 32 ± 10% (n = 3), i.e. 1.5 times less than the 48% reduction in stiffness obtained for 40 min treatment with subtilisin alone, but very close to the 30% obtained as an estimate for a 25 min treatment from the kinetic data (Fig. 10). Data on sequential treatments show that the effects of BAPTA and subtilisin are additive, irrespective of the sequence of application.
Figure 11. Effects of subsequent treatments with subtilisin and BAPTA.

A, ratio of spectra before and after 8 min of subtilisin (1), 30 min of subtilisin (2), and following 5 and 10 min of BAPTA treatment (3 and 4, respectively). B, the ratio after 10 min of BAPTA (2), subsequent HBSS wash (3), and 25 min of subtilisin treatment (4). Control curve (1) was obtained as a ratio of two independent records before the treatments.
Immunofluorescence and transmission electron microscopy
Anti-HCA labelling showed a significant reduction in the maculae treated with subtilisin for 5–10 min and declined to background values in the maculae treated for 30–40 min (Figs 10 and 12). No changes in the labelling were detected in the control maculae incubated in HBSS for 5–40 min. Immunofluorescence intensity during 50 mg l−1 subtilisin treatment is fitted well by a linear function with a slope of −0.035 ± 0.012 min−1 (Fig. 10).
Figure 12. Effect of subtilisin treatment on anti-HCA labelling.
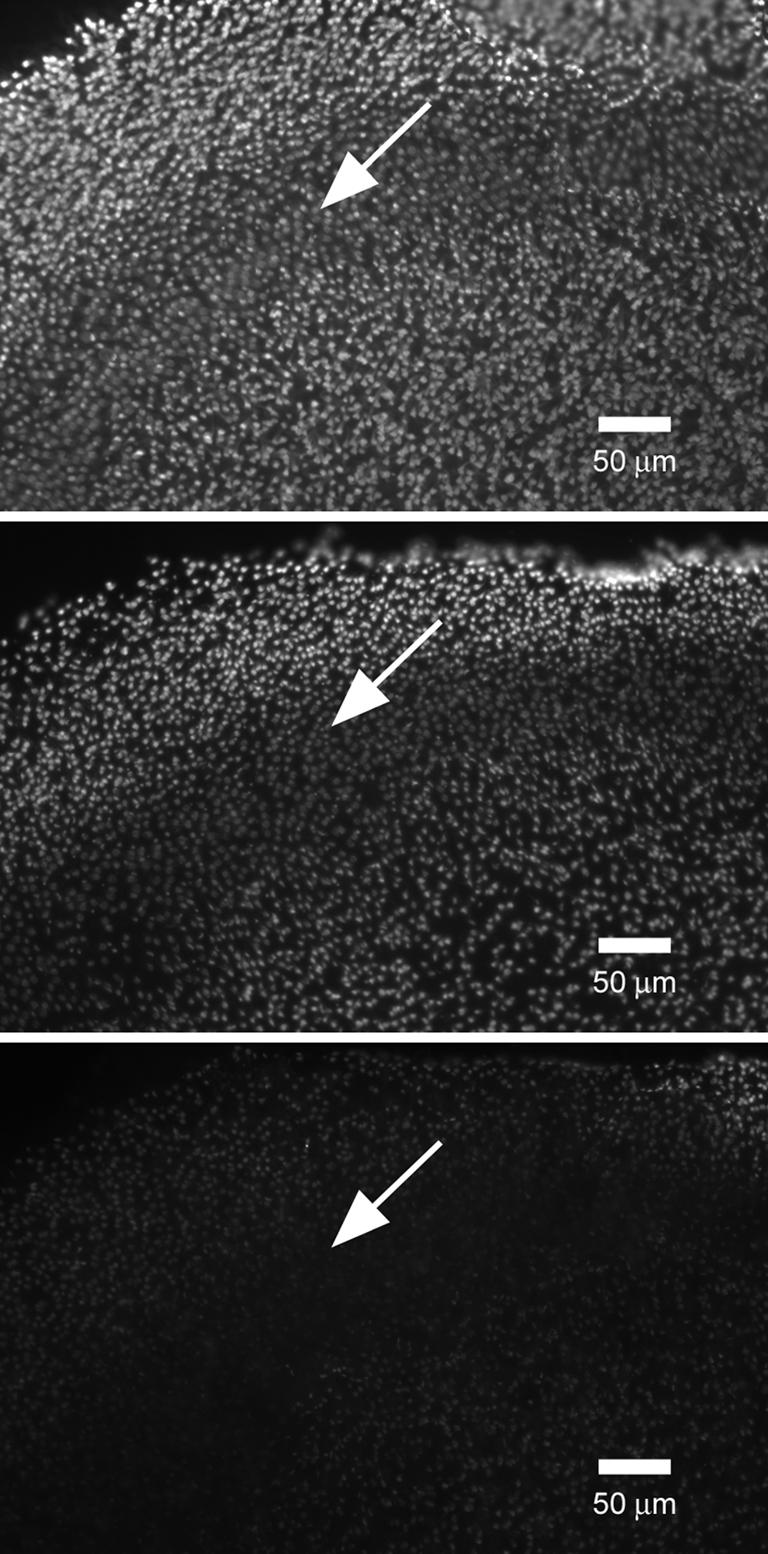
The time of subtilisin treatment is (from top to bottom) 0, 10 and 35 min. Arrows indicate striola. The focal plane is on the level of the cuticular plate.
Transmission electron microscopy (Fig. 13) showed that, in good agreement with Goodyear & Richardson (1999), 25 min of subtilisin treatment removes all ankle links and a significant proportion of the shaft connectors, leaving the tip links intact. BAPTA treatment for 10 min removes tip links and ankle links, but not shaft connectors. Sequential treatments, in any order, result in deletion of all three of these link types. BAPTA also cleaved kinocilial links (data not shown). Thus, horizontal top connectors are the only link type present after treatment with both BAPTA and subtilisin.
Figure 13. TEM images of upper part (top row, top 200 nm scale bar) and lower part (bottom row, bottom 200 nm scale bar) of striolar hair bundles.

BAPTA treatment for 10 min cleaves tip links (long arrows). Subtilisin treatment for 25 min removes ankle links (large arrowheads) and shaft connectors (small arrowheads). Horizontal top links (short arrows) are present after all types of treatment. This is the only type of link left after both sequential treatments. The type of treatment is indicated at the top of each column.
Discussion
The contribution of interstereocilial links to hair-bundle stiffness was deduced from the effects of BAPTA and subtilisin on the Brownian motion of chick vestibular hair bundles. Subtilisin and BAPTA reduce the stiffness of the hair bundles by 48 and 43%, respectively. The effects are additive within experimental error. Neither treatment has an effect on viscous damping. A comparison with previously published data (Goodyear & Richardson, 1999, 2003) indicates that the rapid loss of ankle links that occurs on exposure to subtilisin does not correspond to any detectable stiffness change.
Displacement density spectra of the chick vestibular hair bundles, when displayed on a double logarithmic plot, have slopes below the hair-bundle roll-off frequency ranging from −0.3 to −0.5, and slopes above it ranging from −0.7 to −1. These results are in a good agreement with the measurements of Denk et al. (1989) on bullfrog hair bundles. Our displacement density spectra, and indeed those measured from the bullfrog sacculus by Denk et al. (1989), are not fitted well by a single Lorentzian function. Thus, to find absolute stiffness we employed the equipartition theorem (Denk et al. 1989). However, motion at frequencies below 20 Hz, which we are not able to take into account, may contribute to the value of the integral in eqn (9). To find the relative stiffness change we calculated the ratio of spectra before and after treatments, which gave the full picture of the stiffness change across frequency. To obtain a single numeric measure of the relative stiffness we fitted the ratio of spectra by a ratio of two Lorentzian functions.
This approach tends to eliminate the effects of constant external and internal forces if they act on the bundle. It gives a simple analytical expression to calculate relative stiffness change at any frequency. It is not affected by variability in the corner frequencies of the bundles, and is therefore preferable over measurements made at a single frequency.
Disruption of tip links, ankle links and kinocilial links by the calcium chelator BAPTA causes a decrease in hair-bundle stiffness to 0.57 ± 0.18 of the original value. Our figure is in good agreement with the −4 dB change in the stiffness of chick cochlear hair bundles observed following the application of BAPTA (Pae & Saunders, 1994). The static stiffness of hair bundles in the bullfrog sacculus treated with BAPTA was also approximately half that of hair bundles perfused with 1 mm Ca2+ (Fig. 2 in Marquis & Hudspeth, 1997). Good agreement of the stiffness changes due to BAPTA treatment with earlier observations further validates our approach to stiffness measurements.
As a multivalent ligand that can bind to cell-surface glycoproteins, concanavalin A should cross-link the interstereocilial links and reduce their flexibility and/or mobility within the plane of the membrane. It may also form further molecular links between the membranes of adjacent stereocilia. The 1.8-fold increase in stiffness seen in this study following the application of concanavalin A shows that such additional cross-linking increases the overall stiffness of chick vestibular hair bundles. This value is half of the 3- to 5-fold increase reported by Kössl et al. (1990) for mouse cochlear hair bundles after the same treatment, possibly due to differences in the size, geometry and/or maturity of the hair bundles.
The effects of subtilisin reported here reveal that proteases that are used widely to remove overlying membranes and underlying stromal and neural tissue from hair cells could significantly change the mechanical properties of the bundles. However, when the utricles were exposed to 50 mg l−1 subtilisin for 15–20 min, which is the exposure time usually used to free hair cells from overlying and underlying tissue, hair-bundle stiffness changed by less than 10%. Longer application of subtilisin leads to a decrease in hair-bundle stiffness up to 48%. The most prominent changes in spectra were observed below 3 kHz, where Brownian motion is controlled by stiffness. No changes were detected in the range controlled by viscous damping of the external solution, suggesting negligible contribution of the viscoelasticity of the links in this range. Also, the links do not change significantly the viscous drag of the bundle, possibly because of their relatively small overall cross-section.
If a homogeneous population of links were uniformly digested by subtilisin without any spatial restrictions, one would expect the kinetics of link-loss to be close to linear, to observe direct proportionality between the loss of stiffness and immunofluorescence, and the normalized kinetics of link-loss and stiffness-decrease to be of equal slope. Although the loss of HCA is close to this prediction, the stiffness change is slower in the beginning and at the end of the treatment. To explain this discrepancy we employed two models, where link disruption results from either random cleavage of a number of chemical bonds per link, or sequential cleavage of several bonds. The sequence of cleavage could be determined by the chemical structure of the link, or spatial restrictions on the accessibility of particular bonds to subtilisin. The first model leads to the average value of 4.4 bonds per individual link. The final part of the kinetic curve does not fit, possibly, because the kinetics of bond cleavage deviate from linear, or a contribution from structures other than shaft connectors becomes noticeable. The second model gives an average time to break a link of 24 ± 8 min. Although the models are rough and reflect two extreme cases, both of them require a link to be an ordered structure rather then a random element of a network or a gel.
The other possibility is that the subtilisin-sensitive connectors are not uniform, different volumes or pools exhibiting different resistance or accessibility to subtilisin and different contribution to overall stiffness. Probably, only part of them is associated with HCA. There may be a pool of anti-HCA mAb immunoreactive hemi-shaft connectors between the stereocilia that do not contribute to hair-bundle stiffness (Goodyear & Richardson, 2003), but are more accessible to subtilisin than interstereociliary shaft connectors. This would slow down the initial segment of the stiffness-loss curve. Loss of the HCA may not reflect physical breakage of the shaft connector (i.e. the epitope may be located distal to the site of molecular interaction). Furthermore, the presence of cell-surface molecules, possibly charged components of the glycocalyx that do not appear as interstereociliary links but contribute to hair-bundle stiffness through electrostatic interactions (Dolgobrodov et al. 2000a,b), cannot be discounted.
Sequential application of BAPTA and subtilisin led to a further decrease in stiffness up to 30% of the original stiffness. Although stronger effects were not observed due to physical splitting of the bundles, the experiments show that the effects of subtilisin and BAPTA are additive in the measurable range of stiffness. If the additivity is still applicable for the treatments causing bundles to split, deletion of both subtilisin-sensitive and BAPTA-sensitive structures would result in 91% loss of stiffness. The rest of the bundle structure consists of stereocilia pivots at the base of the bundle and horizontal top connectors, and must contribute to the remaining 9% of the initial bundle stiffness.
Immunofluorescence data (Goodyear & Richardson, 2003) show that ankle links completely disappear within 15 min of subtilisin treatment, whereas our data do not show any stiffness changes at this time point. Thus, ankle link deletion does not appear to reduce the bundle stiffness. This finding is not surprising considering that the links are predominantly localized around the base of the bundle (Goodyear & Richardson, 1999) and do not confer significant mechanical advantage to influence rotational stiffness.
The results of this study reveal the relative contribution of subtilisin- and BAPTA-sensitive structures to the mechanical properties of the sensory hair bundle. They suggest that shaft connectors or other subtilisin-sensitive structures contribute 48% to stiffness, whereas BAPTA-sensitive structures, tip links, kinocilial links and ankle links, contribute 43% to the overall stiffness.
Acknowledgments
The work was supported by grants from BBSRC to I.J.R, The Wellcome Trust for R.J.G. and G.P.R. (grant no. 057410/Z/99Z) and a The Royal Society/NATO fellowship for M.E.B. We thank James Hartley and Richard Cox for technical assistance and Drs Andrei Lukashkin and Corné Kros for valuable discussions and a critical reading of an early version of the manuscript.
References
- Assad JA, Shepherd GMG, Corey DP. Tip-link integrity and mechanical transduction in vertebrate hair-cells. Neuron. 1991;7:985–994. doi: 10.1016/0896-6273(91)90343-x. [DOI] [PubMed] [Google Scholar]
- Crawford AC, Evans MG, Fettiplace R. The actions of calcium on the mechanoelectrical transducer current of turtle hair-cells. J Physiol. 1991;434:369–398. doi: 10.1113/jphysiol.1991.sp018475. [DOI] [PMC free article] [PubMed] [Google Scholar]
- Crawford AC, Fettiplace R. The mechanical-properties of ciliary bundles of turtle cochlear hair-cells. J Physiol. 1985;364:359–379. doi: 10.1113/jphysiol.1985.sp015750. [DOI] [PMC free article] [PubMed] [Google Scholar]
- Denk W, Webb WW. Optical measurement of picometer displacements of transparent microscopic objects. Appl Opt. 1990;29:2382–2391. doi: 10.1364/AO.29.002382. [DOI] [PubMed] [Google Scholar]
- Denk W, Webb WW. Forward and reverse transduction at the limit of sensitivity studied by correlating electrical and mechanical fluctuations in frog saccular hair-cells. Hear Res. 1992;60:89–102. doi: 10.1016/0378-5955(92)90062-r. [DOI] [PubMed] [Google Scholar]
- Denk W, Webb WW, Hudspeth AJ. Mechanical properties of sensory hair bundles are reflected in their Brownian motion measured with a laser differential interferometer. Proc Natl Acad Sci U S A. 1989;86:5371–5375. doi: 10.1073/pnas.86.14.5371. [DOI] [PMC free article] [PubMed] [Google Scholar]
- Dolgobrodov SG, Lukashkin AN, Russell IJ. Electrostatic interaction between stereocilia. I. Its role in supporting the structure of the hair bundle. Hear Res. 2000a;150:83–93. doi: 10.1016/s0378-5955(00)00184-2. [DOI] [PubMed] [Google Scholar]
- Dolgobrodov SG, Lukashkin AN, Russell IJ. Electrostatic interaction between stereocilia. II. Influence on the mechanical properties of the hair bundle. Hear Res. 2000b;150:94–103. doi: 10.1016/s0378-5955(00)00196-9. [DOI] [PubMed] [Google Scholar]
- Duncan RK, Dyce OM, Saunders JC. Low calcium abolishes tip links and alters relative stereocilia motion in chick cochlear hair cells. Hear Res. 1998;124:69–77. doi: 10.1016/s0378-5955(98)00118-x. [DOI] [PubMed] [Google Scholar]
- Duncan RK, Hernandez HN, Saunders JC. Relative stereocilia motion of chick cochlear hair cells during high-frequency water-jet stimulation. Audit Neurosci. 1995;1:321–329. [Google Scholar]
- Eisen MD, Duncan RK, Saunders JC. The tip link's role in asymmetric stereocilia motion of chick cochlear hair cells. Hear Res. 1999;127:14–21. doi: 10.1016/s0378-5955(98)00167-1. [DOI] [PubMed] [Google Scholar]
- Flock A, Strelioff D. Graded and nonlinear mechanical-properties of sensory hairs in the mammalian hearing organ. Nature. 1984;310:597–599. doi: 10.1038/310597a0. [DOI] [PubMed] [Google Scholar]
- Frank JE, Markin V, Jaramillo F. Characterization of adaptation motors in saccular cells by fluctuation analysis. Biophys J. 2002;83:3188–3201. doi: 10.1016/S0006-3495(02)75321-6. [DOI] [PMC free article] [PubMed] [Google Scholar]
- Gale JE, Marcotti W, Kennedy HJ, Kros CJ, Richardson GP. FM1-43 dye behaves as a permeant blocker of the mechanotransducer channel of the hair cell. J Neurosci. 2001;21:1–13. doi: 10.1523/JNEUROSCI.21-18-07013.2001. [DOI] [PMC free article] [PubMed] [Google Scholar]
- Goodyear R, Richardson G. Distributon of the 275 kD hair cell antigen and cell surface specialisations on auditory and vestibular hair bundles in the chicken inner ear. J Comp Neurol. 1992;325:243–256. doi: 10.1002/cne.903250208. [DOI] [PubMed] [Google Scholar]
- Goodyear R, Richardson G. The ankle-link antigen: an epitope sensitive to calcium chelation associated with the hair-cell surface and the calycal processes of photoreceptors. J Neurosci. 1999;19:3761–3772. doi: 10.1523/JNEUROSCI.19-10-03761.1999. [DOI] [PMC free article] [PubMed] [Google Scholar]
- Goodyear R, Richardson G. A novel antigen sensitive to calcium chelation that is associated with the tip links and kinocilial links of sensory hair bundles. J Neurosci. 2003;23:4878–4887. doi: 10.1523/JNEUROSCI.23-12-04878.2003. [DOI] [PMC free article] [PubMed] [Google Scholar]
- Hirokawa N, Tilney LG. Interactions between actin-filaments and between actin-filaments and membranes in quick-frozen and deeply etched hair-cells of the chick ear. J Cell Biol. 1982;95:249–261. doi: 10.1083/jcb.95.1.249. [DOI] [PMC free article] [PubMed] [Google Scholar]
- Howard J, Ashmore JF. Stiffness of sensory hair bundles in the sacculus of the frog. Hear Res. 1986;23:93–104. doi: 10.1016/0378-5955(86)90178-4. [DOI] [PubMed] [Google Scholar]
- Howard J, Hudspeth AJ. Compliance of the hair bundle associated with gating of mechanoelectrical transduction channels in the bullfrogs saccular hair cell. Neuron. 1988;1:189–199. doi: 10.1016/0896-6273(88)90139-0. [DOI] [PubMed] [Google Scholar]
- Kössl M, Richardson GP, Russell IJ. Stereocilia bundle stiffness – effects of neomycin sulphate, a23187 and Concanavalin-A. Hear Res. 1990;44:217–229. doi: 10.1016/0378-5955(90)90082-z. [DOI] [PubMed] [Google Scholar]
- Langer MG, Fink S, Koitschev A, Rexhausen U, Horber JKH, Ruppersberg JP. Lateral mechanical coupling of stereocilia in cochlear hair bundles. Biophys J. 2001;80:2608–2621. doi: 10.1016/s0006-3495(01)76231-5. [DOI] [PMC free article] [PubMed] [Google Scholar]
- Marquis RE, Hudspeth AJ. Effects of extracellular Ca2+ concentration on hair-bundle stiffness and gating spring integrity in hair cells. Proc Natl Acad Sci U S A. 1997;94:11923–11928. doi: 10.1073/pnas.94.22.11923. [DOI] [PMC free article] [PubMed] [Google Scholar]
- Meyer J, Mack AF, Gummer AW. Pronounced infracuticular endocytosis in mammalian outer hair cells. Hear Res. 2001;161:10–22. doi: 10.1016/s0378-5955(01)00338-0. [DOI] [PubMed] [Google Scholar]
- Nagel G, Neugebauer DC, Schmidt B, Thurm U. Structures transmitting stimulatory force to the sensory hairs of vestibular ampullae of fishes and frog. Cell Tissue Res. 1991;265:567–578. [Google Scholar]
- Osborne MP, Comis SD, Pickles JO. Morphology and cross-linkage of stereocilia in the guinea-pig labyrinth examined without the use of osmium as a fixative. Cell Tissue Res. 1984;237:43–48. doi: 10.1007/BF00229198. [DOI] [PubMed] [Google Scholar]
- Pae SS, Saunders JC. Intracellular and extracellular calcium modulates stereocilia stiffness on chick cochlear hair-cells. Proc Natl Acad Sci U S A. 1994;91:1153–1157. doi: 10.1073/pnas.91.3.1153. [DOI] [PMC free article] [PubMed] [Google Scholar]
- Pickles JO, Brix J, Comis SD, Giech O, Köppl C, Manley GA, Osborne MP. The organisation of tip links and stereocilia on hair cells of bird and lisard basilar papilla. Hear Res. 1989;41:31–42. doi: 10.1016/0378-5955(89)90176-7. [DOI] [PubMed] [Google Scholar]
- Pickles JO, Comis SD, Osborne MP. Cross-links between stereocilia in the guinea-pig organ of Corti, and their possible relation to sensory transduction. Hear Res. 1984;15:103–112. doi: 10.1016/0378-5955(84)90041-8. [DOI] [PubMed] [Google Scholar]
- Russell IJ, Kössl M, Richardson GP. Nonlinear mechanical responses of mouse cochlear hair bundles. Proc R Soc Lond B. 1992;250:217–227. doi: 10.1098/rspb.1992.0152. [DOI] [PubMed] [Google Scholar]
- Saunders JS, Szymko YM. The design, calibration, and use of a water microjet for stimulating hair cell sensory hair bundles. J Am Audiol Soc. 1989;86:1797–1804. doi: 10.1121/1.398612. [DOI] [PubMed] [Google Scholar]
- Strelioff D, Flock A. Stiffness of sensory-cell hair bundles in the isolated guinea-pig cochlea. Hear Res. 1984;15:19–28. doi: 10.1016/0378-5955(84)90221-1. [DOI] [PubMed] [Google Scholar]
- Szymko YM, Dimitri PS, Saunders JC. Stiffness of hair bundles in the chick cochlea. Hear Res. 1992;59:241–249. doi: 10.1016/0378-5955(92)90120-c. [DOI] [PubMed] [Google Scholar]