Abstract
Radiological modalities, especially CT, mainly provide morphological and structural information with high spatial resolution covering large volumes. Novel developments, which are predominantly MR-based, also deliver ‘functional’ information, which can be used for individual characterisation of tumour biology. Both aspects and modalities, additionally complemented by ultrasound, have to be combined in the radiological workflow of cancer patients including volumetric visualisation, information extraction from multimodal imaging, quantitative surrogates, intelligent interpretation assistance and image-guided procedures. Based on volumetric visualisation and the generation of 3D +t maps, CAD tools have to address registration of different image series from different modalities, and extraction of quantitative surrogates. The latter will then serve tumour characterisation, therapeutic decision-making, image-guided procedures and efficacy evaluation.
Keywords: Multimodal imaging, computer assisted diagnosis, tumour characterisation
Introduction
Radiology is one of the main drivers for the increasing computerisation in medicine. Large digital data volumes require more and more computer assistance, which can be applied at multiple levels. The following steps are important: workflow, volumetric visualisation, information extraction from multimodal imaging, quantitative surrogates, intelligent interpretation assistance and image-guided procedures. All of them are particularly relevant in cancer imaging, which comprises coverage of large volumes, multiple follow-up examinations using different modalities and large patient populations. However, the current status of development and application is highly variable among different tumour entities and levels of the workflow.
Workflow
Workflow refers to the general environment defined by integrating the health enterprise (IHE) initiative. It comprises a hospital information system (HIS), radiology information system (RIS) and picture archiving and communication systems (PACS) including patient registration, service ordering, appointment scheduling, work lists, structured reporting, etc. [1]. Implementation of communication standards for the workflow is essential for high patient throughput for acquisitions and measurements, e.g. in follow-up of cancer patients.
Volumetric visualisation
Clinical imaging in cancer patients nowadays mainly consists of digital radiography, CT, MRI and ultrasound. Digital radiography is mainly used for special applications, such as chest radiography for the follow-up of lung cancer and the detection of complications during chemotherapy (pneumonia) or for digital mammography. CT is the predominant morphological imaging modality. Novel volume acquisitions with almost isotropic voxels provided by multislice CT enable a real volumetric approach to imaging data [2, 3]. The large amount of source images represent an incredible reading load for the radiologist and is unacceptable for clinical partners. Thus, condensation of information from volumetric CT acquisitions with high spatial resolution is mandatory and a major driver for the development and implementation of dedicated computer assisted diagnosis (CAD) tools. In the first place they will provide enhanced viewing of morphology, such as multiplanar reformations, thin- or thick-slab maximum intensity projections, volume rendering, fly through, etc. Such tools have already gained acceptance in oncological radiology, e.g. for virtual colonoscopy [4], and assessment of pulmonary nodules [5]. MRI and ultrasound only serve as complementary imaging modalities for the volumetric visualisation of tumour morphology.
Information extraction from multimodal imaging
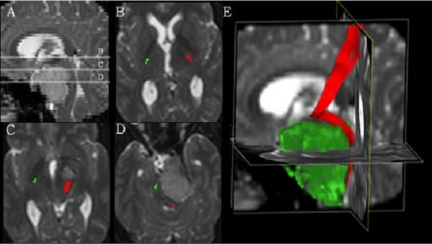
Beyond condensation of imaging findings from a single image series, extraction of information from a stack of different series or modalities should be a coherent development to fully exploit the potential of complementary functional imaging in oncology, e.g. PET/CT, MRI and MRS (chemical shift imaging) [6]. Thus, the acquisition of dynamic scans for the evaluation of contrast enhancement over time within the tumour or tumour motion prior to radiotherapy generates a high number of images. Even a qualitative or semi-quantitative assessment of these data require CAD tools to extract the information [7], detect and represent changes which might be rather subtle. The information to be extracted is ‘functional’ in a broader sense. In MRI, besides series with high spatial resolution and visualisation of morphology, which is mainly provided by T1-weighted sequences, multiple additional series are acquired. Each of the series aims at the visualisation or indirect detection of special properties of the tissue of interest, e.g. T2-weighted or inversion recovery sequences aim at demonstration of tissue or tissue components with a high amount of fluid. Time resolved series acquired during and after contrast administration are used as MR angiography and visualise the vasculature and the individual contributions of certain vascular territories at the same time. Different sequences, which are also performed during and after contrast administration, aim at the detection of microcirculation at the tissue level, i.e. perfusion. ‘Perfusion’ MR imaging can be implemented by the use of different contrast agents, extracellular or intravascular, or even different contrast mechanisms, T1-weighted or T2 *-weighted. From such series, perfusion can be assessed qualitatively by visual assessment, semi-quantitatively by evaluation of signal intensity or signal to noise ratio curves over time, e.g. the so-called three-point method, or by quantitative approaches that make use of more sophisticated pharmacokinetic modelling [8] (see below). Similar evaluations of tumour perfusion are feasible by the application of contrast-enhanced ultrasound which uses an intravascular contrast agent as tracer. Other time resolved acquisition protocols allow for assessment of motion of organs and tumours. Respiratory motion is a major component in this regard. It might have substantial effects on radiotherapy planning, especially when high precision approaches are used [9]. Vascular and cardiac pulsation are also important functional parameters in the field of non-oncological radiology. MRI can further characterise different tissue components by the use of diffusion weighted sequences, including the use of diffusion tensor imaging. It can be used for tractography while providing dedicated information about localisation and orientation of brain fibres, such as the pyramidal tracts [10]. They might be displaced by the mass effect of tumours, but it is important to know their exact position prior to neurosurgical interventions or stereotactic radiotherapy (Fig. 1).
Figure 1.
Diffusion tensor imaging (DTI) in a patient with a suprasellar mass. (A) A sagittal reformat indicating the level of the transaxial slices (B–D). The normal course of the pyramid tract on the right is colour-coded in green, whereas the left pyramid tract, colour-coded in red, is atypically displaced by the mass; (E) a sagittal display of the displacement of the left pyramid tract (red) caused by the mass (shown here in green) (courtesy of Bram Stieltjes, DKFZ).
Quantitative surrogates
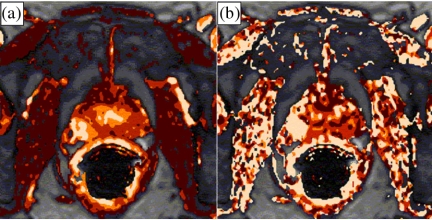
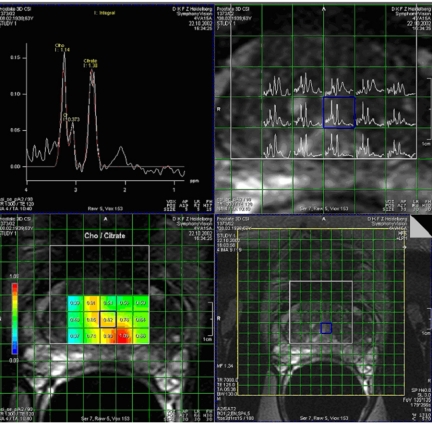
Besides molecular imaging of individual tumours, downstream surrogates of tumour biology, such as perfusion MR imaging will play an important role in oncological radiology. Perfusion (amplitude) corresponds to microvessel density, whereas the exchange constant corresponds to vascular permeability (kep) (Fig. 2) [11]. Both are indicators for the angiogenic potential of the tumour. To be considered for treatment decisions or evaluation of therapeutic effects, however, quantitation is essential. It requires profound pharmacokinetic modelling and leads to a better understanding of tumour biology. The measurement of hypoxia within tumours is also of great interest in oncology. As it has a tremendous influence on the radiosensitivity of the tumour, it is especially attractive to be employed in radiotherapy planning. Techniques based on blood and tissue oxygenation, which are mainly used in functional MRI of the brain, are transferred to oncological applications, and quantitation is feasible. Quantitative insights into the metabolism of tumour tissue can also be achieved by MR spectroscopy. Shifts in the distribution of certain metabolites provide important hints towards the differential diagnosis and the tumour biological behaviour at the same time. In MR of the prostate, the loss of citrate or an increase of the choline /citrate ratio are important indicators for prostate cancer (Fig. 3) [6]. The appearance of peaks representing lipids are related to necrosis within the tumour.
Figure 2.
Parameter maps derived from dynamic MRI in a patient with prostate cancer. (a) The amplitude map shows an increase in the peripheral gland on the right (arrow) indicating hyperperfusion. (b) The map of the exchange constant (kep) also shows an increase in the same area (arrow) indicating increased vascular permeability. Both findings raise suspicion of prostate cancer (courtesy of Stefan Delorme, DKFZ).
Figure 3.
MR spectroscopy and chemical shift imaging (CSI) of a patient with prostate cancer. MR spectrum (top left) from the cancerous area shows a reduction of the citrate peak together with an increase in the choline peak, i.e. an increase in the choline  citrate ratio. The spectra are acquired for several voxels covering the prostate (top right) and the results of the choline
  citrate ratio can be overlaid as a colour-coded map with the cancer shown in red (bottom left) with a morphological reference (bottom right) (courtesy of Christian Zechmann, DKFZ).
Intelligent interpretation assistance
Intelligent interpretation assistance can rely on the combination and registration of extracted information and quantitative surrogate markers [6]. A major effort has to be made to bring together all the information provided by the individual series within MRI as well as by the different modalities. Registration of the data sets provided by different modalities is a major first step. The better the matching of the anatomical structures, the better the regional interpretation and the possible application of such matched or fused images for image-guided therapy. CT will serve as the anatomical backbone due to its high spatial resolution. This has to be merged with the extensive amount of microstructural, functional and metabolic information provided by MR and PET. Present CAD tools are more proving the concept than representing solutions. A major challenge for the radiological community will be verification of the accuracy of information extraction. In addition, the implementation of novel image-based surrogate markers is a major task within the multidisciplinary concept of tumour diagnosis and follow-up of dedicated therapies. The increasing introduction of individualized concepts for therapy, which will then be also based on molecular markers, will to a high degree rely on multimodal functional and metabolic imaging. Once achieved, this will facilitate interpretation of the findings significantly, and finally clinical acceptance of the different functional acquisitions will be gained.
More sophisticated and comprehensive approaches will actually integrate imaging and non-imaging information and thus merge different worlds within the life sciences. Radiology will provide morphological/structural information as well as functional data, such as perfusion or metabolism. It will come in three dimensions, covering two different volumes: (1) ‘whole body’ volume for staging normally from head to groin as well as (2) ‘whole tumour’ volume for assessment of ‘functional’ heterogeneities within the individual tumour manifestations. In contrast, molecular biology tests are being carried out using blood samples without any information regarding localisation and size of a tumour or histological specimens which only represent a small two-dimensional aspect of generalised malignant disease. This situation calls for integration of such markers in large databases to derive a comprehensive picture of predisposition, aggressiveness or therapy response. Neural networks might be one way to mine such data.
Image-guided procedures
Image-guided procedures are leading the pace for the introduction of minimal invasive interventions. All the steps mentioned above are important contributors for the implementation of image-guided procedures. Based on visualisation and information extraction from multimodal imaging, the best access path for biopsy or resection of a tumour can be planned and performed. Such tools have already been used extensively for the central nervous system, e.g. stereotactic biopsy or radiotherapy. Biopsies and radiotherapy boosts can even be guided to the very aggressive regions within the tumour, such as for ‘dose painting’. Recently, more and more extracranial applications have been introduced, such as for tissue sparing resection or ablation of liver metastases (Fig. 4) [12] or renal cell carcinoma. Here individual vascular anatomy as well as organ and tumour motion have also to be taken into account. Quantitative surrogate markers are to be included for post-interventional follow-up studies to assess treatment success. Integration of non-imaging data is important for decision-making and selection of minimal invasive image-guided procedures.
Figure 4.
(a) Volumetric visualisation of the liver, vascular trees of portal and hepatic veins and two hepatic metastasis; (b) volumetric demonstration of safety margins for surgical metastasectomy; (c) volumetric demonstration of size and shape of liver segments to be resected according to safety margins and vascular supply (courtesy of Matthias Thorn, DKFZ).
Conclusion
Besides mere volumetric visualisation of morphology and structure, CT, and to a much higher degree MRI, are capable of providing ‘functional’ information for individual characterisation of tumour biology. Volumetric visualisation is accomplished by acquisition of three-dimensional data sets with high spatial resolution. Adding the dynamic temporal component to such acquisition allows 3D +t maps to be generated, e.g. for tumour perfusion. Two important tasks are to be solved by CAD tools: (1) registration of different image series from different modalities, and (2) extraction of quantitative surrogates which can be used for tumour characterisation, therapeutic decision-making, image-guided procedures and efficacy evaluation.
References
- 1.Hussein R, Engelmann U, Schroeter A, Meinzer H. Implementing a full-feature PACS solution in accordance with the IHE technical framework: the CHILI approach. Acad Radiol. 2004;11:439–47. doi: 10.1016/s1076-6332(03)00821-3. [DOI] [PubMed] [Google Scholar]
- 2.Rubin GD, Napel S, Leung AN. Volumetric analysis of volumetric data: achieving a paradigm shift. Radiology. 1996;200:312–7. doi: 10.1148/radiology.200.2.8685316. [DOI] [PubMed] [Google Scholar]
- 3.Prasad SR, Jhaveri KS, Saini S, Hahn PF, Halpern EF, Sumner JE. CT tumor measurement for therapeutic response assessment: comparison of unidimensional, bidimensional, and volumetric techniques initial observations. Radiology. 2002;225:416–9. doi: 10.1148/radiol.2252011604. [DOI] [PubMed] [Google Scholar]
- 4.Pickhardt PJ, Choi JR, Hwang I, et al. Computed tomographic virtual colonoscopy to screen for colorectal neoplasia in asymptomatic adults. N Engl J Med. 2003;349:2191–200. doi: 10.1056/NEJMoa031618. [DOI] [PubMed] [Google Scholar]
- 5.Diederich S, Thomas M, Semik M, et al. Screening for early lung cancer with low-dose spiral computed tomography: results of annual follow-up examinations in asymptomatic smokers. Eur Radiol. 2004;14:691–702. doi: 10.1007/s00330-003-2200-5. [DOI] [PubMed] [Google Scholar]
- 6.van Dorsten FA, van der Graaf M, Engelbrecht MR, et al. Combined quantitative dynamic contrast-enhanced MR imaging and (1)H MR spectroscopic imaging of human prostate cancer. J Magn Reson Imaging. 2004;20:279–87. doi: 10.1002/jmri.20113. [DOI] [PubMed] [Google Scholar]
- 7.Achenbach T, Vomweg T, Heussel C, Thelen M, Kauczor H. Computer aided diagnosis in chest radiology—current topics and techniques. Fortschr Rontgenstr. 2003;175:1471–81. doi: 10.1055/s-2003-43398. [DOI] [PubMed] [Google Scholar]
- 8.Furman-Haran E, Degani H. Parametric analysis of breast MRI. J Comput Assist Tomogr. 2002;26:376–86. doi: 10.1097/00004728-200205000-00012. [DOI] [PubMed] [Google Scholar]
- 9.Plathow C, Ley S, Fink C, et al. Analysis of intrathoracic tumor mobility during whole breathing cycle by dynamic MRI. Int J Radiat Oncol Biol Phys. 2004;59:952–9. doi: 10.1016/j.ijrobp.2003.12.035. [DOI] [PubMed] [Google Scholar]
- 10.Mori S, Kaufmann WE, Davatzikos C, et al. Imaging cortical association tracts in the human brain using diffusion-tensor-based axonal tracking. Magn Reson Med. 2002;47:215–23. doi: 10.1002/mrm.10074. [DOI] [PubMed] [Google Scholar]
- 11.Kiessling F, Farhan N, Lichy MP, et al. Dynamic contrast-enhanced magnetic resonance imaging rapidly indicates vessel regression in human squamous cell carcinomas grown in nude mice caused by VEGF receptor 2 blockade with DC101. Neoplasia. 2004;6:213–23. doi: 10.1593/neo.3394. [DOI] [PMC free article] [PubMed] [Google Scholar]
- 12.Lamade W, Vetter M, Hassenpflug P, Thorn M, Meinzer HP, Herfarth C. Navigation and image-guided HBP surgery: a review and preview. J Hepatobiliary Pancreat Surg. 2002;9:592–9. doi: 10.1007/s005340200079. [DOI] [PubMed] [Google Scholar]


