Abstract
The carotid body (CB) chemoreceptors may play an important role in the enhanced hypoxic ventilatory response induced by chronic intermittent hypoxia (CIH). We studied the effects of cyclic hypoxic episodes of short duration on cat cardiorespiratory reflexes, heart rate variability, and CB chemosensory activity. Cats were exposed to cyclic hypoxic episodes (PO2 ∼ 75 Torr) repeated during 8 h for 2–4 days. Cats were anaesthetized with sodium pentobarbitone (40 mg kg−1 i.p., followed by 8–12 mg i.v.), and ventilatory and cardiovascular responses to NaCN (0.1–100 μg kg−1 i.v.) and several isocapnic levels of oxygen (PO2 ∼ 20–740 Torr) were studied. After studying the reflex responses, we recorded the CB chemosensory responses induced by the same stimuli. Results showed that CIH for 4 days selectively enhanced cat CB ventilatory (VT and VI) responses to hypoxia, while responses to NaCN remained largely unchanged. Similarly, basal CB discharges and responses to acute hypoxia (PO2 < 100 Torr) were larger in CIH than in control cats, without modification of the responses to NaCN. Exposure to CIH did not increase basal arterial pressure, heart rate, or their changes induced by acute hypoxia or hyperoxia. However, the spectral analysis of heart rate variability of CIH cats showed a marked increase of the low-/high-frequency ratio and an increase of the power spectral distribution of low frequencies of heart rate variability. Thus, the enhanced CB reactivity to hypoxia may contribute to the augmented ventilatory response to hypoxia, as well as to modified heart rate variability due to early changes in autonomic activity.
Exposure of humans and animals to sustained hypoxia for hours or days is usually known as chronic hypoxia. However, cyclic hypoxic episodes of short duration followed by normoxia, termed chronic intermittent hypoxia (CIH), have received much attention in recent years (Fletcher, 2000; Sica et al. 2000; Prabhakar et al. 2001; Prabhakar & Peng, 2004). This pattern of CIH is a characteristic of pathological conditions such as obstructive sleep apnoea (OSA). CIH appears to enhance the hypoxic ventilatory response (HVR), leading to hypertension and upregulation of catecholaminergic and renin–angiotensin systems (Fletcher, 2000; Sica et al. 2000; Prabhakar et al. 2001). Most of the information on the effects of CIH on peripheral chemoreflex control of cardiovascular and respiratory systems has been obtained from studies performed on patients with OSA. However, conclusions from these studies are conflicting because of concomitant effects of morbidities associated with OSA (Narkiewicz et al. 1999). More recently, experiments performed in animal models showed that CIH enhances HVR (Ling et al. 2001) and produces long-term facilitation of respiratory motor activity (McGuire et al. 2003; Peng & Prabhakar, 2003). The facilitatory effect of CIH on HVR has been attributed to a potentiation of carotid body (CB) chemosensory responses to hypoxia. However, it is a matter of debate whether the effects induced by CIH on HVR are due to a CB-enhanced activity or secondary to central facilitation of chemosensory input (Mitchell et al. 2001). Recently, Peng et al. (2001, 2003) found that basal CB discharges and chemosensory responses to acute hypoxia were larger in rats exposed to a pattern of CIH of short cyclic hypoxic episodes followed by normoxia, applied for 8 h each day for 10 days. Nevertheless, this observation has not been confirmed in other animal models of CIH. The ventilatory response to hypoxia does not only depend on the pattern, duration and intensity of hypoxic stimuli, but species differences may also account for the reported disparities in time course and excitatory or inhibitory effects of hypoxia on ventilation (Powell et al. 1998, 2000). Using a protocol of short hypoxic episodes, we examined the early effects of CIH (2–4 days) on cat cardiorespiratory reflexes and CB chemosensory responses induced by hypoxia, and compared them with the responses elicited by NaCN.
Methods
Animals
Experiments were performed on 19 male adult cats (2.0–4.7 kg). The experimental protocol was approved by the Ethical Committee of the Facultad de Ciencias Biológicas of the Pontificia Universidad Católica de Chile, and was performed according to the Guiding Principles for the Care and Use of Animals of the American Physiological Society.
Exposure to multiple short episodes of chronic intermittent hypoxia (CIH)
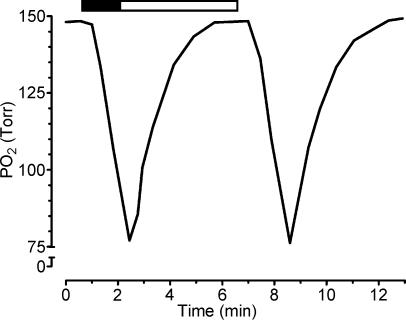
Nine awake male cats (3.35 ± 0.26 kg; mean ± s.e.m.) were housed in a Plexiglas cylindrical chamber, with internal dimensions of 30 cm in diameter and 60 cm long, yielding a volume of 35.2 l. The chamber was alternately flushed with 100% N2 (13 l min−1) for 90 s or compressed air (20 l min−1) for 270 s, using timed solenoid valves. This gas alternation in the chamber produced a see-saw pattern of PO2, which dropped to a minimum of ∼75 Torr in about 100 s and then slowly returned to near 150 Torr, reducing the PO2 below 125 and 100 Torr for 140 and 60 s, respectively (Fig. 1). The intermittent hypoxic pattern was repeated 10 times an hour for 8 h day−1 for 2 days (2 cats) or 4 days (7 cats). The PO2 in the chamber was monitored using an oxygen analyser (Ohmeda 5120, Madison, WI, USA). Acute experiments were performed the morning of the day after the end of hypoxic exposures. As a control group, ten male cats (3.62 ± 0.22 kg) were kept in normoxic conditions; two of them were subjected to a similar pattern of gas dynamics in the chamber, replacing N2 by compressed air. We did not find any difference in the basal ventilatory and cardiovascular variables and in the responses to hypoxia (one-way ANOVA, P > 0.05) between these latter two groups, so their data were pooled together as the control group.
Figure 1. Changes of PO2 levels in the chamber induced by the hypoxic challenge.
The hypoxic pattern consisted of 90 s of 100% N2 (▪) followed by 270 s of room air (□), repeated 10 times h−1 8 h day−1 for 4 days. PO2 reached a minimum of about 75 Torr during hypoxia. The level of PO2 in the chamber was monitored with an oxygen analyser.
Recording of physiological responses
Cats were anaesthetized with sodium pentobarbitone (40 mg kg−1 i.p.), additional doses (8–12 mg i.v.) were given when necessary to maintain a level of surgical anaesthesia (stage III, plane 2) assessed by the absence of withdrawal reflexes to strong pressure on the paws, with persistence of patellar reflexes. Cats were placed in supine position and the body temperature was continuously monitored through a thermistor probe introduced into the rectum, and maintained at 38.0 ± 0.5°C with a heated pad. The trachea was cannulated with a flexible tube for recording the airflow signal with a pneumotachograph (Fleish number 00, Lausanne, Switzerland). A fine tube was introduced into the tracheal cannula for continuous sampling of the tracheal CO2 pressure (PET,CO2) through a capnograph (Poet II Criticare CSI, WI, USA). One saphenous vein was cannulated for administration of drugs. Arterial blood pressure was recorded from one femoral artery through a cannula filled with 50 IU ml−1 of heparin in saline solution, and connected to a pressure transducer (Statham P23, Oxnard, CA, USA). The ECG was continuously recorded using the II lead. All the physiological variables were fed to an analog-digital system (PowerLAB/8SP, AD Instruments, Castle Hill, Australia), connected to a computer. Minute inspiratory volume (Vi), tidal volume (Vt) and respiratory frequency (fr) were digitally obtained from the airflow signal. Heart rate (fh) was obtained from the ECG, and mean arterial pressure (BP) from the arterial pressure signal. The physiological data were analysed using Chart 5.0 software (AD Instruments, Castle Hill, NSW, Australia). To assess the effects of CIH on sensitivity and reactivity of peripheral chemoreceptor reflexes, we studied the cardiovascular (BP, fh) and ventilatory (Vi,Vt, fr) responses elicited by several isocapnic levels of PO2 (∼20–740 Torr) maintained during 1–2 min and by i.v. injections of NaCN (0.1–100 µg kg−1).
Carotid body chemosensory recordings
After finishing the study of cardiorespiratory reflexes, the carotid chemosensory discharge was recorded in some cats as previously described (Iturriaga et al. 1998). One carotid sinus nerve and the ipsilateral ganglio-glomerular nerves were dissected and cut. After the excision of the epineurium, the carotid sinus nerve was placed on a pair of platinum electrodes and covered with warm mineral oil. The neural signal was pre-amplified (Grass P511, West Warwick, RI, USA), with a bandwidth of 30 Hz–1 kHz, amplified, filtered (notch filter of 50 Hz), and fed to an electronic spike-amplitude discriminator. This procedure allows the selection of action potentials of given amplitude above the noise to be counted with a frequency meter for assessing the frequency of CB chemosensory discharge (fx), expressed in Hz. Carotid sinus barosensory fibres were eliminated by crushing the common carotid artery wall between the carotid sinus and the CB. The chemosensory discharge was measured at several isocapnic levels of PO2 (∼20–740 Torr), maintained for 1–2 min, and during i.v. injections of NaCN (0.1–100 μg kg−1). Cats breathed spontaneously during the experiments. We did not neuromuscularly block cats because cholinergic blockers impair CB chemosensory chemoreception to hypoxia (Jonsson et al. 2000). In some experiments, the contralateral carotid sinus nerve was also cut to prevent vascular and ventilatory effects caused by the activation of chemosensory reflexes. At the end of the experiments, cats were killed by an overdose of sodium pentobarbitone (120 mg i.v.) administered until the ventilation and ECG were completely abolished and the arterial pressure decreased to zero.
Spectral analysis of heart rate variability
Under anaesthesia and prior to any manoeuvre or drug injection, the ECG was recorded for 5 min at 2 kHz. After acquisition of the ECG, the signal was visually explored for detection of ectopic QRS complexes and the RR intervals were measured and converted to ASCII format. The heart rate variability was analysed with software created by The Biomedical Signal Analysis Group, Department of Applied Physics, University of Kuopio, Finland (Tarvainen et al. 2002; Niskanen et al. 2004). This program was originally designed to analyse human RR interval data; however, cats have higher heart and respiratory rate, which account for different peak frequencies observed in the spectral analysis derived from the RR intervals (Table 2). Thus, we used wider frequency intervals, according to a previously published study in the cat (Di Rienzo et al. 1991). To assess the heart rate variability, RR interval data were analysed with frequency domain methods. The most common frequency domain methods for heart rate variability analysis are the Fast Fourier Transform (FFT) algorithm and autoregressive methods. In this study, the statistical comparisons and calculations were derived from FFT data, although we also used autoregressive method for illustration of the main oscillatory components of heart rate variability in graphics. The order of the autoregressive fit was adjusted according to FFT data obtained from the ECG. Despite the fact that FFT calculations are more accurate than autoregressive models, the latter can be used for parametric estimation of the main characteristics of the power spectral density of heart rate variability, specially to resolve peak frequencies and to display a more normalized shape in the power graphics. The model order for autoregressive data analysis varied from 13 to 20. To reduce complex linear or non-linear trends in the RR interval signal, we used a detrending algorithm based on the smoothness priors method (Tarvainen et al. 2002). Processing the signal with this method reduces the power spectral density in the VLF range (<0.025 Hz), specially below the cut-off frequency (0.016 Hz). The very-low-frequency modulation of RR interval data has no biological interpretation in short ECG recordings, and could alter the estimation of the low-frequency component (Task Force, 1996). Spectral data obtained from RR intervals were analysed according to the following frequency bands: very-low frequency (VLF, 0.000–0.025 Hz), low frequency (LF, 0.025–0.140 Hz), and high frequency (HF, 0.140–0.600 Hz) bands (Di Rienzo et al. 1991). We used the LF/HF ratio to measure the autonomic influences on heart rate variability (Task Force, 1996). Calculations considered the total power of heart rate variability, the relative power of the three frequency bands expressed as percentages of total power, and LF and HF powers expressed as normalized units (which consider the percentage of total power minus the VLF component), and the LF/HF ratio.
Table 2. Effects of chronic intermittent hypoxia (CIH) exposure for four days on heart rate variability.
| Control | CIH | |
|---|---|---|
| RR interval (ms) | 259.0 ± 28.0 | 302.0 ± 17.0 |
| Heart rate (min−1) | 245.0 ± 25.0 | 202.0 ± 12.0 |
| Peak Frequencies | ||
| VLF (Hz) | 0.020 ± 0.001 | 0.020 ± 0.001 |
| LF (Hz) | 0.040 ± 0.010 | 0.030 ± 0.003 |
| HF (Hz) | 0.380 ± 0.06 | 0.300 ± 0.03 |
| Absolute powers | ||
| VLF (ms2) | 0.02 ± 0.01 | 0.05 ± 0.01 |
| LF (ms2) | 0.05 ± 0.03 | 0.15 ± 0.04* |
| HF (ms2) | 0.11 ± 0.05 | 0.06 ± 0.01** |
| Normalized powers | ||
| LF (n.u) | 36.0 ± 4.0 | 70.0 ± 1.0** |
| HF (n.u) | 64.0 ± 4.0 | 30.0 ± 1.0** |
P < 0.01
P < 0.001. Significantly different from control (Student's t test, n = 6 cats in control and CIH groups). n.u. normalized units. VLF, very-low-; LF, low- and HF, high-frequency bands.
Statistical analysis
Results were expressed as mean ± s.e.m. Ventilatory and CB chemosensory discharges measured at different levels of PO2 were fitted to the following exponential curve:
where R = response, Rbas = basal activity, Rmax = maximal response, and K = decay constant. To compare the effects of CIH on the maximal reactivity and on the ED50 of dose–response curves induced by NaCN, data were fitted to the logistic expression:
where D = dose, and S = Hill slope factor determining the steepness of each curve. The correlation coefficients for all adjusted curves were >0.95 (P < 0.01) for all conditions studied. Statistical differences between responses measured at different PO2 levels and dose–response curves of control versus CIH cats were analysed by a two-way ANOVA, and post hoc analyses were performed by the Bonferroni test. Differences for three or two samples were assessed by means of one-way ANOVA or Student's unpaired t test, respectively. The level of significance for the statistical analyses was P < 0.05.
Results
Effects of chronic intermittent hypoxia on basal variables
Table 1 shows the effects of a 4-day CIH exposure on basal levels of ventilatory and cardiovascular variables measured at the beginning of the experiments in seven cats. Basal Vt, VI, PET,CO2, BP, and fH in CIH cats were not significantly different from those observed in ten control cats (P > 0.05) and were similar to those previously reported in cats anaesthetized with sodium pentobarbitone (Oyarzun et al. 1991; Iturriaga et al. 1998). Despite the fact that CIH-treated cats had lower basal fR (P < 0.01), basal VI was unchanged (P > 0.05) due to a larger, although not statistically significant VT in the CIH group. The fx,bas measured in normoxic conditions at the beginning of the carotid sinus nerve recordings was significantly higher (P < 0.05; Student's unpaired t test) in cats exposed to CIH for 4 days (63.2 ± 7.3 Hz, n = 6) than fx,bas measured in control cats (36.3 ± 5.1 Hz, n = 6).
Table 1. Effects of four days of chronic intermittent hypoxia (CIH) on the baseline values of physiological variables measured at the beginning of the experiments.
| fx,bas (Hz) | fR (min−1) | VT (ml kg−1) | VI (ml min−1 kg−1) | PET,CO2 (Torr) | BP (Torr) | fH min−1 | |
|---|---|---|---|---|---|---|---|
| Control | 36.0 ± 5.1 | 30.9 ± 1.4 | 7.9 ± 0.5 | 253.4 ± 15.4 | 28.5 ± 1.0 | 129 ± 4.3 | 239.2 ± 11.7 |
| CIH | 63.2 ± 7.3* | 23.9 ± 3.4* | 9.9 ± 0.8 | 249.3 ± 23.5 | 27.6 ± 0.8 | 122.9 ± 6.9 | 212.6 ± 12.0 |
All physiological variables were measured in normoxic conditions. fx,bas, basal frequency of CB chemosensory discharge, measured for 60 s
P < 0.01, statistically different from control. Student's t test. n = 10 cats in control and 7 CIH cats, except n = 6 in both groups for fx recordings.
Effects of chronic intermittent hypoxia on ventilatory responses to acute hypoxia and NaCN
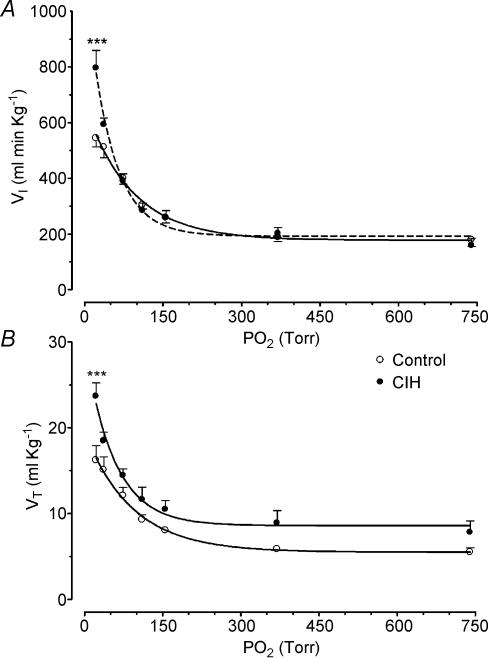
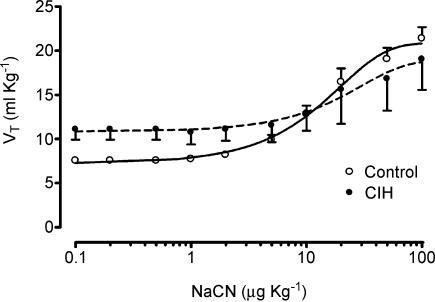
Both control and CIH cats demonstrated a preferential increase in Vt over fr in response to acute hypoxia and NaCN. The exposure to CIH for 2 days did not modify the cat ventilatory (Vt and Vi) responses elicited by hypoxia or NaCN (data not shown, n = 2). However, exposure of cats to CIH for 4 days enhanced the ventilatory responses (Vt and Vi) to acute hypoxia. The effects of CIH on Vi and Vt measured at several PO2 levels (20–740 Torr) are shown in Fig. 2. The curves for the relationships between PO2 and VI and VT were significantly different in four CIH cats as compared with six control cats (P < 0.001, two-way ANOVA). The Bonferroni test showed that VI and VT were statistically higher at a PO2 of about 20 Torr (Fig. 2). On the contrary, CIH did not enhance the Vt dose–response curve induced by NaCN (P > 0.05, two-way ANOVA), and the Bonferroni test did not show significant differences for any specific dose of NaCN between CIH and control animals (Fig. 3). The Hill slope coefficient and the ED50 for the adjusted curves were not different between both groups (control versus CIH group, Hill slope factor of 1.37 ± 0.35 versus 1.47 ± 1.80, and ED50 of 15.0 ± 1.3 versus 20.9 ± 2.9 μg kg−1, respectively, P > 0.05). Moreover, CIH did not change the maximal reactivity of VT induced by NaCN. Indeed, the VT,max predicted by the logistic fit model for the control group was 22.0 ± 1.5 ml kg−1, which was not statistically different from the Vt,max value for the CIH cats of 20.4 ± 4.6 ml kg−1 (P > 0.05).
Figure 2. Effects of CIH on ventilatory response to several levels of PO2 in four cats.
A, VI, inspiratory minute volume. B, Vt, tidal volume. ***P < 0.001, as compared with six control cats (Bonferroni test after two-way ANOVA). Error bars show s.e.
Figure 3. Effects of CIH on Vt dose–response curves to NaCN in four cats.
No significant statistical difference between both curves as compared with six control cats (two-way ANOVA and Bonferroni tests). Error bars show s.e.
Effects of chronic intermittent hypoxia on cardiovascular responses to hypoxia and NaCN, and heart rate variability
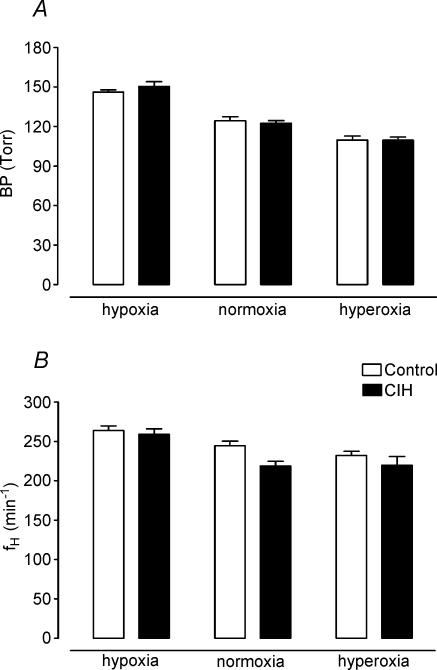
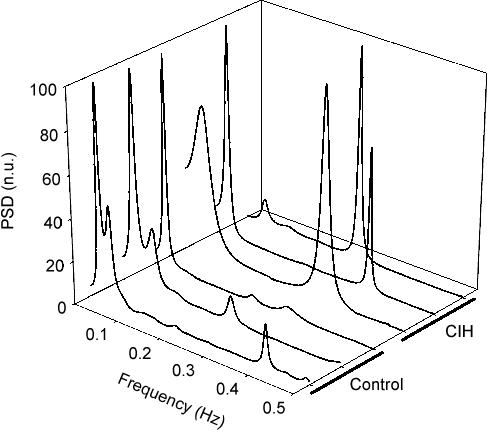
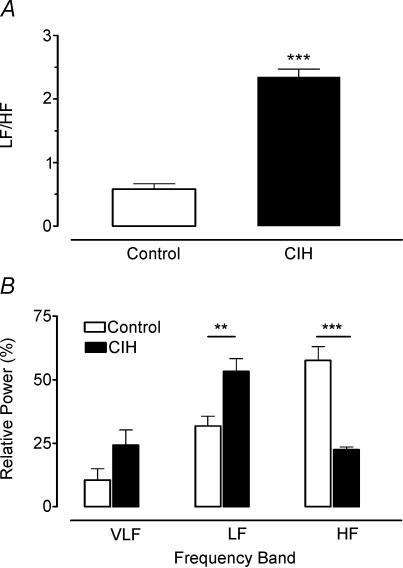
Figure 4 summarizes the effects of CIH on the cardiovascular variables (BP and fh) measured when cats breathed isocapnic hypoxic, normoxic and hyperoxic gas mixtures (PO2 of 22, 150 and 740 Torr, respectively). Clearly, successive lowering of PO2 from the hyperoxic level increased BP (Fig. 4A) and heart rate (Fig. 4B, P < 0.05, two-way ANOVA) in both experimental groups, but CIH did not enhance the amplitude of the responses with respect to control group (P > 0.05, two-way ANOVA). In addition, BPmax and fh,max elicited by doses of 100 μg kg−1 of NaCN were not different in both groups (data not shown). Thus, CIH did not potentiate the cardiovascular responses elicited by peripheral chemoreceptor stimulation. However, the spectral analysis of heart rate variability showed that CIH produced a marked modification of the distribution of the absolute and relative power of the oscillatory components of heart rate variability, without changing the peak frequencies (Table 2). Figure 5 illustrates the distribution of the spectral components of heart rate variability normalized to the total power in three CIH and three control cats. In the CIH cats, the power spectral density analysis showed a predominance of the low-frequency component over high-frequency, while the opposite situation is observed in control animals. As a result of the change in the distribution of the relative spectral components of heart rate variability, cats exposed to CIH showed a significantly higher LF/HF ratio (0.60 ± 0.10 and 2.40 ± 0.10 in control and CIH cats, respectively, P < 0.001, Student's t test). The effects of CIH on the LF/HF ratio and the relative power spectral density distribution of the very-low-, low- and high-frequency bands of the RR interval data are summarized in Fig. 6.
Figure 4. Effects of CIH on mean arterial blood pressure (BP) and heart rate (fH) at three levels of PO2 in six cats.
Lowering PO2 from the hyperoxic level increased BP and heart rate (P < 0.05), but CIH did not modify the amplitude of the responses related to six control cats (two-way ANOVA and Bonferroni test). Error bars show s.e.
Figure 5. Effects of CIH on power spectral density of heart rate variability in three CIH and three control cats.
PSD, power spectral density in normalized units (n.u).
Figure 6. Effects of CIH on the low/high frequency ratio (A) and distribution of relative power spectral density (B) of very-low- (VLF), low- (LF) and high-frequency (HF) bands in six CIH cats.
**P < 0.01 and ***P < 0.001, as compared with six control cats (Bonferroni test after two-way ANOVA). Error bars show s.e.
Effects of chronic intermittent hypoxia on CB chemosensory responses to NaCN and hypoxia
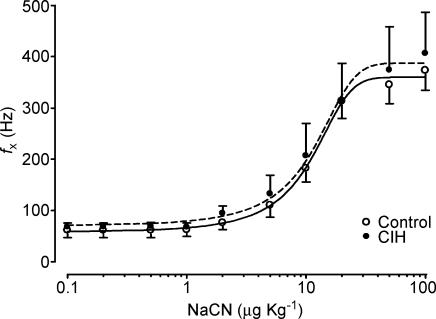
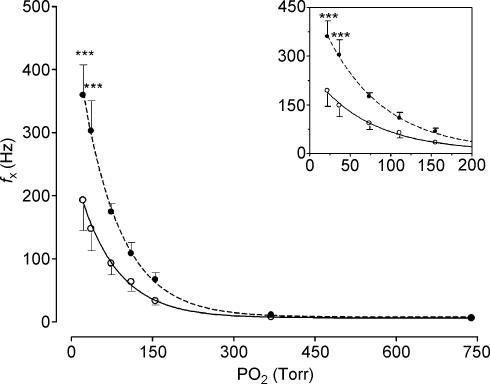
Chronic intermittent hypoxic exposure did not modify the CB chemosensory dose–response curve for NaCN (P > 0.05, two-way ANOVA, Fig. 7). The Hill slope coefficient and the ED50 for the adjusted curves were not different in both groups (control versus CIH group, Hill slope factor of 0.08 ± 0.01 versus 0.07 ± 0.02, and ED50 of 10.0 ± 1.2 versus 10.1 ± 2.4 µg kg−1, respectively, P > 0.05). CIH did not change the maximal reactivity of fx induced by NaCN (Fig. 3). The fx,max predicted by the logistic fit model for the control group was 360.0 ± 15.9 Hz and the fx,max value for the CIH cats was 387.7 ± 31.5 Hz (P > 0.05). In contrast to what happened with the responses elicited by NaCN, chemosensory responses to acute hypoxia were enhanced in the CIH cats as is shown in Fig. 8. The two-way ANOVA analysis showed that the overall chemosensory curve for PO2 was different in CIH cats (P < 0.001). The Bonferroni test showed that the chemosensory discharge was higher (P < 0.001) in the lowest hypoxic range in CIH cats.
Figure 7. Dose–response curves for increases in frequency of chemosensory discharges (fx) induced by NaCN in four CIH (•, dashed line) and six control cats (○, continuous line).
No significant statistical difference between curves (two-way ANOVA and Bonferroni test). Error bars show s.e.
Figure 8. Frequency of chemosensory discharges (fx) recorded at several levels of PO2 in four CIH (•, dashed line) and six control cats (○, continuous line).
***P < 0.001 (Bonferroni test after two-way ANOVA). Inset: detail of the same data, which illustrates the response in the hypoxic range.
Discussion
The main findings of this study are: (i) cats exposed to a pattern of short hypoxic episodes (PO2∼75 Torr) followed by normoxia during 8 h for 4 days showed an enhanced ventilatory response to acute hypoxia, but the ventilatory response induced by NaCN remained the same; (ii) basal CB chemosensory discharges were higher in CIH cats, and CB responses to hypoxia and NaCN showed the same pattern as ventilatory responses; and (iii) CIH did not augment either basal BP and fh or cardiovascular responses to hypoxia, but the spectral analysis of basal heart rate variability showed a marked increase of the LF/HF ratio. Thus, our results confirm and extend the observations of Peng et al. (2001, 2003), who found that CIH enhances CB chemosensory response to acute hypoxia in rats. Moreover, the present results support the idea that a few days of CIH are enough to produce a plastic change of CB reactivity to hypoxia, which may contribute to the augmented ventilatory response to acute hypoxia, and to early alterations in the autonomic balance, that regulates heart rate variability.
We found that ventilatory and carotid chemosensory responses induced by NaCN were not enhanced by 4 days of CIH. The fact that NaCN, a metabolic poison, increases chemosensory discharge has supported the idea that the oxidative metabolism of chemoreceptor cells is involved in the O2 sensing (metabolic hypothesis). However, NaCN stimulates the petrosal neurones that innervate the CB chemoreceptor cells. Indeed, we (Alcayaga et al. 1999) found that NaCN, but not hypoxia, stimulates cat petrosal ganglion neurones, suggesting different mechanisms of action. Thus, CIH may have a different effect on the CB responses elicited by NaCN and hypoxia.
Our results suggest that short-term CIH for 4 days is enough to enhance hypoxic responses in the cat CB, without changing the responses elicited by NaCN. However, we cannot rule out that a prolonged exposure to CIH or a severe hypoxic level may increase the response to other stimuli. Indeed, Prabhakar & Peng (2004) found that 10 days of more severe hypoxic episodes (∼5% O2 for 15 s followed by 5 min of normoxia, 9 times h−1 for 10 days) increases not only rat CB chemosensory responses to acute hypoxia, but also the response induced by NaCN. Similarly, Di Giulio et al. (2003) found that exposure to sustained severe hypoxia (PO2∼43 Torr) for 7 h augmented the cat CB chemosensory responses to hypoxia and NaCN.
Ventilatory and chemosensory effects of chronic intermittent hypoxia
Sustained hypoxia increases basal ventilation and HVR in humans and animals, a phenomenon termed ventilatory acclimatization (Bisgard, 2000). Ventilatory acclimatization induced by sustained hypoxia requires the presence of functional CBs, because it does not occur when the CBs are removed (Smith et al. 1986). Sustained hypoxia progressively increases both basal chemosensory discharges and chemosensory responses to acute hypoxia in 4 h in goats (Nielsen et al. 1988) and in 8 h in cats (Di Giulio et al. 2003). In humans, a mild hypoxia maintained for 8 h produces hyperventilation and hypocapnia and increases the reactivity of peripheral ventilatory chemoreflexes to hypoxia (Fatemian et al. 2001). Moreover, Mahamed et al. (2003) found that 3 h of isocapnic-sustained hypoxia produces in humans an enhancement of HVR, due to a decreased threshold of the ventilatory response to CO2. On the contrary, the effects of intermittent hypoxia on respiratory control and CB chemoreceptor function are less known. According to McGuire et al. (2003), intermittent hypoxia could be classified at least in two types: acute intermittent hypoxia (AIH), characterized by several hypoxic episodes over a short period of time, and CIH, characterized by several hypoxic episodes over a period of days or weeks. The AIH produces long-term facilitation of motor respiratory activity that lasts for several minutes after the end of the periodic of hypoxic challenge (Baker & Mitchell, 2000; Mitchell et al. 2001). In addition to the potentiation of the CB chemosensory responses, there is also evidence for central neural alteration, amplifying the central integration of CB chemoafferent inputs following CIH (Mitchell et al. 2001). Indeed, long-term facilitation of ventilatory response is elicited by intermittent but not sustained hypoxia, indicating that there are persistent changes in the output of the respiratory central pattern generator following intermittent peripheral chemoreceptor stimulation by hypoxia (Mitchell et al. 2001; Morris & Gozal, 2004).
Chronic intermittent hypoxia has been associated with augmented HVR in OSA patients and in animal models. Most of the evidence suggesting that HVR is augmented comes from studies performed in OSA patients (Cistulli & Sullivan, 1994; Narkiewicz et al. 1999; Mateika & Ellythy, 2003). However, in some studies a normal or even attenuated HVR has been also observed in patients with a long-term OSA history (Costes et al. 1995; Osanai et al. 1999). Nevertheless, a main problem with these studies is that peripheral chemoreflexes may be impaired by comorbidities such as obesity, ageing, hypertension and application of continuous positive airway pressure to treat the apnoeas. In a controlled study, done in patients with recently diagnosed OSA without treatment, Narkiewicz et al. (1999) found that reflex ventilatory, sympathetic and cardiovascular responses to acute hypoxia were enhanced. Studies performed in animal models have shown different effects of CIH on HVR. Ling et al. (2001) reported that phrenic HVR is enhanced in rats exposed to 5 min of ∼10% O2, followed by 5 min of air, 12 h night−1 for seven nights. Similarly, Reeves et al. (2003) found that rats exposed to a CIH pattern consisting of alternating episodes of room air and ∼10% O2 for 90 s for 30 days, showed an enhanced HVR. However, Greenberg et al. (1999) did not find any differences in ventilatory responses to hypoxia or hypercapnia in rats exposed for 30 s to 6.5–7% O2 followed by 30 s of normoxia, for 8 h day−1 for 10 days. Thus, the mechanism by which CIH alters the HVR seems to be highly dependent on the pattern and severity of CIH.
Effects of CIH on cardiovascular response and heart rate variability
Chronic exposure to intermittent hypoxia produces sustained systemic hypertension in rats (Greenberg et al. 1999; Fletcher, 2000). The hypertension has been attributed to an increased sympathetic outflow due to the repetitive hypoxic CB stimulation. Indeed, the denervation of the CB eliminates the hypertension induced by CIH (Fletcher et al. 1992; Bao et al. 1997). Fletcher et al. (1992) found an elevated arterial pressure in rats after 35 days of CIH exposure, but not after 10 days. On the contrary, Sica et al. (2000) and Peng et al. (2003) found that systolic arterial pressure increases in rats after 7 days of CIH with a pattern similar to the one employed by Fletcher et al. (1992, 1995). Narkiewicz et al. (1998b) found an augmented HVR in patients recently diagnosed with OSA. These patients were normotensive, without history of medication, and their blood gases were comparable to those of control subjects. Cistulli & Sullivan (1994) also found a similar increase of hypoxic ventilatory response in patients with severe OSA. Thus, the present results suggest that the time required for increasing arterial pressure and heart rate is longer than the time required to enhance HVR. Four days of intermittent hypoxia seem to be of insufficient duration to increase basal arterial pressure or cardiovascular responses to hypoxia. However, the spectral analysis of the RR interval data indicates that autonomic modulation of heart rate is early modified by CIH. We found that the LF/HF ratio was significantly higher (P < 0.001) in CIH cats (2.4 ± 0.1) as compared to control cats (0.6 ± 0.1). The spectral analysis of RR interval data indicates a clear effect of CIH that resembles what is observed in OSA patients. Certainly, patients with long-term or recently diagnosed OSA have an increased LF/HF ratio, and a relative predominance of the LF component of heart rate variability, with a reduced HF component (Shiomi et al. 1996; Narkiewicz et al. 1998a). In our model, we observed that CIH increases the LF component with a simultaneous reduction of the HF component. Thus, cats exposed to CIH in this study, similarly to OSA patients, show an increased LF/HF ratio suggesting the existence of early changes in autonomic control of heart rate. Nevertheless, we have to emphasize that these changes appear in cats after 4 days of exposure to CIH, compared to OSA patients, who usually have a longer history of snoring and disordered breathing during sleep. Thus, LF/HF ratio could be used as an early index of autonomic changes induced by CIH. Although it is still under debate, it is widely accepted that the LF/HF ratio is a measure of autonomic influences on heart rate variability (Task Force, 1996; Otzenberger et al. 1998). The LF and HF components are related to autonomic influences on heart rate (Task Force, 1996); while the HF component has been related to cardiac parasympathetic efferent activity, some authors consider that the LF interval of spectral power density is modulated by sympathetic cardiac efferences (Task Force, 1996; Pagani et al. 1997).
In summary, the present study shows that the CIH pattern of short episodes of hypoxia selectively enhances cat CB chemosensory and ventilatory responses to hypoxia after few days. Cardiovascular responses to hypoxia were not enhanced by CIH; however, the analysis of RR interval data showed a marked modification of the power spectral density distribution and an increased LF/HF ratio, similar to what is observed in OSA patients.
Acknowledgments
This work was supported by grant FONDECYT 1030330 from the National Fund for Scientific and Technological Development of Chile. Sergio Rey is supported by MD-PhD fellowship from MECESUP-PUC 0005. We would like to thank Mrs Carmen Gloria Leon, Mrs Paulina Arias and Ms Carolina Soto for their assistance in the preparation of the experiments.
References
- Alcayaga J, Varas R, Arroyo J, Iturriaga R, Zapata P. Responses to hypoxia of petrosal ganglia in vitro. Brain Res. 1999;845:28–34. doi: 10.1016/s0006-8993(99)01928-9. [DOI] [PubMed] [Google Scholar]
- Baker TL, Mitchell GS. Episodic but not continuous hypoxia elicits long-term facilitation of phrenic motor output in rats. J Physiol. 2000;529:215–219. doi: 10.1111/j.1469-7793.2000.00215.x. [DOI] [PMC free article] [PubMed] [Google Scholar]
- Bao G, Randhawa PM, Fletcher EC. Acute blood pressure elevation during repetitive hypocapnic and eucapnic hypoxia in rats. J Appl Physiol. 1997;82:1071–1078. doi: 10.1152/jappl.1997.82.4.1071. [DOI] [PubMed] [Google Scholar]
- Bisgard GE. Carotid body mechanisms in acclimatization to hypoxia. Respir Physiol. 2000;121:237–246. doi: 10.1016/s0034-5687(00)00131-6. [DOI] [PubMed] [Google Scholar]
- Cistulli PA, Sullivan CE. Pathology of sleep apnea. In: Saunders NA, Sullivan CE, editors. Sleep and Breathing. New York: Marcel Decker; 1994. pp. 405–448. [Google Scholar]
- Costes F, Court-Fortune I, Fournel P, Vergnon JM, Emonot A, Geyssant A. Study of chemosensitivity in patients believed to have sleep apnea syndrome. Rev Mal Respir. 1995;12:359–364. [PubMed] [Google Scholar]
- Di Giulio C, Huang WX, Mokashi A, Roy A, Cacchio M, Macri MA, Lahiri S. Sustained hypoxia promotes hyperactive response of carotid body in the cat. Respir Physiol Neurobiol. 2003;134:69–74. doi: 10.1016/s1569-9048(02)00203-3. [DOI] [PubMed] [Google Scholar]
- Di Rienzo M, Parati G, Castiglioni P, Omboni S, Ferrari AU, Ramirez AJ, Pedotti A, Mancia G. Role of sinoaortic afferents in modulating BP and pulse-interval spectral characteristics in unanesthetized cats. Am J Physiol Heart Circul Physiol. 1991;261:H1811–H1818. doi: 10.1152/ajpheart.1991.261.6.H1811. [DOI] [PubMed] [Google Scholar]
- Fatemian M, Kim DY, Poulin MI, Robbins PA. Very mild exposure to hypoxia for 8 h can induce ventilatory acclimatization in humans. Pflugers Arch. 2001;441:840–843. doi: 10.1007/s004240000491. [DOI] [PubMed] [Google Scholar]
- Fletcher EC. Effect of episodic hypoxia on sympathetic activity and blood pressure. Respir Physiol. 2000;119:189–197. doi: 10.1016/s0034-5687(99)00114-0. [DOI] [PubMed] [Google Scholar]
- Fletcher EC, Bao G, Miller CC. Effect of recurrent episodic hypocapnic, eucapnic, and hypercapnic hypoxia on systemic blood pressure. J Appl Physiol. 1995;78:1516–1521. doi: 10.1152/jappl.1995.78.4.1516. [DOI] [PubMed] [Google Scholar]
- Fletcher EC, Lesske J, Behm R, Miller CC, Stauss H, Unger T. Carotid chemoreceptors, systemic blood pressure, and chronic episodic hypoxia mimicking sleep apnoea. J Appl Physiol. 1992;72:1978–1984. doi: 10.1152/jappl.1992.72.5.1978. [DOI] [PubMed] [Google Scholar]
- Greenberg HE, Sica A, Batson D, Scharf SM. Chronic intermittent hypoxia increases sympathetic responsiveness to hypoxia and hypercapnia. J Appl Physiol. 1999;86:298–305. doi: 10.1152/jappl.1999.86.1.298. [DOI] [PubMed] [Google Scholar]
- Iturriaga R, Alcayaga J, Rey S. Sodium nitroprusside blocks the cat carotid chemosensory inhibition induced by dopamine, but not that by hyperoxia. Brain Res. 1998;799:26–34. doi: 10.1016/s0006-8993(98)00456-9. [DOI] [PubMed] [Google Scholar]
- Jonsson M, Kim C, Yamamoto Y, Runold M, Lindahl SG, Eriksson LI. Atracurium and vecuronium block nicotine-induced carotid body chemoreceptor responses. Acta Anaesthesiol Scand. 2000;46:488–494. doi: 10.1034/j.1399-6576.2002.460503.x. [DOI] [PubMed] [Google Scholar]
- Ling L, Fuller DD, Bach KB, Kinkead R, Olson EB, Mitchell GS. Chronic intermittent hypoxia elicits serotonin-dependent plasticity in the central neural control of breathing. J Neurosci. 2001;21:5381–5388. doi: 10.1523/JNEUROSCI.21-14-05381.2001. [DOI] [PMC free article] [PubMed] [Google Scholar]
- McGuire M, Zhang Y, White DP, Ling L. Chronic intermittent hypoxia enhances ventilatory long-term facilitation in awake rats. J Appl Physiol. 2003;95:1499–1508. doi: 10.1152/japplphysiol.00044.2003. [DOI] [PubMed] [Google Scholar]
- Mahamed S, Cunningham DA, Duffin J. Changes in respiratory control after three hours of isocapnic hypoxia in humans. J Physiol. 2003;547:271–281. doi: 10.1113/jphysiol.2002.030965. [DOI] [PMC free article] [PubMed] [Google Scholar]
- Mateika JH, Ellythy M. Chemoreflex control of ventilation is altered during wakefulness in humans with OSA. Respir Physiol Neurobiol. 2003;138:45–57. doi: 10.1016/s1569-9048(03)00174-5. [DOI] [PubMed] [Google Scholar]
- Mitchell GS, Baker TL, Nanda SA, Fuller DD, Zabka AG, Hodgeman BA, Bavis RW, Mack KJ, Olson EB. Intermittent hypoxia and respiratory plasticity. J Appl Physiol. 2001;90:2466–2475. doi: 10.1152/jappl.2001.90.6.2466. [DOI] [PubMed] [Google Scholar]
- Morris KF, Gozal D. Persistent respiratory changes following intermittent hypoxic stimulation in cats and human beings. Respir Physiol Neurol. 2004;140:1–8. doi: 10.1016/j.resp.2003.12.002. [DOI] [PubMed] [Google Scholar]
- Narkiewicz K, Montano N, Cogliati C, Van de Borne PJ, Dyken ME, Somers VK. Altered cardiovascular variability in obstructive sleep apnea. Circulation. 1998a;98:1071–1077. doi: 10.1161/01.cir.98.11.1071. [DOI] [PubMed] [Google Scholar]
- Narkiewicz K, Van De Borne PJ, Montano N, Dyken ME, Phillips BG, Somers VK. Contribution of tonic chemoreflex activation to sympathetic activity and blood pressure in patients with obstructive sleep apnea. Circulation. 1998b;97:943–945. doi: 10.1161/01.cir.97.10.943. [DOI] [PubMed] [Google Scholar]
- Narkiewicz K, Van De Borne PJ, Pesek CA, Dyken ME, Montano N, Somers VK. Selective potentiation of peripheral chemoreflex sensitivity in obstructive sleep apnea. Circulation. 1999;99:1183–1189. doi: 10.1161/01.cir.99.9.1183. [DOI] [PubMed] [Google Scholar]
- Nielsen AM, Bisgard GE, Vidruk EH. Carotid chemoreceptor activity during acute and sustained hypoxia in goats. J Appl Physiol. 1988;65:1796–1802. doi: 10.1152/jappl.1988.65.4.1796. [DOI] [PubMed] [Google Scholar]
- Niskanen J-P, Tarvainen MP, Ranta-aho PO, Karjalainen PA. Software for advanced HRV analysis. Comput Methods Programs Biomed. 2004 doi: 10.1016/j.cmpb.2004.03.004. in press. [DOI] [PubMed] [Google Scholar]
- Osanai S, Akiba Y, Fujiuchi S, Nakano H, Matsumoto H, Ohsaki Y, Kikuchi K. Depression of peripheral chemosensitivity by a dopaminergic mechanism in patients with obstructive sleep apnoea syndrome. Eur Respir J. 1999;13:418–423. doi: 10.1183/09031936.99.13241899. [DOI] [PubMed] [Google Scholar]
- Otzenberger H, Gronfier C, Simon C, Charloux A, Ehrhart J, Piquard F, Brandenberger G. Dynamic heart rate variability: a tool for exploring sympathovagal balance continuously during sleep in men. Am J Physiol Heart Circul Physiol. 1998;275:H946–H950. doi: 10.1152/ajpheart.1998.275.3.H946. [DOI] [PubMed] [Google Scholar]
- Oyarzun M, Iturriaga R, Donoso P, Dussaubat N, Santos M, Schiappacasse ME, Lathrop ME, Larrain C, Zapata P. Factors affecting the distribution of alveolar surfactant during resting ventilation. Am J Physiol Lung Cell Mol Physiol. 1991;261:L210–L217. doi: 10.1152/ajplung.1991.261.2.L210. [DOI] [PubMed] [Google Scholar]
- Pagani M, Montano N, Porta A, Malliani A, Abboud FM, Birkett C, Somers VK. Relationship between spectral components of cardiovascular variabilities and direct measures of muscle sympathetic nerve activity in humans. Circulation. 1997;95:1441–1448. doi: 10.1161/01.cir.95.6.1441. [DOI] [PubMed] [Google Scholar]
- Peng YJ, Kline D, Dick TE, Prabhakar NR. Chronic intermittent hypoxia enhances carotid body chemoreceptor response to low oxygen. Adv Exp Med Biol. 2001;499:33–38. doi: 10.1007/978-1-4615-1375-9_5. [DOI] [PubMed] [Google Scholar]
- Peng YJ, Overholt JL, Kline D, Kumar GK, Prabhakar NR. Induction of sensory long-term facilitation in the carotid body by intermittent hypoxia: implications for recurrent apneas. Proc Natl Acad Sci U S A. 2003;100:10073–10078. doi: 10.1073/pnas.1734109100. [DOI] [PMC free article] [PubMed] [Google Scholar]
- Peng YJ, Prabhakar NR. Reactive oxygen species in the plasticity of breathing elicited by chronic intermittent hypoxia. J Appl Physiol. 2003;94:2342–2349. doi: 10.1152/japplphysiol.00613.2002. [DOI] [PubMed] [Google Scholar]
- Powell FI, Dwinell MR, Aaron EA. Measuring ventilatory acclimatization to hypoxia, comparative aspects. Respir Physiol. 2000;122:271–284. doi: 10.1016/s0034-5687(00)00165-1. [DOI] [PubMed] [Google Scholar]
- Powell FI, Milsom WK, Mitchell GS. Time domains of the hypoxic ventilatory response. Respir Physiol. 1998;112:123–134. doi: 10.1016/s0034-5687(98)00026-7. [DOI] [PubMed] [Google Scholar]
- Prabhakar NR, Fields RD, Baker T, Fletcher EC. Intermittent hypoxia: cell to system. Am J Physiol Lung Cell Mol Physiol. 2001;281:L524–L528. doi: 10.1152/ajplung.2001.281.3.L524. [DOI] [PubMed] [Google Scholar]
- Prabhakar NR, Peng YJ. Peripheral chemoreceptors in health and disease. J Appl Physiol. 2004;96:359–366. doi: 10.1152/japplphysiol.00809.2003. [DOI] [PubMed] [Google Scholar]
- Reeves SR, Gozal E, Guo SZ, Sachleben LR, Brittian KR, Lipton AJ, Gozal D. Effect of long-term intermittent and sustained hypoxia on hypoxic ventilatory and metabolic responses in the adult rat. J Appl Physiol. 2003;95:1767–1774. doi: 10.1152/japplphysiol.00759.2002. [DOI] [PubMed] [Google Scholar]
- Shiomi T, Guilleminault C, Sasanabe R, Hirota I, Maekawa M, Kobayashi T. Augmented very low frequency component of heart rate variability during obstructive sleep apnoea. Sleep. 1996;19:370–377. doi: 10.1093/sleep/19.5.370. [DOI] [PubMed] [Google Scholar]
- Sica AL, Greenberg HE, Ruggiero DA, Scharf SM. Chronic-intermittent hypoxia: a model of sympathetic activation in the rat. Respir Physiol. 2000;121:173–184. doi: 10.1016/s0034-5687(00)00126-2. [DOI] [PubMed] [Google Scholar]
- Smith CA, Bisgard GE, Nielsen AM, Daristotle L, Kressin NA, Foster HV, Dempsey JA. Carotid bodies are required for ventilatory acclimatization to chronic hypoxia. J Appl Physiol. 1986;60:1003–1010. doi: 10.1152/jappl.1986.60.3.1003. [DOI] [PubMed] [Google Scholar]
- Tarvainen MP, Ranta-Aho PO, Karjalainen PA. An advanced detrending method with application to HRV analysis. IEEE Trans Biomed Eng. 2002;49:172–175. doi: 10.1109/10.979357. [DOI] [PubMed] [Google Scholar]
- Task Force of the European Society of Cardiology and the North American Society of Pacing and Electrophysiology. Heart rate variability. Standards of measurement, physiological interpretation, and clinical use. Eur Heart J. 1996;17:354–381. [PubMed] [Google Scholar]


